
Abstract
The effect of temperature on the physiochemical characteristics of a solid fuel or biocoal derived from the dried trunk of Adansonia digitata (Baobab) was studied using torrefaction processes. The chemical composition of the solid fuel or char obtained by wet (HTC) and dry torrefaction processes were determined by elemental and thermogravimetric (TGA) analyses. The Brunauer-Emmett-Teller (BET) surface area analyzer measured the porous texture and surface area of the prepared samples. The changes in the surface morphology and crystallinity of the prepared samples were evaluated by field-emission scanning electron microscopy (FE-SEM) and X-ray diffraction (XRD). The torrefaction process successfully improved the energy content from 16.8 MJ/kg to 22.0 MJ/kg, which was evidently higher than the starting precursors. The maximum energy yield obtained was 90.0% using dry torrefaction at 250 °C. The energy densification ratio was also higher for the char produced by the dry torrefaction process. However, the char produced by the HTC process at 250 °C showed the highest surface area. The pore diameter was higher for HTC-char produced at the same temperature. Overall the results revealed that the torrefaction of lignocellulosic biomass is beneficial for upgrading the fuel quality and energy densification of char residues.
Download PDF
Full Article
Comparative Evaluation of Physiochemical Properties of a Solid Fuel Derived from Adansonia digitata Trunk using Torrefaction
Zaira Z. Chowdhury,a,* Kaushik Pal,b Rafie Bin Johan,a Wageeh Abdulhadi Yehya Dabdawb,a Md. Eaqub Ali,a and Rahman Faizur Rafique c
The effect of temperature on the physiochemical characteristics of a solid fuel or biocoal derived from the dried trunk of Adansonia digitata (Baobab) was studied using torrefaction processes. The chemical composition of the solid fuel or char obtained by wet (HTC) and dry torrefaction processes were determined by elemental and thermogravimetric (TGA) analyses. The Brunauer-Emmett-Teller (BET) surface area analyzer measured the porous texture and surface area of the prepared samples. The changes in the surface morphology and crystallinity of the prepared samples were evaluated by field-emission scanning electron microscopy (FE-SEM) and X-ray diffraction (XRD). The torrefaction process successfully improved the energy content from 16.8 MJ/kg to 22.0 MJ/kg, which was evidently higher than the starting precursors. The maximum energy yield obtained was 90.0% using dry torrefaction at 250 °C. The energy densification ratio was also higher for the char produced by the dry torrefaction process. However, the char produced by the HTC process at 250 °C showed the highest surface area. The pore diameter was higher for HTC-char produced at the same temperature. Overall the results revealed that the torrefaction of lignocellulosic biomass is beneficial for upgrading the fuel quality and energy densification of char residues.
Keywords: Mild pyrolysis; Biomass; Solid Fuel; Torrefaction; Carbonization; Char
Contact information: a: Nanotechnology and Catalysis Research Center, University Malaya, Kuala Lumpur 50603, Malaysia; b: Wuhan University, 8 East Lake South Road, Nano-engineering Building, Wuchang, PR China 430072; c: Kumoh National Institute of Technology, Gumi, South Korea;
*Corresponding author: zaira.chowdhury76@gmail.com
INTRODUCTION
The rising demand for non-renewable fossil fuels has led to a global energy crisis (Chowdhury et al. 2016a,b). The burning of fossil fuel contributes to the emission of the greenhouse gases, which further initiates a major environmental challenge to be resolved. Biomass substrate has already proved its versatile application as a renewable energy source. These substrates can deliver an interminable energy supply by yearly planting and harvesting (Chowdhury et al. 2012a,b, 2013). By utilizing biomass, carbon can be recycled from the atmosphere (Ragauskas et al. 2006). The biomass can be transformed into various solid (char) and liquid biofuels using thermo- and biochemical processes. Until recently, different types of technologies have been developed to convert biomass into solid, liquid, and gaseous fuels that have higher energy contents (Kaygusuz 2009; Chowdhury et al. 2012a,b, 2013). These technologies include combustion, torrefaction, pyrolysis, liquefaction, digestion, fermentation, and gasification processes. Among all the processes, torrefaction and pyrolysis are regarded as thermochemical methods. The direct combustion of biomass has few technical problems. The transportation and storage of biomass residues are difficult, as these have low energy density and can easily undergo deformation. Furthermore, due to its fibrous texture, pulverization of biomass is far more difficult when compared to coal (Esteban et al. 2006). The high moisture and oxygen contents, with low bulk density of the biomass residues, create difficulties during transportation, handling, and storage. These limitations generate obstacles for its expansive utilization. Also, it contains high contents of alkalis and chlorine, which causes failures of boilers due to corrosion, fouling, and slagging during the combustion and co-combustion processes (Hardy et al. 2012). To address these problems, dry and wet torrefaction-often referred to as hydrothermal carbonization (HTC), can be used, because these techniques can transform biomass into a potential solid fuel. Torrefaction was earlier performed for different biomass samples, and it was observed that it could yield solid fuel or char (Felfli et al. 2005). The char produced by torrefaction is usually hydrophobic and contains less moisture (Sadaka and Negi 2009). The torrefaction process in the presence or absence of water can considerably increase both energy density (Prins et al. 2006; Yan et al. 2009; Rousset et al. 2011) and higher heating values (HHV) (Bridgeman et al. 2008; Couhert et al. 2009; Deng et al. 2009; Yan et al. 2009) of biomass substrates.
Torrefaction, in the absence of water, is sometimes also referred to as mild pyrolysis. It is usually performed under an inert gas flow at temperatures ranging from 200 °C to 300 °C. The end products of dry torrefaction are solid char and gaseous fuels. The process not only helps to lower the oxygen level but it also increases the proportional content of carbon inside the char matrix. Overall about 60% to 80% of mass yield can be obtained (Lynam et al. 2011) during this process. The hemicellulose present in the biomass depolymerizes during the torrefaction process and releases volatile components that have lower energy values. Therefore, the remaining solid obtained after torrefaction always has high energy density values (Basu et al. 2014).
Although dry torrefaction increases the calorific values with better grindability and hydrophobicity of the resultant char, wet torrefaction appears to have a few additional and significant advantages (Yan et al. 2009). Wet torrefaction (HTC) is conducted at approximately 180 °C to 250 °C (Pala et al. 2014) and under a pressure of approximately 4.6 MPa (Lynam et al. 2011), due to the water vapors and evolved gases. Within the HTC reactor the temperature reaches above 200 °C. The water remains in a liquid phase due to the high pressure. In these subcritical conditions, water has a high concentration of ions that have an influence on biomass transformation, just like an acid or a base catalyst (Lynam et al. 2011). Due to this unusual property of water, it is often referred to as the “green catalyst” for the thermochemical conversion process. Torrefaction using water takes place through a series of hydrolysis, condensation, decarboxylation, and dehydration reactions (Funke and Ziegler 2010). Wet torrefaction (HTC) of lignocellulosic residues usually produces gases (mostly CO2), aqueous chemicals (primarily sugars and organic acids), and char (often called HTC biochar or hydro char) (Reza et al. 2013). The HTC process requires a lower temperature and it can be used for biomass having a high content of moisture that normally requires an intensive drying process. It can reduce ash content through washing it out with hot compressed water (Pala et al. 2014). Additionally, previous literature shows that wet torrefaction was more effective when considering the upgrading of energy densification in comparison to dry torrefaction (Yan et al. 2009). However, HTC needs more advanced reactors to function at elevated pressures. Previously, few works were devoted to the characterization of products arising from the wet torrefaction treatment of biomass fuels. This includes pine sawdust (Yan et al. 2009), agricultural residues (Oliveira et al. 2013), corn stalk, forest waste (Xiao at al. 2012), or eucalyptus sawdust, and barley straw (Sevilla et al. 2011).
The baobab tree and its correlated species belong to the Malvaceae family and the Adansonia genus. The African baobab has versatile applications and it is big with a large trunk (up to 10 m in diameter). The tree can grow up to 25 m in height and it can live for hundreds of years (Kaboré et al. 2011). The plant is grown profusely throughout the hot and drier regions of tropical Africa (Kaboré et al. 2011). Previously no studies have been reported to perform the torrefaction of the Adansonia digitata (Baobab) trunk to yield char. This research studied the important solid fuel properties of char with its chemical composition using ultimate and proximate analyses, crystallinity index, surface-morphological changes, and mass yield including energy content and energy densification values after dry and wet torrefaction processes.
EXPERIMENTAL
Materials
The dried chips obtained from the trunk of Adansonia digitata (Baobab) were purchased from Pilot Furniture Manufacturers (PTY) Ltd. (Babelegi, South Africa). The samples were labeled as BT and were then ground to a fine powder using a ball mill (MTI-SFM, Richmond, USA). After ball milling, the samples were sieved using a 70-mesh screen to obtain a fine powder with homogenous particle size. The powdered sample was washed vigorously with hot deionized water. Next, it was dried at 110 °C for 24 h and kept in a closed plastic bottle before initial characterization and torrefaction
Methods
Wet and dry torrefaction process
Wet torrefaction, or HTC, of the dried BT sample was performed at 200 °C, 230 °C, and 250 °C. For this purpose a mixture of BT and water (BT:water = 1:30, w/v) was placed in a Teflon-lined autoclave. The autoclave was closed and kept in an inert atmosphere by passing N2 gas through the reactor. The flow rate of the N2 gas was kept constant at 5 L/min for 30 min to evacuate the oxygen from inside. Then the reactor was heated slowly at a rate of 5 °C/min until the desired temperature was reached. A magnetic stirrer was used to agitate the mixture at 500 rpm inside the reactor. The HTC process was performed for 120 min. After 120 min, the heating process including the agitation of the mixture was stopped. The sample inside the reactor was then allowed to cool to room temperature under the nitrogen flow. Vacuum filtration was performed to separate the solid char from the liquid byproducts. The wet torrefied solid samples were washed carefully with acetone to remove any organic residual liquids. The samples were then oven-dried for 6 h at 105 °C. Based on the HTC temperature, the samples were labeled as WBT-200, WBT-230, and WBT-250. The samples were then used for further characterization.
Dry torrefaction of BT powder was performed using a quartz tubular reactor. Next, 5 g of sample was placed into a small porcelain crucible, and the crucible loaded with the sample was positioned inside the middle of the reactor at room temperature. The reactor was then heated at a rate of 5 °C/min. Nitrogen gas was passed throughout the reaction time to ensure an inert atmosphere. The samples were heated to reach the desired temperature (200 °C, 230 °C, and 250 °C). After reaching the targeted temperature, the samples were kept there for 120 min. Through the flow of nitrogen gas the samples were cooled to ambient temperature. The samples were further washed and oven-dried at 105 °C for 6 h. The dry torrefied samples obtained were labeled as DBT-200, DBT-230, and DBT-250 and were used for further characterization.
Analytical methods
The char yield was calculated as the ratio of the produced hydrochar weight (after washing and drying) to the dry ash free weight of BT subjected to wet and dry torrefaction at different temperatures under investigation using Eq. 1 (Kalderis et al. 2014),
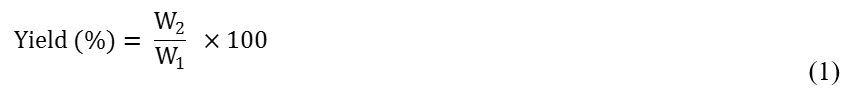
where W2 is the hydrochar weight after washing and drying (g) and W1 is the dry ash free weight of starting biomass (g).
An advance bomb calorimeter (CAL-2K, Gauten, South Africa) was used to determine the energy content of the dried ash free char sample using a method described in previous literature (Saqib et al. 2014), where 1 g of dried ash free char was placed inside the bomb and was ignited in the presence of oxygen. Equations 2 and 3 were used for the calculation of the energy densification ratio and energy yield (Saquib et al. 2014),
The process for determining the pH, electrical conductivity (EC), and cation exchange (CEC) properties of char was described in the authors’ previous work (Chowdhury et al. 2016). The method to determine the pH of the prepared char sample was described earlier by Novak et al. (2009). Approximately 2 g of char sample was mixed with 40 mL of deionized water, and the mixture was shaken for 30 min. The powdered char sample settled after 15 min. The pH of the clear solution was then measured using the pH electrode 827 pH Lab (Metrohm, California, USA). About 1 g of fresh char sample was agitated with 10 mL of deionized water for 24 h in a conical flask. After the sample had settled at the bottom, the electrical conductivity was measured using a conductometer (Jenway 4510, Liverpool, UK). The values for the cation exchange capacity (CEC) of the prepared char samples were determined by the ammonium acetate (NH4OAc) extraction methods described in previous literature (Song and Guo 2012; Melo et al. 2013). For this measurement approximately 0.5 g of char sample was mixed with 40 mL of 1 M ammonium acetate (NH4OAc ) solution, and it was placed in a 50-mL glass centrifuge tube. The mixture was agitated for 20 min at room temperature. The sample was filtered using a glass fiber filter-using (0.45 µm) vacuum. The char residue on the filter was further washed with two 20-mL portions of 1 M NH4OAc solution, followed by three 30-mL portions of isopropanol. Lastly, it was washed with four 50-mL portions of 1 M potassium chloride KCl solution. The rinsate thus obtained was diluted with deionized water to make up a volume of 250 mL. The Kjeldahl method was used to measure the NH4+ ions concentration (Melo et al. 2013). The CEC (mmolc·kg−1) of the char sample was calculated by standardizing the amount of NH4+ in the rinsate with the mass of char sample used (0.5 g).
The changes in the surface morphological features for the starting BT sample along with its torrefied samples were observed using a scanning electron microscope (SEM, Model Leo Supra 50VP Field Emission, London, UK). The starting samples (BT) and the prepared char samples after torrefaction were analyzed using a CHNOS elemental analyzer (PerkinElmer-2400, Tokyo, Japan). Thermogravimetric analysis (Mettler Toledo Star SW901, Tokyo, Japan) was performed to determine the moisture, volatile material, fixed carbon, and ash contents of the prepared sample. The crystalline properties of the BT samples and the chars were observed using X-ray diffraction (XRD) analysis (D5005 apparatus, Bruker, Germany) at 40 kV and 40 mA with a Cu-Ka radiation source. The Brunauer-Emmett-Teller (BET) surface area, pore volume, and pore size distribution of the prepared char samples along with the starting biomass were analyzed with an Autosorb 1 Quantachrome Autosorb (Tokyo, Japan) automated gas sorption system.
RESULTS AND DISCUSSION
Influence of Temperature on Mass and Energy Yield during Wet and Dry Torrefaction
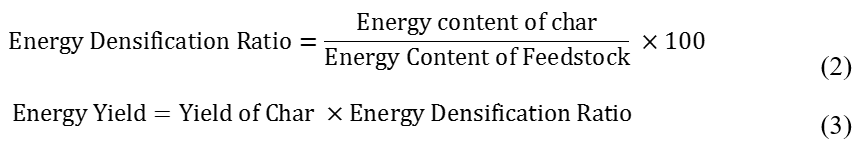
The mass yield of the char decreased with increasing temperature of the wet (HTC) and dry torrefaction process, as illustrated in Table 1. The maximum yield obtained for wet torrefaction was 71.25% at 200 °C, and it decreased to 63.78% at 250 °C. The dry torrefaction process gave a maximum yield of 65.76% at 200 °C and a minimum yield of 57.99% at 250 °C. Under the same temperature and retention time, the mass yield for dry torrefaction was comparatively lower than the HTC process. This illustrated that the torrefaction in the presence of water could yield more char under the same experimental conditions. In both processes, the char yield decreased with increasing temperature (Brachi et al. 2016). A similar trend was observed during torrefaction of tomato peels by previous researchers.
Table 1: Mass Yield, Energy Yield, Energy Content and Energy Densification Ratio of the Char
At lower temperatures, the disintegration of cellulose and hemicellulose took place, which caused lignin to disintegrate to some extent. However, much of the lignin decomposed at a higher temperature due to its stable chemical nature. Later on, the successive increase in temperature promoted the cracking of long chain-like, high molecular weight volatile compounds. This would result in the formation of smaller chain organic compounds with less molecular weight. Further devolatilazation would yield gaseous products rather than char itself (Thangalazhy-Gopakumar et al. 2010). Therefore, the enhancement of dehydration and elimination reactions with increasing temperature would cause reduced char yield (Brachi et al. 2016; Bacaoui et al. 2001; Lua and Yang 2004; Adinata et al. 2007). The phenomenon of perceived lessening of the char yield with increasing temperature was evident, and it has been described in other literature as well (Garcia-Perez et al. 2008; DeSisto et al. 2010; Keiluweit et al. 2010; Saquib et al. 2014).
Table 1 illustrates the energy content, energy densification ratio, and energy yield trends of the prepared char and the torrefaction temperature. At the higher temperatures the mass yield was reduced but the energy content was higher. The hydrochar derived from microalgae had an energy content of 30 MJ/kg to 32 MJ/kg (Heilmann et al. 2010). The energy content of Adansonia digitata (Baobab) Trunk was calculated as 22.4 MJ/kg. However, after torrefaction it increased subsequently with increasing temperature. The energy content of char produced by dry torrefaction was slightly higher than that from the HTC process (Yan et al. 2009). The energy content of the char obtained by the dry torrefaction process at 250 °C was highest near 27.5 MJ/kg. Also, the other energy profile of the prepared char sample, including the densification ratio and energy yield, were higher for dry torrefaction compared to the wet torrefaction process (Table 1). The highest energy densification ratio observed was 1.22 with an energy yield of 70.7% at 250 °C during the dry torrefaction process.
Influence of Temperature on Physiochemical Characteristics of Char during Wet and Dry Torrefaction
Ultimate (CHNOS) analysis
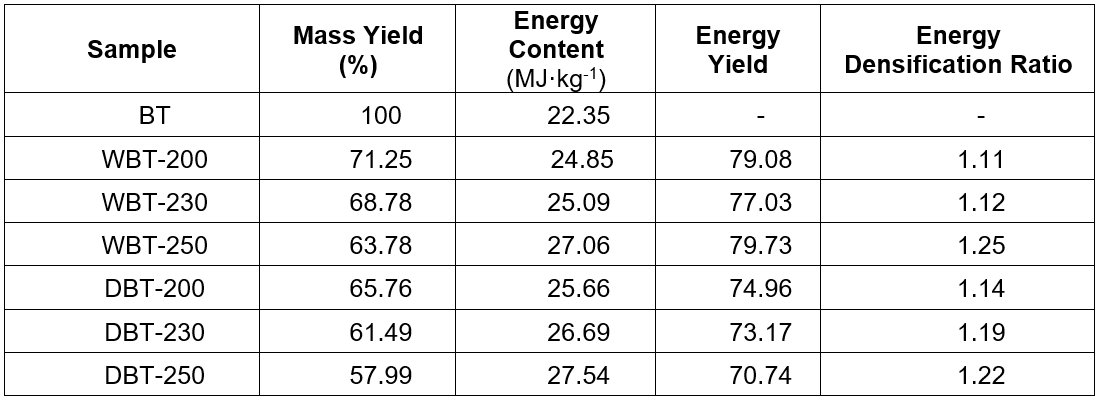
The elemental composition of BT and the char obtained by wet and dry torrefaction processes are shown in Table 2.
Table 2. Characteristics of Adansonia digitata (Baobab) Trunk and the Torrefied Char at Different Temperatures
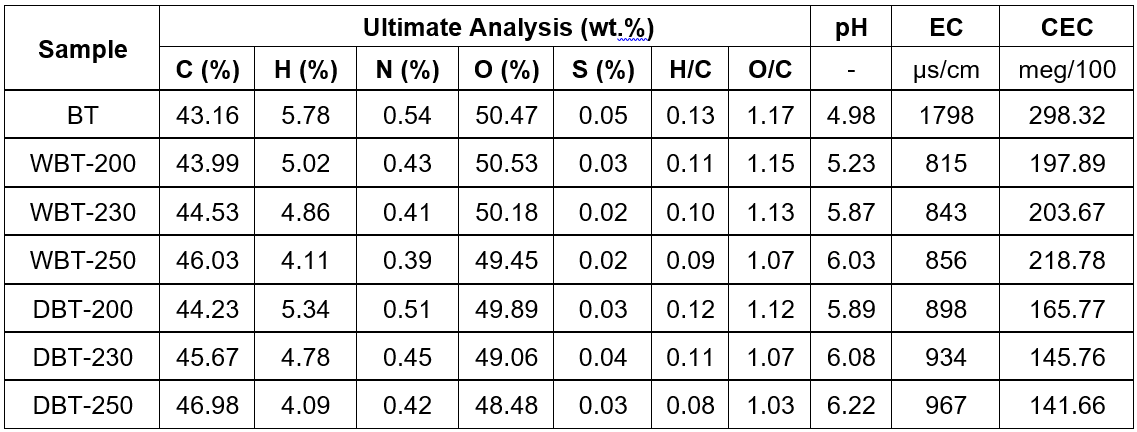
The results exhibited the increasing trend of carbon inside the char matrix from 43.2% to 46.0% with increased wet torrefaction temperature. A similar trend was also observed for the dry torrefaction process. This illustrated that the extent of carbonization increased by enhancing the torrefaction temperature (Chun et al. 2004; Chen et al. 2012). However, the hydrogen and oxygen contents decreased successively with increasing temperature during the HTC process. This was attributed to the breaking of weaker bonds during the carbonization process (Demirbas 2004).
The reducing trend observed in the torrefied char samples in the hydrogen and oxygen contents was ascribed to the decline in the -OH groups and other oxygen-containing functional groups that formed with the increased temperature (Phanphanich and Mani 2011). However, in both torrefactions, the hydrogen and oxygen contents decreased slightly with increased temperature. The hydrochars produced between 200 °C and 250 °C showed H/C ratios of 0.11 to 0.09 and O/C ratios of 1.15 to 1.07. These ratios were clearly different from those obtained with swine manure (H/C = 1.50, O/C = 0.57) (Cao et al. 2011), digested maize silage (H/C = 1.26, O/C = 0.24), and cellulose (H/C = 1.17 and O/C = 0.35) (Mumme et al. 2011). The differences may have been due to the differences in the starting material composition and the torrefaction process conditions.
Figure 1 displays the H/C and O/C atomic ratios with respect to torrefaction temperature. By determining these two ratios of the carbonaceous sample, the extent of aromaticity and carbonization was elucidated (Krull et al. 2009). A substantial reduction of the H/C and O/C atomic ratios was observed compared to the starting biomass of the BT with increasing temperature. Lesser O/C ratios in char indicate its stability in the soil (Melo et al. 2013). The BT biomass sample had low aromaticity. Therefore, it had a relatively high H/C atomic ratio. A higher temperature initiated an increased rate of organic reactions, such as dehydration, decarboxylation, and decarbonylation of the sample (Kim et al. 2011; Chowdhury et al. 2016a). These results were similar with the observation previously depicted for producing graphitic black carbon, switch grass, and pine-based woody bio-char (Schmidt and Noack 2000; Kim et al. 2011).
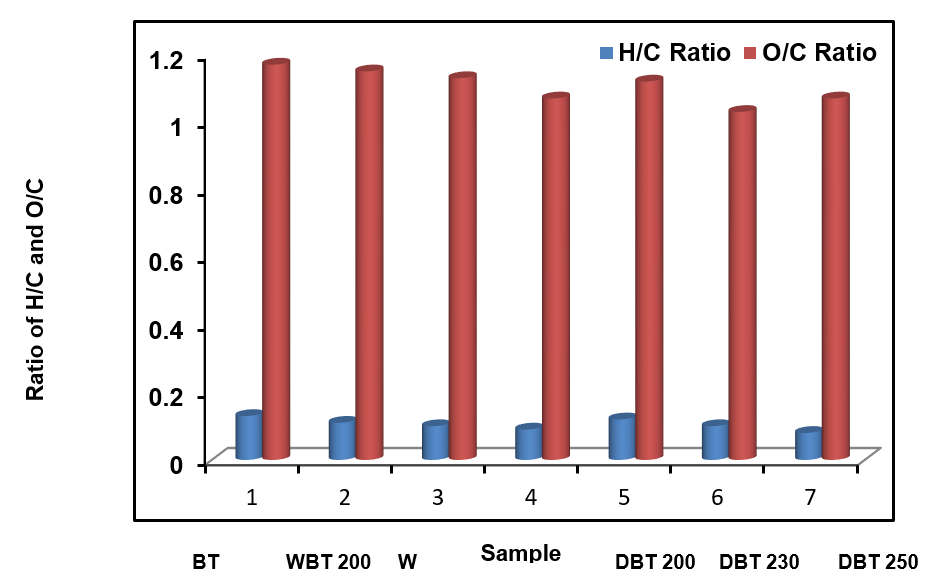
Fig. 1. Comparison of H/C and O/C ratios of BT and chars produced at various temperatures
A higher torrefaction temperature led to higher pH values of the resultant char (Yuan et al. 2011). This was attributed to the existence of more ash residues in the char sample produced at higher torrefaction temperatures (Melo et al. 2013). The feedstock had a pH of 4.98, which increased to 6.03 at 250 °C during the HTC process, whereas in dry torrefaction, the maximum pH was approximately 6.22 at 250 °C. Once the maximum was reached, it only slightly decreased with increasing temperature.
The EC values represent the salinity of the char sample. Salinity can adversely influence the growth rate of plants. Char samples that had high EC values would decrease the water uptake of plants, which results in lower nutrient consumption (Chan et al. 2008). The EC values of the prepared char sample increased slightly with the increasing temperature for both types of torrefaction process. The cation exchange properties (CEC) of the prepared char declined with consecutive enhancement of torrefaction temperature. This might have been due to the lower number of acidic groups present (Gaskin et al. 2008; Sing et al. 2010; Mukherjee et al. 2011; Song and Guo 2012).
Proximate analysis
The proximate analysis of the starting biomass and the torrefied char sample was examined by a thermo-gravimetric analysis. The representative parameters of the thermal degradation analysis are listed in Table 3.
Table 3. Proximate Analysis of Adansonia digitata (Baobab) Trunk and the Torrefied Char at Different Temperatures
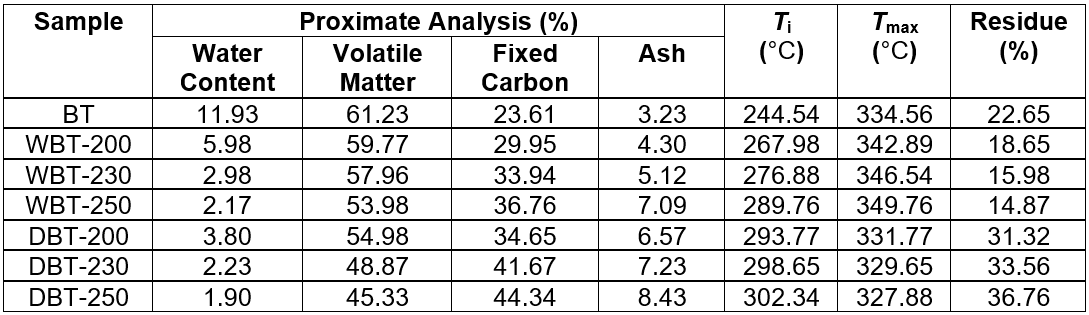
The amount of fixed carbon increased with an increase in the torrefaction temperature. The ash residues indicated the presence of non-volatile and non-combustible materials in the char sample (Mukherjee et al. 2011; Angin 2013). The successive increase in temperature formed more ash residue and fixed carbon in both types of char. However, the proportion of volatile components decreased with increased temperature. In a previous study, an analogous observation was reported for the carbonization of seed press cake that was obtained from a safflower sample (Angin 2013). Table 3 shows that the onset temperature of devolatilization (Ti), which corresponded to a weight loss of 5% with respect to the final weight loss, increased subsequently with increasing temperature. The temperature values for the maximum rate of devolatilization (Tmax) moved to a higher temperature during the wet torrefaction process. This implies that the thermal stability of wet torrefied BT-based char had been enhanced. However, for the dry torrefied sample, these values slightly decreased with increasing temperature. This phenomenon was further supported by an XRD analysis. During wet torrefaction, the amorphous cellulose domain and smaller crystallites with short chains were selectively removed, while the larger cellulose crystallites remained unaltered. Some of the newly formed intra- and inter-molecular hydrogen bonds between the contiguous cellulose crystallites resulted in the development of larger crystallites (Zheng et al. 2014). This enhanced the thermal stability of the wet torrefied char sample. Near 850 °C, there were less of the carbonaceous remains that were obtained for the wet torrefied samples than the starting BT sample. In contrast, the carbonaceous residues for the dry torrefied samples were considerably increased with the successive increase in torrefaction temperature, as shown in Table 3. This can be elucidated from the different chemical configuration of the torrefied sample. The wet torrefied sample contained an increased amount of cellulose and decreased amount of alkali metal inside the char, which resulted in a reduced amount of char residues. However, the increased residues for the dry torrefied sample were endorsed for the increased amount of acid and alkali metal fractions as ash residues (Wannapeera et al. 2011).
SEM image analysis
The SEM images of BT and the corresponding char sample after wet torrefaction (HTC) at various temperatures are illustrated Fig. 2. The morphological features of the original feedstock (BT) clearly altered after both types of treatments. The surface of the original BT sample was regular, smooth, and compact, which exhibited its intact morphology (Fig. 2a).
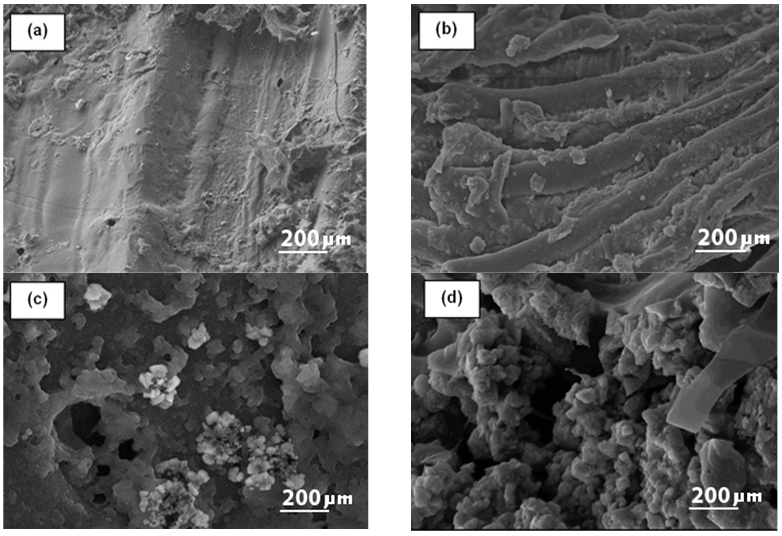
Fig. 2. SEM imagines of (a) BT; (b) WBT-200; (c) WBT-230; and (d) WBT-250 (Magnification 12000 x, 20 kV, Low vacuum)
The hydrothermal carbonization around 200 °C resulted in defibration, to yield separate microfibers with occasional deposition over the surface (Fig. 2b). A further increase in HTC-temperature to 230 °C caused a serious breakdown of the lignocellulosic structure; thereby several cracks were observed (Fig. 2c). Tiny aggregates of uneven shaped pores were detectable on the surface between the tiny microspheres of lignin droplets (Fig. 2c). At an HTC temperature of 250 °C, substantial destruction of the feedstock was noticeably observed (Fig. 2d). The surface was visibly rough with uneven folds. The number of spherical-shaped droplets increased (Kristensen et al. 2008). This might have been attributed to the partial melting of lignin and wax materials at 250 °C under compact pressure with consequent condensation. The HTC treatment disrupted the complex network of lignocellulosic biomass mainly by dissolving the hemicelluloses within. Thus at lower temperatures, the micro-fibrillar cellulosic texture was still conserved (Fig. 2b). Some lignin polymers along with some carbohydrates also may have been deposited onto the surface of the cellulose fibers (Zhu et al. 2009). At lower temperatures, the microfibrils of the BT sample were not entirely separated, initially, but they were somewhat twisted due to the partial removal of hemicellulose and lignin. These types of structural changes were observed in previous literature (Selig et al. 2007; Xu et al. 2007; Zeng et al. 2007; Donohoe et al. 2008). The char obtained after dry torrefaction at different temperatures is shown in Fig. 5.
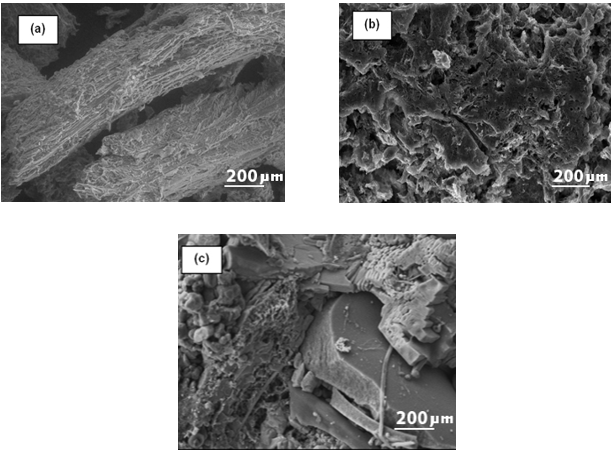
Fig. 3. SEM images of (a) DBT-200, (b) DBT-230, and (c) DBT-250 (Magnification 12000 x, 20 kV, Low vacuum)
After torrefaction at 200 °C, certain portions of the hemicellulose were burnt as gases, and the BT sample was defibrillated (Fig. 3a). With an increased temperature of 230 °C and 250 °C, the sample was fragmented into small pieces, and some pores also were developed over its surface (Figs. 3b and 3c). The porous texture was advantageous for upgrading the quality of the soil for growing microbes (Thies and Rilling 2009). This showed that both the wet and dry torrefaction treatments for BT were effective in producing well-defined mesopores on the surfaces of the char sample.
Surface area with pore size distribution analysis
The BET surface area, BJH cumulative surface area, total pore volumes, and pore diameter of the prepared char samples are listed in Table 4. When the HTC temperature increased from 200 °C to 250 °C, the BET and BJH cumulative surface area of the char sample considerably increased. Additionally, at a higher hydrothermal temperature of 250 °C, the BET surface area was enhanced up to 2.565 m2/g which was more than two fold the surface area of the starting feedstock BT sample (1.034 m2/g).
Table 4. BET Surface Area Analysis of Adansonia digitata (Baobab) Trunk and the Torrefied Char at Different Temperatures
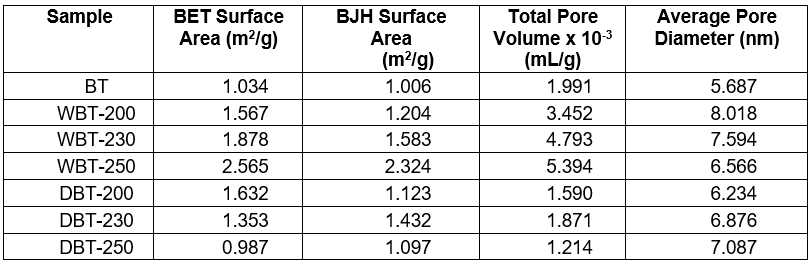
This surface area change was associated with the reduction of organic compounds through the volatilization process during char formation (Cantrell et al. 2012). The consecutive increase in the temperature during the HTC process expedited the release of more volatile materials. This would result in a larger surface area with substantially enhanced pore volume of the prepared char sample. A larger surface area is preferable for char because it upsurges the moisture holding capacity of the soil (Theis and Rilling 2009; Shaban et al. 2013). However the opposite trend was observed for the torrefied char, for which the surface area decreased with increased temperature. This might have been due to the deposition of ash residues inside the pores. Based on the internal diameter; the pores could have been classified as micropores (less than 2 nm), mesopores (from 2 nm to 50 nm), and macropores (larger than 50 nm) (Rouquerol et al. 1999). The char prepared in this study were meso-porous. The diameter and volume of the pores obtained by the HTC process were greater compared to the dry torrefaction process.
X-Ray diffraction (XRD) analysis
The crystallinity index (CrI) of the BT sample was comparatively less (around 31.6%). However, after the wet torrefaction process, the HTC char showed higher CrI values. The CrI increased with the elevated temperature from 37.0% for WBT-200 to 48.7% for WBT-250 sample. This revealed that the HTC process could considerably improve the crystallinity degree of the BT sample.
Table 5. Crystalline Parameters of Adansonia digitata (Baobab) Trunk and the Torrefied Char at Different Temperatures
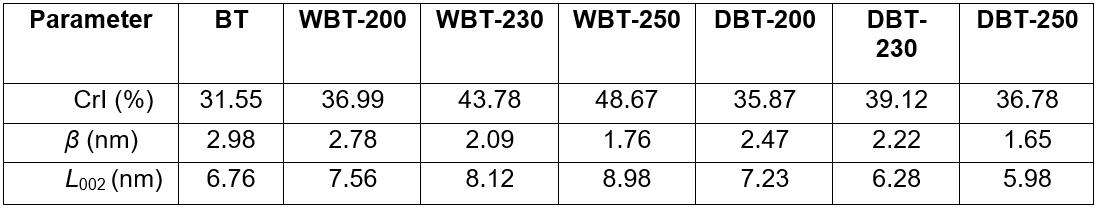
During the HTC process, the bio-macromolecule of hemicellulose and amorphous regions of cellulose with certain parts of lignin were disintegrated to yield liquid chemicals. However, a major portion of the crystalline domain of cellulose remained undamaged and consecutively formed solid char (Yu and Wu 2010). This affected the crystallinity index of the HTC char sample. The dry torrefaction could also enhance the crystallinity degree as demonstrated by the increased CrI of DBT-200, DBT-230, and DBT-250. Nevertheless, at severe conditions, when the torrefaction temperature was increased from 200 °C to 250 °C, the disintegration of the crystalline region of cellulose started to take place. Thus, the CrI of DBT-250 decreased to 36.78%. It was reported earlier that certain smaller least ordered cellulose crystallites could have been degraded during the HTC process because they are reactive, but the bulky and impeccable cellulose crystallites will persist as unaltered (Xiao et al. 2011). Therefore, the crystalline size (L002) of the HTC char was enhanced. Conversely, the bigger cellulose crystallites that were present in the BT sample may have been disorderly arranged themselves, and later on disintegrated due to harsh conditions during the dry torrefaction at 250 °C. Therefore, the crystallite size of DBT-250 was decreased to 1.65. The full width at half maximum of (002) peak (β) in the XRD profiles of the HTC char sample decreased successively with increased temperature.
CONCLUSIONS
This research explored the potential of Adansonia digitata (Baobab) trunk to produce char using dry and wet torrefaction (HTC) methods. Both dry and wet torrefaction (HTC) processes were promising methods to transform the lignocellulosic biomass to high-energy solid fuel or char for subsequent application. Temperature considerably affects the mass and energy yield, and physio-chemical properties of solid fuel products from both the processes. The conclusions can be summarized as:
- The mass loss percentages with energy content were higher for the dry torrefaction process. Thus, the HTC process was able to produce a greater amount of char with less energy content.
- The proportion of carbon and ash contents increased subsequently with temperature for both types of char. The increased trend of carbon showed better fuel properties of the prepared char.
- The char obtained by the dry torrefaction process showed a greater energy densification ratio with higher energy yield compared to the HTC process.
- The surface area, pore volume, and pore diameter values of the HTC process were higher than the dry torrefaction process. Thus, the HTC char indicated greater potential to retain moisture in soil and thereby proved to be more beneficial for plant growth than the char obtained from dry torrefaction process.
- The cation exchange capacity (CEC) of the prepared char was reduced somewhat with increased temperature. Nevertheless, the electrical conductivity (EC) and pH values showed an opposite trend with an elevated temperature in the wet and dry torrefaction processes.
- The crystallinity index (CrI) for both types of char increased after both the wet and dry torrefaction process. However, after a certain limit, increased temperature in the dry torrefaction process showed a lower crystallinity index, which was due to a severe disintegration of crystalline cellulose at higher temperature.
ACKNOWLEDGMENTS
The authors are grateful for the financial support from the grant-BKP (BK054-2015), FP054-2016 and Grand Challenge GC-001B-14 SBS from the University of Malaya, Malaysia in completing this work.
REFERENCES CITED
Adinata, D., Daud, M. A.W., and Aroua, M. K. (2007). “Preparation and characterization of activated carbon from palm shell by chemical activation with K2CO3,” Bioresource Technol. 98(1), 145-149. DOI: 10.1016/j.biortech.2005.11.006
Angin, D. (2013). “Effect of pyrolysis temperature and heating rate on biochar obtained from pyrolysis of safflower seed press cake,” Bioresource Technol. 128, 593-597. DOI: 10.1016/j.biortech.2012.10.150
Bacaoui, A., Yaacoubi, A., Dahbi, A., Bennouna, C., Luu, R., Maldonado-Hodar, F. J., Rivera-Utrilla, J., and Moreno-Castilla, C. (2001). “Optimization of conditions for the preparation of activated carbons from olive-waste cakes,” Carbon 39(3), 425-432. DOI: 10.1016/S0008-6223(00)00135-4
Brachi, P., Miccio, F., Miccio, M., and Ruoppolo, G. (2016). “Torrefaction of tomato peel residues in a fluidized bed of inert particles and a fixed-bed reactor,” Energy Fuels 30, 4858-4868. DOI: 10.1021/acs.energyfuels.6b00328.
Basu, P., Sadhukhan, A. K., Gupta, P., Rao, S., Dhungana, A., and Acharya, B. (2014). “An experimental and theoretical investigation on torrefaction of a large wet wood particle,” Bioresource Technol. 159, 215-22. DOI: 10.1016/j.biortech.2014.02.105
Bridgeman, T. G., Jones, J. M., Shield, I., and Williams, P. T. (2008). “Torrefaction of reed canary grass, wheat straw, and willow to enhance solid fuel qualities and combustion properties,” Fuel 87(6), 844-856. DOI: 10.1016/j.fuel.2007.05.041
Cantrell, K. B., Hunt, P. G., Uchimiya, M., Novak, J. M., and Ro, K. S. (2012). “Impact of pyrolysis temperature and manure source on physicochemical characteristics of biochar,” Bioresource Technol. 107, 419428. DOI: 10.1016/j.biortech.2011.11.084
Cao, X., Ro, K. S., Chappell, M., Li, Y., and Mao, J. (2011). “Chemical structures of swine manure chars produced under different carbonization conditions investigated
by advanced solid-state 13C nuclear magnetic resonance (NMR) spectroscopy,”
Energ. Fuel. 25(1), 388-397. DOI: 10.1021/ef101342v
Couhert, C., Salvador, S., and Commandré, J. M. (2009). “Impact of torrefaction on syn gas production from wood,” Fuel 88(11), 2286-2290. DOI:10.1016/j.fuel.2009.05.003
Chan, K. Y., van Zwieten, L., Meszaros, I., Downie, A., and Joseph, S. (2008). “Agronomic values of green waste biochar as a soil amendment,” Soil Res. 45(8) 629-634. DOI: 10.1071/SR07109
Chowdhury, Z. Z., Zain, S. M., Khan, R. A., and Khalid, K. (2012a). “Batch and fixed bed adsorption studies of lead(II) cations from aqueous solutions onto granular activated carbon derived from Mangostana garcinia shell,” BioResources 7(3), 2895-2915. DOI: 10.15376/biores.7.3.2895-2915
Chowdhury, Z. Z., Zain, S. M., Khan, R. A., and Khalid, K. (2012b). “Process variables optimization for preparation and characterization of novel adsorbent from lignocellulosic waste,” BioResources 7(3), 3732-3754. DOI: 10.15376/biores.7.3.3732-3754
Chowdhury, Z. Z., Abdul Hamid, S. B., Das, R., Hasan, M. R., Zain, S. M., Khalid, K., and Uddin, M. N. (2013). “Preparation of carbonaceous adsorbents from lignocellulosic biomass and their use in removal of contaminants from aqueous solution,” BioResources 8(4), 6523-6555. DOI: 10.15376/biores.8.4.6523-6555
Chowdhury, Z. Z., Abd Hamid, S. B., Rahman, Md. M., and Rafique, R. F. (2016a). “Catalytic activation and application of micro-spherical carbon derived from hydrothermal carbonization of lignocellulosic biomass: Statistical analysis using Box-Behnken design,” RSC Advances 6(104), 102680-102694. DOI: 10.1039/C5RA26189A
Chowdhury, Z. Z., Karim, Md. Z., Ashraf, M. A., and Khalid, K. (2016b). “Influence of carbonization temperature on physicochemical properties of biochar derived from slow pyrolysis of durian wood (Durio zibethinus) sawdust,” BioResources 1(2), 3356-3372. DOI: 10.15376/biores.1.2.3356-3372
Chen, Y. Q., Yang, H. P., Wang, X. H., Zhang, S. H., and Chen, H. P. (2012). “Biomass-based pyrolytic polygeneration system on cotton stalk pyrolysis: Influence of temperature,” Bioresource Technol. 107, 411-418. DOI: 10.1016/j.biortech.2011.10.074
Chun, Y., Sheng, G. Y., Chiou, C. T., and Xing, B. S. (2004). “Compositions and sorptive properties of crop residue-derived chars,” Environ. Sci. Technol. 38(17), 4649-4655. DOI: 10.1021/es035034w
Demirbas, A. (2004). “Effects of temperature and particle size on bio-char yield from pyrolysis of agricultural residues,” J. Anal. Appl. Pyrol. 72(2), 243-248. DOI: 10.1016/j.jaap.2004.07.003
Deng, J., Wang, G. J., Kuang, J. H., Zhang, Y. L., and Luo, Y. H. (2009). “Pretreatment of agricultural residues for co-gasification via torrefaction,” J. Anal. Appl. Pyrolysis 86(2), 331-337. DOI: 10.1016/j.jaap.2009.08.006
DeSisto, W. J., Hill, N., Beis, S. H., Mukkamala, S., Joseph, J., Baker, C., Ong, T. H., Stemmler, E. A., Wheeler, M. C., Frederick, B. G., and van Heiningen, A. (2010). “Fast pyrolysis of pine sawdust in a fluidized-bed reactor,” Energy Fuels 24(4), 2642-2651. DOI: 10.1021/ef901120h
Donohoe, B. S., Decker, S. R., Tucker, M. P., Himmel, M. E., and Vinzant, T. B. (2008). “Visualizing lignin coalescence and migration through maize cell walls following thermochemical pretreatment,” Biotechnol. Bioeng. 101(5), 913-925. DOI: 10.1002/bit.21959
Felfli, F. F., Luengo, C. A., Suárez, J. A., and Beatón, P. A. (2005). “Wood briquette torrefaction,” Energ. Sustain. Dev. 9(3), 19-22. DOI: 10.1016/S0973-0826(08)60519-0
Funke, A., and Ziegler, F. (2010). “Hydrothermal carbonization of biomass: A summary and discussion of chemical mechanisms for process engineering,” Biofuels, Bioprod. Biorefin. 4(2), 160-177. DOI: 10.1002/bbb.198
Gaskin, J. W., Stener, C., Haris, K., Das, K. C., and Bibens, B. (2008). “Effect of low-temperature pyrolysis conditions on biochar for agricultural use,” Transactions of the ASABE 51(6), 2061-2069. DOI: 10.13031/2013.25409
Garcia-Perez, M., Wang, X. S., Shen, J., Rhodes, M. J., Tian, F. J., Lee, W. J., Wu, H. W., and Li, C. Z. (2008). “Fast pyrolysis of oil mallee woody biomass: Effect of temperature on the yield and quality of pyrolysis products,” Ind. Eng. Chem. Res. 47(6). 1846-1854. DOI: 10.1021/ie071497p
Hardy, T., Musialik-Piotrowska, A., Ciołek, J., Mościcki, K., and Kordylewski, W. (2012). “Negative effects of biomass combustion and co-combustion in boilers,” Enviro Protec Engin, 38(1), 25-33.
Heilmann, S. M., Davis, H. T., Jader, L. R., Lefebvre, P. A., Sadowsky, M. J., and Schendel, F. J. (2010). “Hydrothermal carbonization of microalgae,” Biomass Bioenerg. 34(6), 875-882. DOI: 10.1016/j.biombioe.2010.01.032
Kaygusuz, K. (2009). “Biomass as a renewable energy source for sustainable fuels,” Energ. Source.-A: Recovery, Utilization, and Environmental Effects 31(6), 535-545. DOI: 10.1080/15567030701715989
Keiluweit, M., Nico, P. S., Johnson, M. G., and Kleber, M. (2010). “Dynamic molecular structure of plant biomass-derived black carbon (biochar),” Environ. Sci. Technol. 44(4), 1247-1253. DOI: 10.1021/es9031419
Kim, P., Johnson, A., Edmunds, C. W., Radosevich, M., Vogt, F., Rials, T. G., and Labbe, N. (2011). “Surface functionality and carbon structures in lignocellulosic-derived biochars produced by fast pyrolysis,” Energ. Fuel. 25, 4693-4703. DOI: org/10.1021/ef200915s
Krull, E. S., Baldock, J. A., Skjemstad, J. O., and Smernik, R. J. (2009). “Characteristics of biochar: Organo-chemical properties,” in: Biochar for Environmental Management: Science and Technology, J. Lehmann, S. Joseph (eds.), Earthscan, London, UK.
Kristensen, J. B., Thygesen, L. G., Felby, C., Jørgensen, H., and Elder, T. (2008). “Cell-wall structural changes in wheat straw pretreated for bioethanol production,” Biotechnol. Biofuels 1(1), 1-5. DOI: 10.1186/1754-6834-1-5
Lua, A. C., and Yang, T. (2004). “Effect of activation temperature on the textural and chemical properties of potassium hydroxide activated carbon prepared from pistachio nut shell,” J. Colloid Interf. Sci. 274(2), 594-601. DOI: 10.1016/j.jcis.2003.10.001
Melo, L. C. A., Coscione, A. R., Abreu, C. A., Puga, A. P., and Camargo, O. A. (2013). “Influence of pyrolysis temperature on cadmium and zinc sorption capacity of sugar cane straw-derived biochar,” BioResources 8(4), 4992-5004. DOI: 10.15376/biores.8.4.4992-5004
Mumme, J., Eckervogt, L., Pielert, J., Diakité, M., Rupp, F., and Kern, J. (2011). “Hydrothermal carbonization of anaerobically digested maize silage,” Bioresource Technol. 102(19), 9255-9260. DOI: 10.1016/j.biortech.2011.06.099
Mukherjee, A., Zimmerman, A. R., and Harris, W. (2011). “Surface chemistry variations among a series of laboratory-produced biochars,” Geoderma 163(3-4), 247-255. DOI: 10.1016/j.geoderma.2011.04.021
Novak, J. F., Busscher, W. J., Laird, D. L., Ahmedna, M., Watts, D. W., and Niandou, M. A. S. (2009). “Impact of biochar amendment on fertility of a southeastern coastal plain soil,” Soil Science 174(2), 105-112. DOI: 10.1097/SS.0b013e3181981d9a
Pala, M., Kantarli, I. C., Buyukisik, H. B., and Yanik, J. (2014). “Hydrothermal carbonization and torrefaction of grape pomace,” Bioresource Technol. 161, 255-62. DOI: 10.1016/j.biortech.2014.03.052
Phanphanich, M., and Mani, S. (2011). “Impact of torrefaction on the grindability and fuel characteristics of forest biomass,” Bioresource Technol. 102(2), 1246-1253. DOI: 10.1016/j.biortech.2010.08.028
Prins, M. J., Ptasinski, K. J., and Janssen, F. J. J. G. (2006). “Torrefaction of wood, Part 1: Weight loss kinetics,” J. Anal. Appl. Pyrol. 77(1), 28-34. DOI: 10.1016/j.jaap.2006.01.002
Ragauskas, A. J., Williams, C. K., Davison, B. H., Britovsek, G., Cairney, J., and Eckert, C. A. (2006). “The path forward for biofuels and biomaterials,” Science 311(5760), 484-489. DOI: 10.1126/science.1114736
Reza, M. T., Lynam, J. G., Uddin, M. H., and Coronella, C. J. (2013). “Hydrothermal carbonization: Fate of inorganics,” Biomass Bioenerg. 49, 86-94. DOI: 10.1016/j.biombioe.2012.12.004
Rousset, P., Aguiar, C., Labbé, N., and Commandré, J. M. (2011). “Enhancing the combustible properties of bamboo by torrefaction,” Bioresource Technol. 102(17), 8225-8231. DOI: 10.1016/j.biortech.2011.05.093
Rouquerol, F., Rouquerol, I., and Sing, K. (1999). Adsorption by Powders and Porous Solids, Academic Press, London, UK.
Sadaka, S., and Negi, S. (2009). “Improvements of biomass physical and thermochemical characteristics in via torrefaction process,” Environ. Prog. Sustain. Energy 28(3), 427-434. DOI: 10.1002/ep.10392
Schmidt, M. W. I., and Noack, A. G. (2000). “Black carbon in soils and sediments: Analysis, distribution, implications, and current challenges,” Global Biogeochem. Cycles 14(3), 777-793. DOI: 10.1029/1999GB001208
Selig, M. J., Viamajala, S., Decker, S. R., Tucker, M. P., Himmel, M. E., and Vinzant, T. B. (2007). “Deposition of lignin droplets produced during dilute acid pretreatment of maize stems retards enzymatic hydrolysis of cellulose,” Biotechnol. Prog. 23(6), 1333-1339. DOI: 10.1021/bp0702018
Sevilla, M., Maciá-Agulló, J. A., and Fuertes, A. B. (2011). “Hydrothermal carbonization of biomass as a route for the sequestration of CO2: Chemical and structural properties of the carbonized products,” Biomass Bioenerg 35(7), 3152-3159. DOI: 10.1016/j.biombioe.2011.04.032
Song, W., and Guo, M. (2012). “Quality variations of poultry litter biochar generated at different pyrolysis temperatures,” J. Anal. Appl. Pyrol. 94, 138-145. DOI: 10.1016/j.jaap.2011.11.018
Thangalazhy-Gopakumar, S., Adhikari, S., Ravindran, H., Gupta, R. B., Fasina, O., Tu, M., and Fernando, S. D. (2010). “Physiochemical properties of bio-oil produced at various temperatures from pine wood using an auger reactor,” Bioresource Technol. 101(21), 8389-8395. DOI: 10.1016/j.biortech.2010.05.040
Thies, J. E., and Rillig, M. C. (2009). “Characteristics of biochar: Biological properties (Chapter 6),” in: Biochar for Environmental Management, J. Lehmann, S. Joseph (eds.), Earthscan, Gateshead, UK, pp 85-105.
Wannapeera, J., Fungtammasan, B., and Worasuwannarak, N. (2011). “Effects of temperature and holding time during torrefaction on the pyrolysis behaviors of woody biomass,” J. Anal. Appl. Pyrol. 92 (1), 99-105. DOI: 10.1016/j.jaap.2011.04.010
Xu, Y. J., Li, K. C., and Zhang, M. Y. (2007). “Lignin precipitation on the pulp fibers in the ethanol-based organosolv pulping,” Colloid. Surface A 301(1-3), 255-263. DOI: 10.1016/j.colsurfa.2006.12.078
Xiao, L. P., Shi, Z. J., Xu, F., and Sun, R. C. (2012). “Hydro-thermal carbonization of lignocellulosic biomass,” Bioresource Technol. 118, 619-623. DOI:
Xiao, L. P., Sun, Z. J., Shi, Z. J., Xu, F., and Sun, R. C. (2011). “Impact of hot compressed water pretreatment on the structural changes of woody biomass for bioethanol production,” BioResources 6(2), 1576-1598. DOI: 10.15376/biores.6.2.1576-1598
Yan, W., Tapas, C. A., Coronella, C. J., and Victor, R. V. (2009). “Thermal pretreatment of Lignocellulosic biomass,” Environmental Progress and Sustainable Energy 28(3), 435-440. DOI: 10.1002/ep.10385
Yuan, J. H., Xu, R. K., and Zhang, H. (2011). “The forms of alkalis in the biochar produced from crop residues at different temperatures,” Bioresource Technol. 102(3), 3488-3497. DOI: 10.1016/j.biortech.2010.11.018
Yu, Y., and Wu, H. W. (2010). “Significant differences in the hydrolysis behavior of amorphous and crystalline portions within microcrystalline cellulose in hot compressed water,” Ind. Eng. Chem. Res. 49(8), 3902-3909. DOI: 10.1021/ie901925g
Zeng, M. J., Mosier, N. S., Huang, C. P., Sherman, D. M., and Ladisch, M. R. (2007). “Microscopic examination of changes of plant cell structure in corn stover due to hot water pretreatment and enzymatic hydrolysis,” Biotechnol. Bioeng. 97(2), 265-278. DOI: 10.1002/bit.21298.
Zhu, Z. G., Sathitsuksanoh, N., Vinzant, T., Schell, D. J., McMillan, J. D., and Zhang, Y.-H. P. (2009). “Comparative study of corn stover pretreated by dilute acid and cellulose solvent-based lignocellulose fractionation: Enzymatic hydrolysis, supramolecular structure, and substrate accessibility,” Biotechnol. Bioeng. 103(4), 715-724. DOI: 10.1002/bit.22307
Article submitted: December 12, 2016; Peer review completed: February 11, 2017; Revisions accepted: April 4, 2017; Published: April 12, 2017.
DOI: 10.15376/biores.12.2.3816-3833