
Abstract
The crown architecture and structural growth strongly affect the total volume and biomass of Norway spruce trees at a specific age. The main objective of this study was to explore the branching strategy of young spruce trees growing in a highly-dense naturally regenerated forest stand. The level of branching described by the Gravelius order of the growth units, as well as the unit’s branching direction and angles were analyzed. The significant factors that influence the occurrence frequency of growth units were the branching order and their life status. The results manifested the highest frequency of growth units in the first and second order in given conditions. A significant association between the branching direction of the mother unit and the first successive growth unit of higher order was revealed. Also, the mean branching angles were influenced by the branching order and relative position of the growth unit in relation to the mother unit. The branching angle distributions were left-skewed and the angles varied between 40° and 70°. The results improve our understanding of structural development of spruce crowns and can contribute to more realistic modeling of biomass production using tree growth simulators.
Download PDF
Full Article
Crown Architecture and Structural Development of Young Norway Spruce Trees (Picea abies Karst.): A Basis for More Realistic Growth Modelling
Marek Fabrika,a,* Ľubomír Scheer,a Robert Sedmák,a Winfried Kurth,b and Martin Schön a
The crown architecture and structural growth strongly affect the total volume and biomass of Norway spruce trees at a specific age. The main objective of this study was to explore the branching strategy of young spruce trees growing in a highly-dense naturally regenerated forest stand. The level of branching described by the Gravelius order of the growth units, as well as the unit’s branching direction and angles were analyzed. The significant factors that influence the occurrence frequency of growth units were the branching order and their life status. The results manifested the highest frequency of growth units in the first and second order in given conditions. A significant association between the branching direction of the mother unit and the first successive growth unit of higher order was revealed. Also, the mean branching angles were influenced by the branching order and relative position of the growth unit in relation to the mother unit. The branching angle distributions were left-skewed and the angles varied between 40° and 70°. The results improve our understanding of structural development of spruce crowns and can contribute to more realistic modeling of biomass production using tree growth simulators.
Keywords: Norway spruce; Crown; Growth unit; Branching strategy
Contact information: a: Faculty of Forestry, Technical University in Zvolen, 96053 Zvolen, Slovak Republic; b: Abteilung Ökoinformatik, Biometrie und Waldwachstum, Georg-August-Universität Göttingen, Büsgenweg 4, 37077 Göttingen, Germany; *Corresponding author: fabrika@tuzvo.sk
INTRODUCTION
The growth of plants is affected by genetic and environmental factors. Genetic factors define the general species-specific shape of an organism, which environmental conditions subsequently modify. Temperature, moisture, and light are among the most important environmental factors. Also, competition pressure plays an important role in plant growth and development (Grassi and Giannini 2005; Bögre et al. 2008). Light and its distribution are important for the proper physiological processes of plants, which can affect the formation of new tissues and the subsequent production of new organs, such as branches and leaves. Changes in the plant structure are obvious, especially in cases of insufficient light. Inappropriate light conditions affect the bud development because of changes in hormone production (Müller and Leyser 2011).
The exploration and modelling of interactions of the environment, structure, and growth can be considered an important part of plant research. Mathematical modelling in combination with experimentation can lead to a better understanding and more effective research on many tasks related to bioresource management (Lintunen et al. 2011).
Experimental knowledge of the branching architecture of tree crowns is important for the modelling of trees. The most often used mathematical and theoretical framework for modelling tree branching architecture is the formalism of L-systems (Prusinkiewicz and Lindenmayer 1996). Numerous studies have focused on modelling plant morphology and appropriate modelling approaches (Honda 1971; Kurth 1994, 1999; Yan et al. 2004; Kurth 2007; Beyer et al. 2014). Nevertheless, because of the large variety in tree crown architectures and related factors, as well as the enormous time consumption required for data acquisition, only a few studies have provided detailed experimental data of tree crown patterns measurements.
Because the growth processes are dependent upon the plant structure, which is highly affected by the environment and growth resources as well, it is necessary to increase the research into plant structures and connect it to practical applications. The best solution in this context is the use of functional-structural plant models that simulate the development of plant structures and take into account plant physiology and environmental factors (Federl and Prusinkiewicz 1999; Kantola 2008; Cieslak et al. 2011). However, these models are difficult to use for practical forestry at their current level of development. Thus, hybrid modelling approaches must be used. The incorporation of ecophysiological knowledge about tree structures into empirical growth simulators may enhance these models and make them a more powerful tool for research and management (Tjoelker et al. 2007; Powel and Lenhard 2012).
Empirical models can be used for prediction of biometrical variables growth as are increments of tree diameter and tree height, or differences of tree crown parameters in single years. These parameters are thereafter also transformed to tree morphology development using functional-structural models. Increment process alone is controlled by the empirical model and development of stem and branches morphology is controlled by the growth grammars of functional-structural models. Annual internodes changes are then controlled by the annual increment values from empirical model as parameters of growth grammars. It is very effective to employ a fusion of both approaches, which simplifies and accelerates modelling of trees morphology. This approach is suitable especially in situations where, for a given area, the empirical tree model exists but there is not enough data for functional-structural model parametrization.
Norway spruce (Picea abies Karst.) is one of 36 known spruce species. It is one of the most widespread and economically valuable conifers in Europe. The complex growth–environment–health status relationship is undergoing fundamental changes, especially in the mountain forests of Central Europe. Rapidly changing climatic conditions have considerable influence on the growth and yield of Norway spruce (Bošeľa et al. 2014; Pretzsch et al. 2014).
The main objective of this study was to analyze the crown structural growth (expressed by the number, order, and direction of the growth units) and branching strategy of young Norway spruce trees. For the purpose of this study, a growth unit (GU) was defined as the segment of a branch/trunk that resulted from one uninterrupted season of primary growth and represents a basic component of the structural development of the tree. Several assumptions and hypotheses about the GUs and their branching direction were established:
the distribution of the branching orders in the sense of Gravelius order (Gravelius 1914) among the GUs is affected by the competition stress caused by interfering trees; the trees affected by high stand density are expected to have a smaller frequencies and proportions of higher order GUs,
the branching directions are evenly distributed in the initial developmental stage (first and second order units), irrespective of the competition status of the tree,
the branching direction of the first successive branching unit is positively correlated with the heading of the preceding unit,
the branching angle is affected by the branching order and relative location of the considered GUs on the preceding GU.
The general objective was to prepare a basis for the further development and refinement of the empirical growth simulator SIBYLA using the structural modelling approaches (Fabrika and Pretzsch 2013).
EXPERIMENTAL
Study Area and Sampling Design
The experimental data were collected from the trees of a naturally regenerated forest stand located in the mountain region of central Slovakia. The region is characterized by relatively cold temperatures (an average temperature of -6 °C in January and 16 °C in July) and an average annual rainfall of 773 mm.
The selected forest stand has an altitude of approximately 700 m a.s.l. and the average slope is 45% with a southwest aspect. Norway spruce represents 80% of the standing volume. On average, the 10-year-old forest stand grows on a relatively uniform site, which enabled the analysis and comparison of the GUs of trees growing under similar site conditions. A sample transect was established, and three central trees at a distance of 50 m away were selected. Sample plots that were 2 m × 2 m were established around the central trees to measure the stand density through the tree number per hectare (Table 1). The trees that directly interfered with the branches of the central tree were identified to capture the effect of the mutual contact of branches on the structural development of trees. The north side was marked on each selected tree before felling to assess possible differences in the development of GUs because of differences in light intensities from different spatial directions and aspects. A total of 15 trees were felled for the structural measurements of the GUs – sample plot central tree and trees directly interfering the central tree.
Table 1. Basic Information about the Sample Plots

No. SP – sample plot number; N – number of living trees in the sampling plot; N/ha – number of trees per hectare; and N-SAT – number of trees from the plot structurally analyzed
Measured and Analyzed Data
The methodology for the crown architecture measurements was inspired by previous research (Hanan and Prusinkiewicz 2008; Krizek 2009). The following data and individual tree features were measured and analyzed: the height of the trees, diameter at a height of 3 cm, number of identifiable (pseudo-) whorls, and number of branches in the whorls.
Moreover, the GUs were identified as the basic structural components of the tree, which is the extension of growth that took place within one growth period. There was no evidence of any sylleptic branching or polycyclic growth in the sample trees; hence, all of the GUs were identical to the annual shoots in this study. To describe the topological adjacency between the GUs, kinship terminology was used, including mother, daughter, and sister GUs (Fig. 1). Growth units that have produced one to several daughter GUs were referred to as mother GUs and GUs stemming from the same mother GU were considered sister GUs Because of the young age of the studied trees, it was possible to distinguish GUs visually by identifying their basal scars. The life status (living or dead) of each GU was evaluated and the length of the GU was measured. The branching order of the GU was recorded following the notion of the Gravelius order (Gravelius 1914, Fig. 1 A-B). A GU growing directly from the tree trunk was classified as first order, a GU growing laterally from a first order GU was classified as second order, and so on. The data were classified into categories by the branching order (first to fifth order).
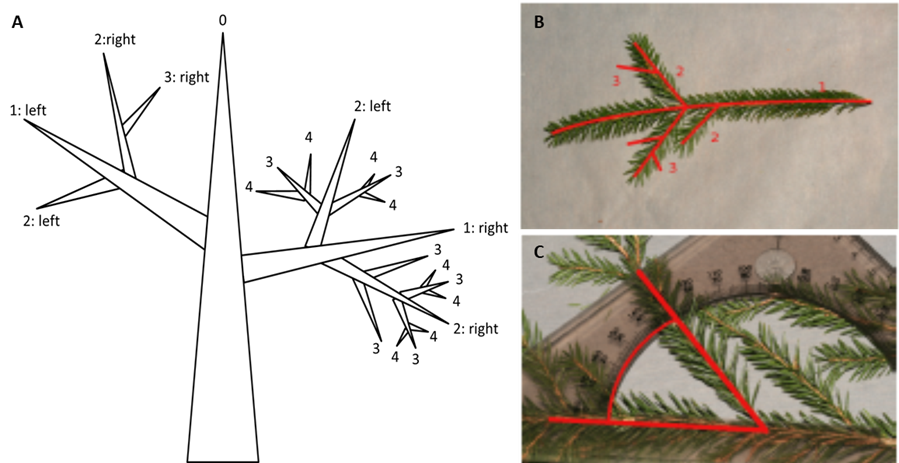
Fig. 1A-C. Order and direction of growth units according to the Gravelius ordering (A-B, example up to 4th order) and measurement of the branching angle (C). The growth units are defined as the segments of a branch/trunk that resulted from one uninterrupted season of primary growth, the mother units are the segments with lower order, the daughter units are units stemming from mother ones having the order incremented by 1 and sisters GU are units with the same order stemming from the same mother unit. Uppermost GU is the unit with highest order.
Within each category, four subcategories were created, called the length quarters (Q1 to Q4), which were based upon the relative position of the considered GU on the mother GU. The first, second, third, and fourth unit subcategories were 0 to 0.25, 0.25 to 0.5, 0.5 to 0.75, and 0.75 to 1 of the mother GU length, respectively, the original absolute length of which served as the basis for a unit length. The GUs prolonging their mother GU apically and thus having the same branching order were not included in the analysis of the relative positions.
The branching direction and angle to the mother unit (Fig. 1C) was measured, and a visual assessment of the physical damage of the GUs was recorded. The angle size was originally measured with a precision of 5° and the branching angles were sorted into 10° classes during data processing.
Data Analysis
Over 12000 GUs were measured and analysed. To describe the association between the mother and its first successing unit branching directions, the crosstab method and Fisher’s exact test were used to test the relationship between the variables for significance. A two-way factorial analysis of variance (ANOVA) was performed to analyse the variance in the frequencies (after the logit transformation) and branching angles of the GUs because of the life status, branching order, and relative position of the GU on its mother GU. The first order GUs were excluded from this analysis because the branching angles of these units on the main trunk were influenced by other processes than light availability, which regulated by overall stand density. The GUs that were apparently damaged were also excluded from the evaluation.
RESULTS AND DISCUSSION
Basic characteristics of the analysed trees are given in Table 2. This data should help to understand the possible differences in the finer structural development between the GUs in the case of some anomalies. The large difference between the highest and smallest tree (almost 450%) cannot be fully assigned to the different ages. For example, the difference in age between the tree numbers 14 and 15 (Table 2) was 8 years, but the height difference was small. It was likely that tree number 15 was growing under the shade of a mature stand for the first several years of its development. The analysis showed that the growth of tree 15 from a height of approximately 60 cm to 248 cm took 5 years. A similar development with accelerated growth was recognized for tree 14, but its suppression period was shorter compared with that of tree 15.
Table 2. Basic Characteristics of the Analysed Trees
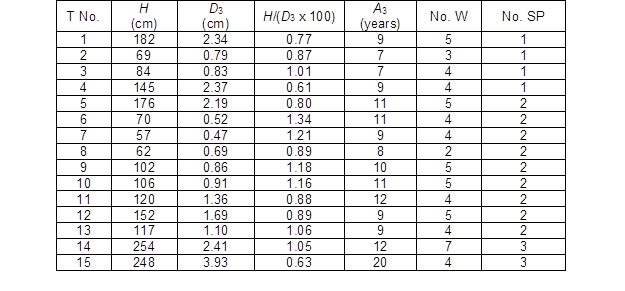
T No. – tree number; H – height; D3 – diameter at a height of 3 cm; H/(D3 x 100) – ratio between the height and diameter of 3 cm x 100; A3 – age at a height of 3 cm; No. W – number of easily identified whorls; and No. SP – sample plot number
The given examples clearly demonstrated the good ability of spruce to withstand shade at initial growth stages and showed the importance of appropriate light conditions for the structural development and growth of young spruce trees. The frequency of the measured GUs according to the analysed trees and the height development of the trees within the most recent four years before cutting are given in Table 3.
Table 3. Information about the GUs of the Analysed Trees and Height Growth within the Last Four Years
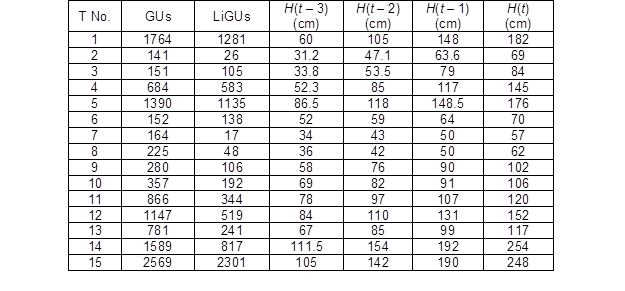
T No. – tree number; GUs – number of the measured GUs of the tree; LiGUs – number of the measured living GUs of the tree; H(t – 3) – height at the age of t – 3; H(t – 2) – height at the age of t – 2; H(t – 1) – height at the age of t – 1; H(t) – height at the age of t; t – current age (years)
Distribution of the Growth Units Among the Branching Orders
The majority of all analysed GUs were second order units, which represented 52.8% of all of the samples. The second largest group were first order units with a relative frequency of 26.7%. The third order GUs represented 16.59% of all of the measured units, and the relative frequency of the fourth order units was 3.98%. To complete the evaluation of the competition and structural development of the trees, it was necessary to distinguish the life status (alive/dead that already died out) of the GUs. This information was stored separately for each tree. From all measured GUs the living units were represented by 7853 samples (64.1%).
The results of the two-way factorial ANOVA of the logit-transformed relative frequencies of the GUs detected on each tree (i.e. sample size for ANOVA was n = 15) because of the life status and branching order are shown in Fig. 2 and Table 4. The following facts were apparent: (i) the highest GU frequencies are associated with lower GU orders (1st and 2nd, approaching 80% in total), then the higher-order frequencies (from 3rd to 5th, app. 20% together) of the GUs in both life statuses decreased with an increasing branching order; (ii) the variation in groups of both factors was almost the same and the 95% confidence limits had almost the same size; (iii) both factors were significant; however, the interaction of the factors was not significant; and (iv) a multiple mean comparison for both factors (Duncan’s tests) showed significant differences between all of the factor groups.
The distribution of GUs according to life status the GUs showed characteristic differences – the representation of higher order units at category of dead GU is larger in comparison to alive GU. That means, the mortality of GU occurs somewhat more frequently in higher GU.
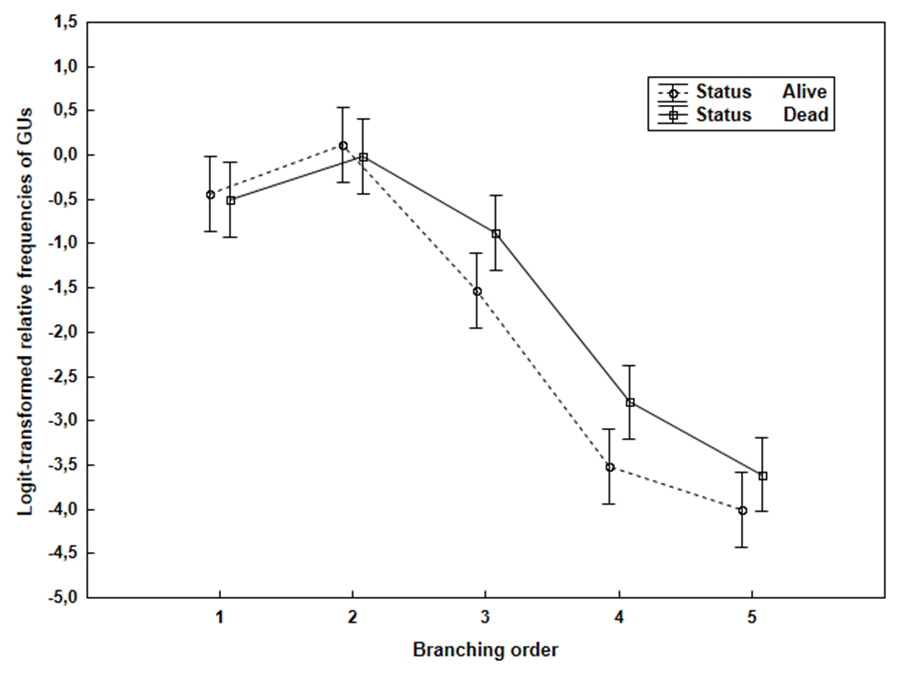
Fig. 2. Transformed relative frequencies of the GUs for the different branching orders (ranges are the 95% confidence intervals)
Table 4. Two-way ANOVA for the Relative Frequencies of the GUs in Response to the Life Status and Branching Order

This fact probably is closely related to the level of competition pressure influencing each tree. The more detailed analysis of individual trees revealed that less competitive trees (with smaller diameters and heights) had a smaller frequency of living GUs in the higher orders compared with the frequency of dead GUs in the same order. Furthermore, the trees growing under strong competition typically had a high frequency of first order GUs that was even higher than the frequency of second order units. Under such growth conditions, the flushing of buds and development of higher-order GUs were limited. In contrast, the dominating trees (with relatively larger heights a diameters) had a remarkably lower frequency of living first order GUs than trees strongly competing for light. This frequency was even lower than the fourth order frequency.
Thus, it can be assumed that the “mean tree” of Norway spruce from naturally regenerated forest stands at the initial developmental stage is characterized by GUs distributed within the first three branching orders. The occurrence of fourth order units can either indicate a dominant tree or that the competition on the site does not overwhelmingly restrict the structural development. In such circumstances it was observed the proportion of first order GUs increase more or less linearly with competition pressure, but the number and proportions of higher order GUs change even exponentially. The main reason probably is the first order GUs can have only one unit of first order as an offspring, but could possibly have several units of the next higher order.
Branching Direction and Angle
Norway spruce branches of the first and higher branching orders usually exhibit a more-or-less plagiotropic architecture, i.e., branching occurs approximately in a plane. The analyses of the GU branching directions showed that there was no significant difference between the left and right directions. The GUs were almost evenly distributed, as 33.8% of all of the measured GUs grew to the left, 34.3% grew to the right, and 31.9% grew upwards – topside direction. Some differences existed between individual trees. The trees with GUs prevailing in the upward direction were mostly trees under competition pressure. A prevailing number of GUs growing to the left or right direction over the number of that grew upwards indicated that the conditions allowed for better structural development of the tree. This type of structural development is typical for solitary trees, trees with minimal competition pressure, and dominant trees.
A hypothesis about the relationship between the branching direction of the mother unit and the direction of the next successive unit was also analysed. It was assumed that the successive unit would head in the same direction as its parent unit. For example, it was expected that the daughter unit originating from a mother unit that grew to the right would grow to the right as well. Table 5 shows the observed and expected frequencies for the branching direction of the successive units of higher order in relation to the direction of the mother units. The expected frequencies were computed using the assumption that there was no relationship.
Table 5. Observed and Expected Frequencies for the Mother and Topmost Descendant Unit Directions

Values in parentheses are the expected frequencies
At first sight, the table data does not indicate any strong relationship between the nominal variables. Fisher’s exact test was used to test the relationship between the variables for significance. The two-tailed p value was 0.0019; thus, the association between the branching direction of the mother and topmost descendant units was considered to be statistically significant.
Interesting findings were uncovered through the ANOVA of the GUs branching angles in response to the branching order and relative position of the GU on its mother GU (Fig. 3 and Table 6). The mean branching angles for all of the quarter groups had a tendency to decrease with an increasing branching order. In the first two branching order groups, the angles had a tendency to increase with an increasing quarter; however, in the fourth quarter, the mean angle was clearly smaller in all of the branching order groups. The 95% confidence limits were large in some quarter groups because of the larger sample variation (between 30% and 40%).
Both of the controlled variables (branching order and quarter) had a significant infuence on the branching angle variance; however, the influence was not unambiguous because only a few factor group differences were significant (Duncan’s tests), mostly between some quarters compared with the fourth quarter in the same branching order and between orders.
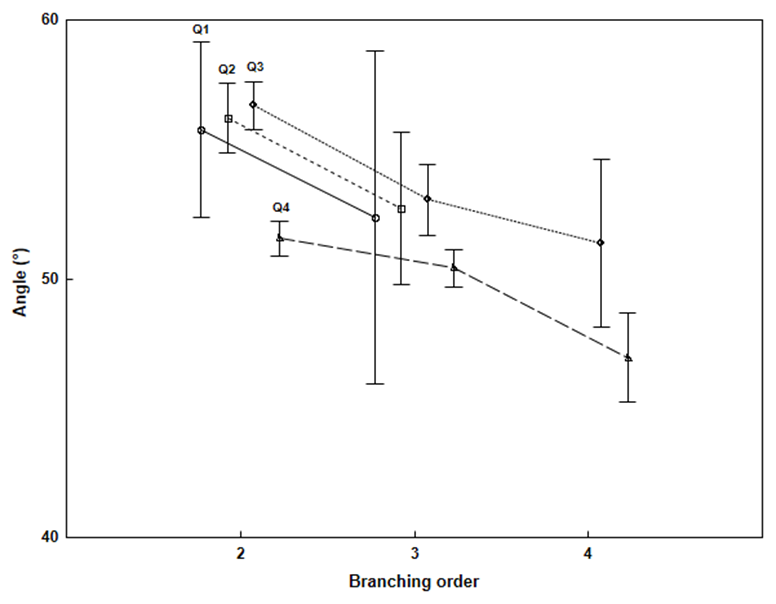
Fig. 3. Branching angles of the GUs depending on the branching order (ranges are the 95% confidence intervals)
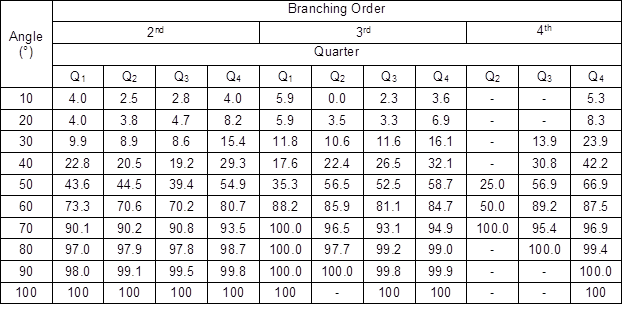
More interesting findings came from the analysis of the branching angle distributions (Table 7), which were left-skewed in all of the groups of the branching orders and quarters. Approximately 90% of the GUs had a branching angle lower than 70° and approximately 60% of the angles varied between 40° and 70°.
Table 6. Two-way ANOVA for the Branching Angle of the GUs in Response to the Branching Order and Quarter

Table 7. Cumulative Relative Frequencies of the Branching Angle (%)
Norway spruce has a typical monopodial branching pattern architecture, which implies that there is one main shoot with lateral branches emerging from it. The number of daughter segments and their lengths with respect to mother segments, as well as the branching angles between daughter segments and a mother segment, depend on numerous factors. The most important factors are the competition intensity and related light conditions. Light is the determining factor for the crown and shoot morphologies. The crown morphology of Norway spruce saplings and young trees varies from a conical form in open high-light sites to an “umbrella” form in the understory shade (Metslaid at al. 2007). Understory trees have more horizontal branch orientations; shoots are flatter than those developed in light (Grassi and Giannini 2005). These facts were also confirmed by the findings of this study; however, the crown shapes are more conical and branch angles are steeper because of high-light conditions at the sampling plots. Another reason was the lower degree of apical control and dominance of young understory Norway spruce trees. In high-light sites, trees produce shorter central branches (leaders) compared with lateral branches in the understory (Chen et al. 1996). The apical dominance was probably the main reason for the decrease in the mean branching angles in the last quarter of the sample GUs data.
In addition to the level of available light, the nutrition status of a tree and its exposure to toxic substrates such as sulfuric acid and ozone can also impact the crown development. Changes in the branching patterns can be used to classify the vigour of shoots and estimate the possible influence of damaging environmental factors (Roloff 1994). Because the nutrient status and exposure to toxic substrates were not measured in the sample plots, these factors could not be considered in this study.
However, the results obtained in this study can possibly be compared with some studies of branch architecture and orientation of rain forest trees because of the monopodial plagiotropic architectural characteristic of some of these species. Even under such conditions, monopodial plagiotropic species have more erect and three-dimensional branches in open environments than in the shade, thus exhibiting plasticity in response to lighting and showing that light exerts a strong influence on the branch orientation (King 1998). The height of saplings could be another factor that affects the branch angle variation. Branch angles are steeper in upper branches and are nearly horizontal in lower branches for saplings (Osada and Takeda 2003).
Variations in the crown architecture can be measured manually, but recently new approaches based on digitizing and scanning of tree crowns have also been applied. For example, Lintunen (2013) aimed to develop crown architecture models of some species from 3D digital crown architecture data. A new challenge for the tree crown shape and architecture reconstruction comes from laser scanner data utilization. Such approaches can also contribute to imaging for virtual reality (Zhu et al. 2008). Although much progress has been made in tree crown shape and structure data collection and modelling, reconstructions are still not satisfactory in terms of the crown architecture details. Improved structural models can also contribute to the development of functional-structural plant models for forest trees (Vos et al. 2010). These models represent the interactions between the physiological processes and architectural features of plants. They can be used for hypothesis testing for a deeper understanding of the significance of the tree structure for its functioning.
CONCLUSIONS
The analysis of the growth units (GUs) distribution among the branching orders indicated prevailing shares of first and second order GUs, which seemed to correspond to the expected structural development of Norway spruce crowns.
The competition status of the trees significantly changes the distribution of the branching orders. Trees under strong competition typically have a high ratio of low order GUs. Fourth and fifth GU orders were represented only marginally. Their occurrence was connected with the deformation of branches and can be considered to be rare under conditions of naturally regenerated even-aged forest stands of Norway spruce during the first decade of development in the phase of high competition of individuals (at extremely high population density).
The branching order and life status of the GUs were significant factors that influenced the variance in the GU frequencies. The left, right, and upward branching directions were almost evenly distributed. Furthermore, a significant association existed between the mother and successive daughter unit directions.
The mean branching angle decreased with an increasing branching order; moreover, the branching order and length quarter had significant influence on the variance in the branching angle. The branching angle distributions were left-skewed and the angles varied between 40° and 70°.
The results and knowledge gained from this study can be directly incorporated into the growth simulator SIBYLA (Fabrika and Pretzsch 2013) to refine the tree growth simulations, as well as to improve the tree visualization in the framework of virtual reality, which is part of the simulator. Some of this knowledge has already been used to improve tree visualization in the Computer Aided Virtual Environment (CAVE) system (see http://etools.tuzvo.sk/cave/index.html).
ACKNOWLEDGMENTS
The authors are grateful for the support of the Slovak Research and Development Agency (Grant No. APVV–0069–12 and No. APVV-0265-15) and Scientific Grant Agency of the Ministry of Education, Science, Research and Sport of the Slovak Republic (Grant Nos. 1/0618/12 and 1/0217/17). This study was also supported by the European Structural Fund (Grant No. ITMS 26220120006).
REFERENCES CITED
Beyer, R., Letort, V., and Cournède, P.-H. (2014). “Modeling tree crown dynamics with 3D partial differential equations,” Front. Plant Sci. 5, 329. DOI: 10.3389/fpls.2014.00329
Bošeľa, M., Sedmák, R., Sedmáková, D., Marušák, R., and Kulla, L. (2014). “Temporal shifts of climate–growth relationships of Norway spruce as an indicator of health decline in the Beskids, Slovakia,” Forest Ecol. Manag. 325, 108-117. DOI: 10.1016/j.foreco.2014.03.055
Bögre, L., Magyar, Z., and López-Juez, E. (2008). “New clues to organ size control in plants,” Genome Biol. 9(7), 226. DOI: 10.1186/gb-2008-9-7-226
Chen, H. Y. H., Klinka, K., and Kayahara, G. J. (1996). “Effects of light on growth, crown architecture, and specific leaf area for naturally established Pinus contorta var. latifolia and Pseudotsuga menziesii var. glauca saplings,” Can. J. Forest Res. 26(7), 1149–1157. DOI: 10.1139/x26-128
Cieslak, M., Seleznyova, A. N., Prusinkiewicz, P., and Hanan, J. (2011). “Towards aspect-oriented functional–structural plant modelling,” Ann. Bot.-London 108(6), 1025-1041. DOI: 10.1093/aob/mcr121
Fabrika, M., and Pretzsch, H. (2013). Forest Ecosystem Analysis and Modelling, Technical University in Zvolen, Zvolen, Slovakia.
Federl, P., and Prusinkiewicz, P. (1999). “Virtual laboratory: An interactive software environment for computer graphics,” in: Proceedings of Computer Graphics International, Canmore, Canada, pp. 93-100.
Grassi, G., and Giannini, R. (2005). “Influence of light and competition on crown and shoot morphological parameters of Norway spruce and silver fir saplings,” Ann. For. Sci. 62(3), 269-274. DOI: 10.1051/forest:2005019
Gravelius, H. (1914). “Potamology: Foundations of entire hydrology,” Göschen, Germany.
Hanan, J., and Prusinkiewicz, P. (2008). “Foreword: Studying plants with functional – structural models,” Funct. Plant Biol. 35(10), vi-viii. DOI: 10.1071/FPv35n10_FO
Honda, H. (1971). “Description of the form of trees by the parameters of the tree-like body: Effects of the branching angle and the branch length on the shape of the tree-like body,” J. Theor. Biol. 31(2), 331-338. DOI: 10.1016/0022-5193(71)90191-3
Kantola, A. (2008). The Structure of Norway Spruce (Picea abies [L.] Karst.) Stems in Relation to Wood Properties of Sawn Timber, Ph.D. Dissertation, University of Helsinki, Helsinki, Finland.
King, D. A. (1998). “Relationship between crown architecture and branch orientation in rain forest trees,” Ann. Bot.-London 82(1), 1-7. DOI: 10.1006/anbo.1998.0638
Krizek, B. A. (2009). “Making bigger plants: Key regulators of final organ size,” Curr. Opin. Plant Biol. 12(1), 17-22. DOI: 10.1016/j.pbi.2008.09.006
Kurth, W. (1994). “Morphological models of plant growths: Possibilities and ecological relevance,” Ecol. Model. 75–76, 299-308. DOI: 10.1016/0304-3800(94)90027-2
Kurth, W. (1999). “The simulation of tree architecture with growth grammars. Stochastic, sensitive L systems as formal basis for dynamic, morphological models of branching structure of woody plants,” Wissenschaftlicher Verlag Berlin, Berlin, Germany.
Kurth, W. (2007). “Specification of morphological models with L-systems and relational growth grammars,” J. Interdiscipl. Image Sci. 5, 1-25.
Lintunen, A., Sievänen, R., Kaitaniemi, P., and Perttunen, J. (2011). “Models of 3D crown structure for Scots pine (Pinus sylvestris) and silver birch (Betula pendula) grown in mixed forest,” Can. J. Forest Res. 41(9), 1779-1794. DOI: 10.1139/x11-092
Lintunen, A. (2013). Crown Architecture and Its Role in Species Interactions in Mixed Boreal Forests, Ph.D. Dissertation, University of Helsinki, Helsinki, Finland.
Metslaid, M., Jõgiste, K., Nikinmaa, E., Moser, W. K., and Porcar-Castell, A. (2007). “Tree variables related to growth response and acclimation of advanced regeneration of Norway spruce and other coniferous species after release,” Forest Ecol. Manag. 250(1-2), 56-63. DOI: 10.1016/j.foreco.2007.03.009
Müller, D., and Leyser, O. (2011). “Auxin, cytokinin and the control of shoot branching,” Ann. Bot. 107(7), 1203-1212. DOI: 10.1093/aob/mcr069
Osada, N., and Takeda, H. (2003). “Branch architecture, light interception and crown development in saplings of a plagiotropically branching tropical tree, Polyalthia jenkinsii (Annonceae),” Ann. Bot.-London 9(1), 55-63. DOI: 10.1093/aob/mcg008
Powell, A. E., and Lenhard, M. (2012). “Control of organ size in plants,” Curr. Biol. 22(9), 360-367. DOI: 10.1016/j.cub.2012.02.010
Pretzsch, H., Biber, P., Schütze, G., Uhl, E., and Rötzer, T. (2014). “Forest stand growth dynamics in Central Europe have accelerated since 1870,” Nat. Commun. 5. DOI: 10.1038/ncomms5967
Prusinkiewicz, P., and Lindenmayer, A. (1996). The Algorithmic Beauty of Plants, Springer-Verlag, New York, NY.
Roloff, A. (1994). “Effects of pollutants and environmental stress on the morphology of deciduous trees and on the ground vegetation,” in: Effects of Acid Rain on Forest Processes, D. L. Godbold and A. Hüttermann (eds.), Wiley-Liss, New York, NY, pp. 325-352.
Tjoelker, M., Boratyński, A., and Bugała, W. (2007). Biology and Ecology of Norway Spruce, Springer, Dordrecht, The Netherlands.
Vos, J., Evers, J. B., Buck-Sorlin, G. H., Andrieu, B., Chelle, M., and de Visser, P. H. B. (2010). “Functional-structural plant modelling: A new versatile tool in crop science,” J. Exp. Bot. 61(8), 2101-2115. DOI: 10.1093/jxb/erp345
Yan, H.-P., Kang, M. Z., de Reffye, P., and Dingkuhn, M. (2004). “A dynamic, architectural plant model simulating resource-dependent growth,” Ann. Bot.-London 93(5), 591-602. DOI: 10.1093/aob/mch078
Zhu, C., Zhang, X., Hu, B., and Jaeger, M. (2008). “Reconstruction of tree crown shape from scanned data,” in: Edutainment 2008: Third International Conference on Technologies for E-Learning and Digital Entertainment, Nanjing, China, pp. 745-756.
Article submitted: June 25, 2018; Peer review completed: August 18, 2018; Revised version received and accepted: November 30, 2018; Published: December 11, 2018.
DOI: 10.15376/biores.14.1.908-921