
Abstract
Characterization of the adhesive penetration behavior in wood is highly desired for optimizing the manufacturing processes and product properties. In this study, modified urea-formaldehyde (UF) adhesive was used to prepare glued laminated timber (Cryptomeria fortunei Hooibrenk). The depth of gross penetration was measured by fluorescence microscopy (FM), which showed the UF passed through 1.5 to 3.5 earlywood tracheids (with an average penetration depth of 88.95 ± 27.49 μm) or 0.5 to 4.0 latewood tracheids (with an average penetration depth of 36.39 ± 15.14 μm). In addition, the distribution of cell wall penetration was observed clearly by confocal laser scanning microscopy (CLSM). The adhesive was found to diffuse into the cell walls of surface tissues embedded in the UF. To verify the results from CLSM, the mechanical properties of cell walls with and without adhesive penetration were measured through nanoindentation (NI). The reduced elastic modulus of exposed cell walls (18.10 GPa) was roughly equal to that of fully filled cell walls (17.68 GPa) but significantly greater than that of reference ones (15.71 GPa). The hardness showed a similar variation trend for these three types of cell walls. Combining the three techniques, both the microstructure and micromechanics of the adhesive penetration behavior can be quantitatively identified in a complementary manner.
Download PDF
Full Article
Microstructural and Micromechanical Characterization of Modified Urea-Formaldehyde Resin Penetration into Wood
Lizhe Qin,a,b Lanying Lin,a,b,* and Feng Fu b
Characterization of the adhesive penetration behavior in wood is highly desired for optimizing the manufacturing processes and product properties. In this study, modified urea-formaldehyde (UF) adhesive was used to prepare glued laminated timber (Cryptomeria fortunei Hooibrenk). The depth of gross penetration was measured by fluorescence microscopy (FM), which showed the UF passed through 1.5 to 3.5 earlywood tracheids (with an average penetration depth of 88.95 ± 27.49 μm) or 0.5 to 4.0 latewood tracheids (with an average penetration depth of 36.39 ± 15.14 μm). In addition, the distribution of cell wall penetration was observed clearly by confocal laser scanning microscopy (CLSM). The adhesive was found to diffuse into the cell walls of surface tissues embedded in the UF. To verify the results from CLSM, the mechanical properties of cell walls with and without adhesive penetration were measured through nanoindentation (NI). The reduced elastic modulus of exposed cell walls (18.10 GPa) was roughly equal to that of fully filled cell walls (17.68 GPa) but significantly greater than that of reference ones (15.71 GPa). The hardness showed a similar variation trend for these three types of cell walls. Combining the three techniques, both the microstructure and micromechanics of the adhesive penetration behavior can be quantitatively identified in a complementary manner.
Keywords: Urea-formaldehyde; Adhesive penetration; Fluorescence microscopy; Nanoindentation; Confocal laser scanning microscopy
Contact information: a: Research Institute of Forestry New Technology, Chinese Academy of Forestry, Beijing, 100091, China; b: Research Institute of Wood Industry, Chinese Academy of Forestry, Beijing, 100091, China; *Corresponding author: linly@caf.ac.cn
INTRODUCTION
To meet the needs of the fast-growing forest products industry, adhesives are playing a more and more important role in the production of a range of high-value wood products, such as glued laminated timber, finger jointed timber, laminated veneer lumber, oriented strand board, and other engineered wood composites. During the manufacturing process, adhesive can certainly enter into the lumens and further into the cell walls through fluid movement (Marra 1992). Once the adhesive has cured, stress can transfer through the interphase region under load, which affects the bonding performance. The literature has demonstrated that optimum adhesive penetration would not only greatly benefit the mechanical performance of wood composites, but also be a more efficient use of the adhesive (White 1977; Gindl et al. 2005; Nuryawan et al. 2014).
The behavior of penetration can greatly determine the geometry of the interphase through several parameters related to wood, including resin, adhesive mix, and bonding process (Gavrilović-Grmuša et al. 2012b). Adhesive penetration of wood is usually classified on two scale levels: the micrometer level of penetration (gross penetration) and the nanometer level of penetration (cell wall penetration), which primarily depends on the properties of resin. Gross penetration results from the liquid resin flowing into the porous structure of wood, mostly filling the microscopic cell cavities, which could happen with most types of resin having low viscosity. However, cell wall penetration only occurs when a resin is composed of small-molecular weight components such that the resin can diffuse into the cell wall or micro fissures (Tarkow et al. 1966; Marcinko et al. 1998).
Urea-formaldehyde (UF) resin is the main adhesive system used in manufacturing wood products because of its good adhesive performance with competitive cost. Penetrability is an essential factor in evaluating the bonding performance of UF, as the excellent bonding performance of UF is tied to its good penetrability. The penetration of UF appears at both the micrometer level and the nanometer level; thus, high-precision quantitative evaluation has become especially important. The first technique used to investigate adhesive penetration in wood was light microscopy (LM) (Hancock and Northcott 1961); the gross penetration can be quantitatively measured by combining with digitizing image process and analysis technology. Fluorescence microscopy (FM), with high color contrast, has since then become a more practical method to analyze adhesive penetration (Johnson and Kamke 1992). However, with poor spatial resolution, both LM and FM cannot be utilized to accurately evaluate the cell wall penetration. Confocal laser scanning microscopy (CLSM), using a laser scanning device on the basis of FM, can improve the spatial imaging resolution significantly, and even the adhesive diffused in the cell walls can be detected (Gavrilović-Grmuša et al. 2012a,b). In addition to these optical microscopy techniques, electron microscopic methods such as X-ray photoelectron spectroscopy (XPS), scanning electron microscopy (SEM), or transmission electron microscopy (TEM) in combination with energy dispersive X-ray spectroscopy (EDX) have also been employed to determine the amount of UF in wood semi-quantitatively by detecting its chemical composition (Bolton et al. 1988; Pakdel et al. 2008; Singh et al. 2015).
Nanoindentation (NI), an important method for measuring the micromechanical properties of materials, has been used to determine the penetration behavior of adhesives indirectly by measuring the mechanical properties of cell walls in the interphase region (Liang et al. 2011; Zhang et al. 2015). Studies show that the penetration of UF into cell walls would considerably influence their mechanical properties (Stöckel et al. 2010, 2012). It is generally believed that cell walls with more UF will present higher elastic modulus and hardness. In other words, the variation of micromechanical properties of cell walls provides useful information for analyzing the penetration behavior of UF.
In this article, modified urea-formaldehyde (UF) adhesive was used to prepare glued laminated timber (Cryptomeria fortunei Hooibrenk). The penetration behavior of UF in wood substrates was systematically investigated using FM, CLSM, and NI. Fluorescence microscopy aimed to depict the microstructure of gross penetration, while CLSM focused on the cell wall penetration. More importantly, micromechanical properties obtained from NI were connected to CLSM results to evaluate the cell wall penetration. Overall, by combining the characterization of morphology and micro-mechanical property derived from these methods, both the gross penetration and cell wall penetration behaviors of UF were investigated quantitatively.
EXPERIMENTAL
Sample Preparation
The Cryptomeria fortunei Hooibrenk samples were collected from a stem at a height of 1.3 m to 3.3 m (from the ground), dried in a laboratory kiln drier, and conditioned at 20±1 °C under 65±5% relative humidity. By means of a pressure planing machine (Shoda Iron Works Co. Ltd., Japan), a smooth and fresh surface was planned along the tangential direction. Then, samples with even moisture content of 9.88% and density of 0.28 g/cm3 were bonded with melamine modified UF (Shanghai Shengda Flooring Co. Ltd., China) with solid content of 65%, viscosity of 2640 cP and pH of 8.5. After curing at 100 °C under a pressure of 0.7 MPa, specimens for tests were obtained from small pieces of wood containing bondline and maintained in a chamber (20±1 °C, 65±5% relative humidity) for 1 week until constant weight was attained. The conditioned specimens showed shear strength of 7.36 MPa, which met the requirement of Japanese agriculture standard for glued laminated timber (JAS SE-8) (≥5.40 MPa).
For FM and CLSM specimens, small blocks cut from the bonded samples with dimensions of 7 mm × 7 mm × 20 mm were infiltrated with water for 3 d and then soaked in a 1:1 glycerin-95% alcohol mixture for 2 d. Transverse sections of 25 μm thickness were cut from cross-sections of the small blocks using a sliding microtome. Each section was stained with 0.5% toluidine blue O solution to suppress the auto fluorescence of the wood and make the nonabsorbent adhesive fluoresce. After soaking for 12 h, the sections were rinsed twice with distilled water and then dehydrated by placing in an alcohol solution under progressively increasing concentrations (30%, 50%, and 70%) corresponding to various dehydrating times (30 min, 25 min, and 20 min). Finally, dehydrated sections including wood-adhesive interphase regions were fixed between a microscope slide and a cover glass using a drop of 1:1 glycerin-water mixture.
For the NI specimen, the sample preparation method was used in accordance with the method described by Jakes et al. (2008). Small blocks (7 mm × 7 mm × 20 mm) containing the bondline were prepared. A sloping apex of 45 degrees was created by using a sliding microtome and positioning in the latewood near the bondline. Then, the blocks were mounted onto an ultramicrotome (Leica EM UC7, Germany), cut cross-sectionally with a glass knife until the testing surface was flat enough, and finally cut by a diamond knife to make an ultra-smooth surface. Before testing by NI, the specimens was conditioned in an instrument test chamber for at least 24 h.
Fluorescence Microscopy and Image Analysis
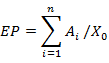
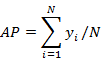
A Carl Zeiss Axioimager microscope (Germany), with a 100 W mercury burner, was used to investigate the gross penetration. Also, a green exciter-barrier filter set (excitation wavelength 480/40 nm, emission wavelength 510 nm) was chosen to observe the sections. Adhesive penetration in wood was examined quantitatively by measuring effective penetration depth (EP) and average penetration depth (AP) in a random area from a single bondline (Sernek et al. 1999; Guan et al. 2014). EP is the total area of adhesive detected in the interphase region divided by the width of the bondline, which can be calculated using Eq. 1. AP is the average depth of penetration for several column tissues within the total measurement length, which can be calculated using Eq. 2,
 (1)
(1)
 (2)
(2)
where EP is the effective penetration depth (μm), Ai is the area of adhesive object i (μm2), X0 is the length of the bondline in the measurement area (ten measurement areas for both earlywood and latewood; bondline length of each area was 500 μm in this article), AP is the average penetration depth (μm), yi is the penetration depth of one column tissue (μm), and N is the total column number of tissues in measurement length (μm).
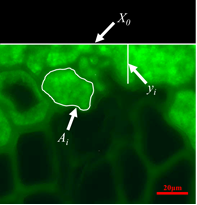
Fig. 1. Measurement parameters in experimental image
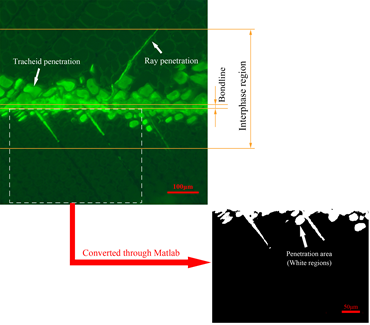
Fig. 2. Calculation of penetration areas (Ai) by Matlab software
Measurement parameters in Eqs. 1 and 2 are illustrated in Fig. 1. These three parameters are usually measured with image processing and analysis software (Johnson and Kamke 1992). The two parameters X0 and yi could be easily measured using Axiovision software. Ai was measured by circling the adhesive area with Matlab software, which provides a highly efficient and simple way to measure Ai.
First, the region of interest was chosen from the photomicrograph; then, fluorescence photomicrographs were converted to binary images using Matlab software. Then, fluorescent regions were converted to white areas and the remaining regions were converted to black areas automatically. After counting the pixel elements of white areas, Ai could be obtained by manual calculation.
Confocal Laser Scanning Microscopy
After viewing and photographing with FM, the same sections were imaged with a Carl Zeiss LSM 780 (Germany) inverted confocal microscope, under fluorescence mode at excitation wavelengths of 405 and 488 nm, and emission wavelengths of 401 to 485 nm and 493 to 598 nm. A Neofluar 10x/0.30 objective lens was used to obtain the complete morphology of wood-adhesive interphase, and then magnified the vision of the test region with an Apochromat 40x/1.20 lens. The CLSM images were collected from ten replicate specimen surfaces, and the image resolutions were 0.83 and 0.35 μm per pixel side length for magnifications of 10x and 40x, respectively.
Nanoindentation
Nanoindentation experiments were performed on a nanomechanical test instrument (Hysitron TI 950 TriboIndenter, USA) equipped with a three-sided pyramid diamond indenter tip (Berkovich type) with a radius of approximately 100 nm. Experiments were performed in load-controlled mode using a three-segment load ramp (loading with Pmax = 200 μN in 5 s, then holding for 2 s, and finally unloading in 5 s). A typical curve is shown in Fig. 3.
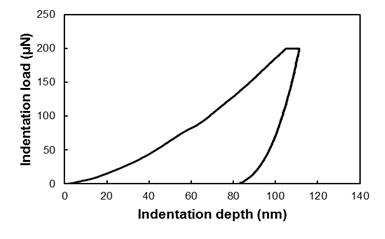
Fig. 3. Typical three-segment curve in load-controlled mode (loading/holding/unloading in 5/2/5 s, Pmax = 200 μN)
The indentation load-depth curves recorded during NI experiments were evaluated according to the Oliver and Pharr method (1992). Er was calculated according to Eq. 3,
![]() (3)
(3)
where S is the unloading stiffness and A is the projected contact area between the indenter and the sample at Pmax.
Er is called the reduced elastic modulus because it takes into account the compliance of the indenter tip, according to Eq. 4,
![]() (4)
(4)
where E and Ei are the elastic modulus of the sample and tip, respectively, and and are the Poisson’s ratio of the sample and tip, respectively.
The hardness (H) was obtained based on Eq. 5,
![]() (5)
(5)
where Pmax is the load measured at a maximum indentation depth in an indentation cycle.
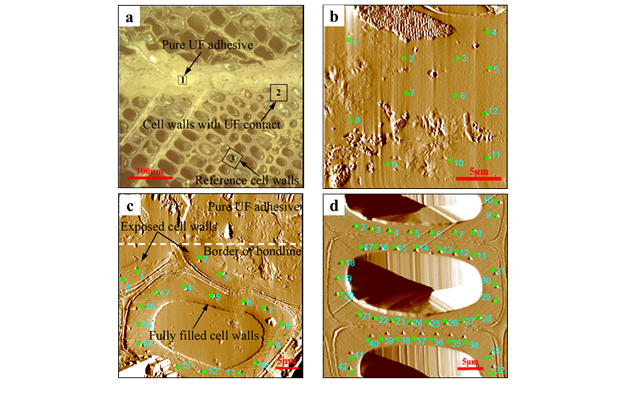
Fig. 4. Typical test regions of NI test. (a) Microscope image of NI sample; (b) SPM scan of pure UF adhesive (indicated in region 1 of Fig. 4a); (c) SPM scan of cell walls with UF contact (indicated in region 2 of Fig. 4a); (d) SPM scan of reference cell walls (indicated in region 3 of Fig. 4a)
The sample surface was first observed by an optical microscope (Fig. 4a). Then, high indentation positioning accuracy was achieved under the test mode of scanning probe microscope (SPM). Indentation was performed on cured UF in the bondline (Fig. 4b), on cell walls with UF contact (Fig. 4c), and on reference cell walls (Fig. 4d, at a distance of more than 150 μm from the bond line, where no influence from adhesive penetration was expected). Because of the variation of measurements within one cell wall, as described by Konnerth et al. (2009), at least four positions were chosen for each test region. In each test region, the space between each adjacent test point was at least 20 to 30 times that of the maximum depth of indentation. For reliable data analysis, results taken from outside of the S2 layer and cracks were eliminated, and the average value of all the validated results was used. Variance analysis for validated data was conducted by using a general linear-model procedure (GLM) of the SAS statistical software (SAS Institute Inc., USA). Statistically homogenous groups were identified by Tukey’s significance test with α=0.05.
RESULTS AND DISCUSSION
Fluorescence Microscopy – Microstructure of Gross Penetration
Typical micrographs of UF penetration of wood are illustrated in Fig. 2. Toluidine blue staining technique could suppress the autofluorescence of wood effectively and make UF fluoresce. The color of UF was bright green, but the wood was dark and almost invisible. UF was observed in lumens of ray tissues and lumens of tracheids for both earlywood and latewood.
Table 1. Gross Penetration Depth of UF Adhesive
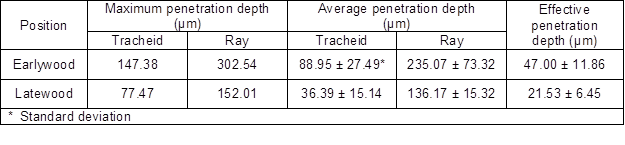
The penetration depth of UF is listed in Table 1. In earlywood, the maximum penetration depth of the interphase region was measured at rays (302.54 μm), approximately equal to nine times that of earlywood lumen’s diameter. The maximum penetration depth of tracheids was 147.38 μm, which was approximately equal to three times that of earlywood lumen’s diameter. In latewood, the maximum penetration depth was also measured at rays with 152.01 μm, which was approximately equal to nine times that of latewood lumen’s diameter. Most penetration depth of latewood tracheids was not more than two times that of latewood lumen’s diameters. The maximum was 77.47 μm, approximately three times that of latewood lumen’s diameter.
Statistically, UF passed through 1.5 to 3.5 earlywood tracheids or 0.5 to 4.0 latewood tracheids. Table 1 shows that the average penetration depth for tracheids was 88.95 ± 27.49 μm in earlywood, and roughly one third of that for rays. In latewood, the average penetration depth for tracheids became 36.39 ± 15.14 μm, nearly one quarter of that for rays. The above results indicate that earlywood had a larger average penetration depth than latewood. After excluding the non-penetration areas of the bonding interphase region, the values of effective penetration depths were less than the average penetration depths. Similar to the results of average penetration depth, earlywood (47.00 ± 11.86 μm) had over two times the effective penetration depth of latewood (21.53 ± 6.45 μm). One explanation could be that the diameter of earlywood lumens close to the bonded surface was larger than that of latewood (White 1977; Brady and Kamke 1988).
Confocal Laser Scanning Microscopy – Microstructure of Cell Wall Penetration
The morphology of both adhesive and wood tissues is able to be observed very clearly using CLSM. Under suitable operating conditions, CLSM can sharply differentiate the UF from wood cell walls based on bright contrasting colors. In Fig. 5a, the adhesive showed a reddish color and wood cell walls showed a greenish color. Confocal laser scanning microscopy was more powerful for visualizing the adhesive distribution in wood tissues than FM.
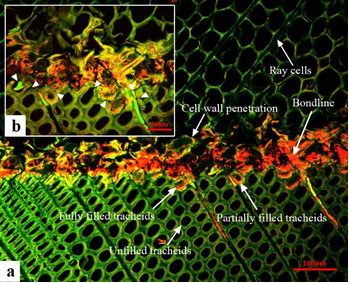
Fig. 5. (a) CLSM photographs of UF adhesive interphase; (b) magnified image of microcracks (indicated by arrowheads)
In Fig. 5a, tracheid walls at the outermost layer of bonding surface were fractured during planing and bond formation. The microscopic cracks, including the fissures in the cell wall, either between the adjacent tracheids or between the ray and the tracheid, were indicated by the arrowheads shown in Fig. 5b. This indicates that in the process of bonding, the adhesives moved primarily in the path of least resistance through an external compression force applied by the pressing machine. Therefore, UF penetrated into the axial tracheids and lumens of ray tissues, as well as into the microscopic cracks present at the exposed bonding surface.
UF was observed not only in lumens exposed to the bonded surface, but also in adjacent lumens. This indicates that UF could pass through the cell walls from exposed lumens to adjacent lumens by the pits. Kamke and Lee (2007) believed that the pit is the only entry pathway for adhesive flowing into the lumens. Horizontal flow might happen through the bordered pits, which are on the radial side of the tracheids. And vertical flow might occur from one tracheid to another one through the bordered pits on the endings of the tracheids or through the simple pits between ray cells and tracheids. Moreover, Gindl (2001) found that bordered pits on the cell walls could prevent the adhesive from flowing through the adjacent tracheids, but simple pits had little impediment effects on adhesive penetration. Here, we also believe that UF penetrated the lumens adjacent to the exposed lumens primarily by passing through the cross-field pits.
As shown in Fig. 5, the surface tissues embedded in the UF including exposed cell walls and fully filled cell walls presented light greenish to yellowish color, which was different from the color of UF and reference cell walls. This suggests that UF had penetrated into wood cell walls, which has been demonstrated in other studies (Stöckel et al. 2012). With increasing penetration depth, UF content in both lumens and walls declined. In addition to the depth, processing microcracks would also lead to higher contents of UF in exposed cell walls than in undamaged cell walls.
Nanoindentation – Micromechanical Properties of Cell Walls with and without Penetration
The results from NI measurements are displayed in Fig. 6. The mechanical properties of pure cured UF located in the bondline were quite different from that in wood cell walls. In agreement with earlier research (Stöckel et al. 2012), cured UF located in the adhesive bondline showed lower modulus (8.43 GPa) and higher hardness (0.63 GPa) compared with the wood cell wall, with a modulus of 15.71 GPa and hardness of 0.51 GPa, which justified the classification of UF as an adhesive with distinctly stiff and brittle characteristics.
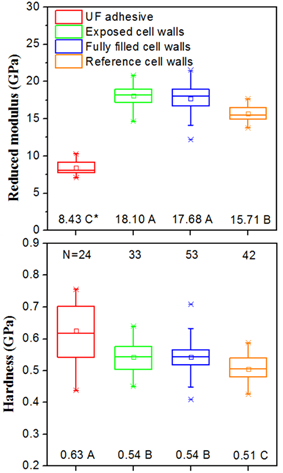
Fig. 6. Mechanical properties of UF, cell walls with and without UF
* Statistically homogenous groups determined using Tukey’s significance test
The results showed that the reduced elastic modulus and hardness of cell walls containing UF, including exposed cell walls (Er = 18.10 GPa, H = 0.54 GPa) and fully filled cell walls (Er = 17.68 GPa, H = 0.54 GPa), were significantly higher than those of reference cell walls situated far away from the bondline. This could be interpreted as embrittlement of the cell wall in the presence of UF, as shown in Fig. 5. And it could also be attributed to the higher density and compression ratio of cell walls near the bondline than that of the reference cell walls because of the hot pressing pressure. In Frihart’s (2005) opinion, if the adhesive penetrates the cell wall to form a bridge, the role of the primary and secondary chemical bonds at the adhesive-wood interphase might be less important. Furthermore, adhesive penetration of the cell wall can be of benefit because of its dimensional stability and also it can change the mechanical strength of materials. As shown in Fig. 6, the variation range for mechanical properties of exposed cell walls and fully filled cell walls was wider than that of reference cell walls, which indicated that the UF was distributed unevenly in the cell walls.
During planing and pressing, the cell structure was damaged by the deformation or fracture shown in Fig. 5b, and the mechanical properties of exposed cell walls should be significantly lower than that of the undamaged cell walls (Gindl et al. 2004). However, results showed that there was no significant difference between the exposed cell walls and the fully filled cell walls for both reduced elastic modulus and hardness (Fig. 6). This may be related to the much higher adhesive penetration amount of exposed cell walls than that of fully filled cell wall (Johnson and Kamke 1992), as shown in the above CLSM observation. It can be concluded that UF penetration could “repair” the cell walls that were mechanically damaged by wood surface treatment and further improve their mechanical properties.
Above all, FM could acquire fluorescence images of bonding interphase with strong contrast between UF and wood cell walls, by using a suitable dye, exposure time and exposure intensity. In combination with image analysis software, FM could be a suitable tool to investigate gross penetration quantitatively. However, FM could not be used to observe microstructures of wood tissues such as cracks in cell walls, due to its lower image resolution. Furthermore, FM only focuses on one plane, and thus the observing results are not good enough for some slices out of flatness, especially under higher magnification.
With CLSM it was possible to visualize not only the microstructures of wood tissues but also adhesive penetration of the wood tissue more clearly than with FM, as CLSM could obtain a composite image of sequential sections through a considerable depth. The obtained images enabled large tissue area to be brought in the same focal plane as the bondline. Thus the content of adhesive in cell walls could be qualitatively studied with CLSM through identifying the fluorescent intensity of cell walls in bonding interphase. On the basis of CLSM observation, the testing areas of NI experiments could be chosen according to the specific requirement. By obtaining micromechanical properties of cell walls with different resin penetration extent from NI in-situ tests, the content of adhesive in cell walls of bonding interphase could be analyzed semi-quantitatively.
Overall, the combination of multiple techniques could be very useful for quantifying the flowing behavior of adhesives in wood tissues and help to interpret the bonding mechanism of adhesives.
CONCLUSIONS
- Using FM and CLSM, sharp contrasts between adhesive and wood were observed. The results showed that UF passed through 1.5 to 3.5 earlywood tracheids (with an average penetration depth of 88.95 ± 27.49 μm) or 0.5 to 4.0 latewood tracheids (with an average penetration depth of 36.39 ± 15.14 μm). Furthermore, the distribution of adhesive penetration of wood tissues could be observed very clearly by CLSM because of its high spatial resolution. Adhesive was found to be diffused into the cell walls of surface tissues embedded in the UF.
- Using NI, UF penetration of cell walls was further verified. The reduced elastic modulus of exposed cell walls (18.10 GPa) was roughly equal to that of fully filled cell walls (17.68 GPa), but significantly greater than that of the reference ones (15.71 GPa). Also, the hardness showed a similar trend in these three types of cell walls. These results suggest that UF, with stiff and brittle characteristics, could certainly reinforce cell walls that were mechanically damaged.
- The combination of FM, CLSM, and NI could not only visually quantify the microstructure of gross penetration of wood, e., maximum, average, and effective penetration depth, but also could measure the cell wall penetration quantitatively through microscopic observation and micromechanical testing. Furthermore, the combined application of these methods could be further used to investigate the relationship between variation of mechanical properties and content of adhesive for cell walls at the bonding interphase.
ACKNOWLEDGMENTS
The authors would like to thank the Chinese Academy of Forestry Foundation (CAFINT2013C07) and the National Natural and Science Foundation of China (31370012) for financial support.
REFERENCES CITED
Bolton, A. J., Dinwoodie, J. M., and Davies, D. A. (1988). “The validity of the use of SEM/EDAX as a tool for the detection of UF resin penetration into wood cell walls in particleboards,” Wood Science and Technology 22(4), 345-356. DOI: 10.1007/BF00353324
Brady, D. E., and Kamke, F. A. (1988). “Effect of hot-pressing parameters on resin penetration,” Forest Products Journal 38(11), 63-68.
Frihart, C. R. (2005). “Adhesive bonding and performance testing of bonded wood products,” Journal of ASTM International 2(7), 1-12. DOI: 10.1520/JAI12952
Gavrilović-Grmuša, I., Dunky, M., Miljković, J., and Djiporović-Momčilović, M. (2012a). “Influence of the viscosity of UF resins on the radial and tangential penetration into poplar wood and on the shear strength of adhesive joints,” Holzforschung 66(7), 849-856. DOI: 10.1515/hf-2011-0177
Gavrilović-Grmuša, I., Dunky, M., Miljković, J., and Djiporović-Momčilović, M. (2012b). “Influence of the degree of condensation of urea-formaldehyde adhesives on the tangential penetration into beech and fir and on the shear strength of the adhesive joints,” European Journal of Wood and Wood Products 70(5), 655-665. DOI: 10.1007/s00107-012-0599-6
Gindl, W. (2001). “SEM and UV-microscopic investigation of glue lines in Parallam® PSL,” European Journal of Wood and Wood Products 59(3), 211-214. DOI: 10.1007/s001070100194
Gindl, W., Schöberl, T., and Jeronimidis, G. (2004). “The interphase in phenol–formaldehyde and polymeric methylene di-phenyl-di-isocyanate glue lines in wood,” International Journal of Adhesion and Adhesives 24(4), 279-286. DOI: 10.1016/j.ijadhadh.2003.10.002
Gindl, W., Sretenovic, A., Vincenti, A., and Muller, U. (2005). “Direct measurement of strain distribution along a wood bond line. Part 2: Effects of adhesive penetration on strain distribution,” Holzforschung 59(3), 307-310. DOI: 10.1515/HF.2005.051
Guan, M., Yong, C., and Wang, L. (2014). “Microscopic characterization of modified phenol-formaldehyde resin penetration of bamboo surfaces and its effect on some properties of two-ply bamboo bonding interface,” BioResources 9(2), 1953-1963.
Hancock, W. V., and Northcott, P. L. (1961). “Microscopic identification of undercured glue bonds in plywood,” Forest Products Journal 11(7), 316-319.
Jakes, J. E., Frihart, C. R., Beecher, J. F., Moon, R. J., and Stone, D. S. (2008). “Experimental method to account for structural compliance in nanoindentation measurements,” Journal of Materials Research 23(4), 1113-1127. DOI: 10.1557/JMR.2008.0131
Johnson, S. E., and Kamke, F. A. (1992). “Quantitative analysis of gross adhesive penetration in wood using fluorescence microscopy,” Journal of Adhesion 40(1), 47-61. DOI: 10.1080/00218469208030470
Kamke, F. A., and Lee, J. N. (2007). “Adhesive penetration in wood – A review,” Wood and Fiber Science 39(2), 205-220.
Konnerth, J., Gierlinger, N., Keckes, J., and Gindl, W. (2009). “Actual versus apparent within cell wall variability of nanoindentation results from wood cell walls related to cellulose microfibril angle,” Journal of Materials Science 44(16), 4399-4406. DOI: 10.1007/s10853-009-3665-7
Liang, K., Du, G. B., Hosseinaei, O., Wang, S. Q., and Wang, H. (2011). “Mechanical properties of secondary wall and compound corner middle lamella near the phenol-formaldehyde (PF) adhesive bond line measured by nanoindentation,” Advanced Materials Research 236-238, 1746-1751. DOI: 10.4028/www.scientific.net/AMR.236-238.1746
Marcinko, J. J., Devathala, S., Rinaldi, P. L., and Shanci, B. (1998). “Investigating the molecular and bulk dynamics of PMDI/wood and UF/wood composites,” Forest Products Journal 48(6), 81-84.
Marra, A. A. (1992). Technology of Wood Bonding: Principles in Practice, Van Nostrand Reinhold, New York.
Nuryawan, A., Park, B. D., and Singh, A. P. (2014). “Penetration of urea–formaldehyde resins with different formaldehyde/urea mole ratios into softwood tissues,” Wood Science and Technology 48(5), 889-902. DOI: 10.1007/s00226-014-0649-9
Oliver, W. C., and Pharr, G. M. (1992). “An improved technique for determining hardness and elastic modulus using load and displacement sensing indentation experiments,” Journal of Materials Research 7(6), 1564-1583. DOI: 10.1557/JMR.1992.1564
Pakdel, H., Cyr, P. L., Riedl, B., and Deng, J. (2008). “Quantification of urea formaldehyde resin in wood fibers using X-ray photoelectron spectroscopy and confocal laser scanning microscopy,” Wood Science and Technology 42(2), 133-148. DOI: 10.1007/s00226-007-0155-4
Sernek, M., Resnik, J., and Kamke, F. A. (1999). “Penetration of liquid urea-formaldehyde adhesive into beech wood,” Wood and Fiber Science 31(1), 41-48.
Singh, A. P., Nuryawan, A., Park, B. D., and Lee, K. H. (2015). “Urea-formaldehyde resin penetration into Pinus radiata tracheid walls assessed by TEM-EDXS,” Holzforschung 69(3), 303-306. DOI: 10.1515/hf-2014-0103
Stöckel, F., Konnerth, J., Kantner, W., Moser, J., and Gindl, W. (2010). “Tensile shear strength of UF- and MUF-bonded veneer related to data of adhesives and cell walls measured by nanoindentation,” Holzforschung 64(3), 337-342. DOI: 10.1515/hf.2010.046
Stöckel, F., Konnerth, J., Moser, J., Kantner, W., and Gindl-Altmutter, W. (2012). “Micromechanical properties of the interphase in pMDI and UF bond lines,” Wood Science and Technology 46(4), 611-620. DOI: 10.1007/s00226-011-0432-0
Tarkow, H., Feist, W. C., and Southerland, C. F. (1966). “Interaction of wood with polymeric materials. Penetration versus molecular size,” Forest Products Journal 16(10), 61-65.
White, M. S. (1977). “Influence of resin penetration on the fracture toughness of wood adhesive bonds,” Wood Science 10(1), 6-14.
Zhang, Y., Liu, C., Wang, S., Wu, Y., Meng, Y., Cui, J., Zhou, Z., and Ma, L. (2015). “The influence of nanocellulose and silicon dioxide on the mechanical properties of the cell wall with relation to the bond interface between wood and urea-formaldehyde resin,” Wood and Fiber Science 47(3), 1-9.
Article submitted: July 17, 2015; Peer review completed: September 6, 2015; Revised version received: October 14, 2015; Accepted; October 17, 2015; Published: November 10, 2015.
DOI: 10.15376/biores.11.1.182-194