
Abstract
Physical properties are one of the drawbacks of oil palm wood (OPW) and they need to be improved via an appropriate method. The response surface methodology (RSM) based on central composite design (CCD) was used to evaluate and optimize the parameters of a hydrothermal treatment and to create an empirical model of the mass loss (ML, %), equilibrium moisture content (EMC, %), and anti-swelling efficiency (ASE24h, %) responses. This study focused on the effect of hydrothermal treatment (HTT) in buffer solutions to control the destructive effects of released acids caused by the degradation of hemicellulose acetyl groups. A CCD, as the most common RSM design, was applied with three treatment factors including the buffer solutions (acidic, neutral, and alkaline with pH of 5 to 8), temperature (80 to 140 °С), time (40 to 120 min), and a total of 20 experiments. The results showed that the effect of the treatment temperature was more notable than time. The medium acidity (pH) variations in HTT can lead to the removal of extractives and starch, hemicelluloses hydrolysis, the destruction of the parenchymal cells wall, and weight loss. Based on the variance analysis, the quadratic and linear models proved to be highly significant with minimal probability values (< 0.0001). The optimum conditions predicted for the HTT were a pH of 7.3, a temperature of 112.7 °С, and a time of 109.6 min.
Download PDF
Full Article
Optimization and Empirical Modelling of Physical Properties of Hydrothermally Treated Oil Palm Wood in Different Buffered Media Using Response Surface Methodology
Seyed Eshagh Ebadi,a,* Zaidon Ashaari,b and Mohammad Jawaid c
Physical properties are one of the drawbacks of oil palm wood (OPW) and they need to be improved via an appropriate method. The response surface methodology (RSM) based on central composite design (CCD) was used to evaluate and optimize the parameters of a hydrothermal treatment and to create an empirical model of the mass loss (ML, %), equilibrium moisture content (EMC, %), and anti-swelling efficiency (ASE24h, %) responses. This study focused on the effect of hydrothermal treatment (HTT) in buffer solutions to control the destructive effects of released acids caused by the degradation of hemicellulose acetyl groups. A CCD, as the most common RSM design, was applied with three treatment factors including the buffer solutions (acidic, neutral, and alkaline with pH of 5 to 8), temperature (80 to 140 °С), time (40 to 120 min), and a total of 20 experiments. The results showed that the effect of the treatment temperature was more notable than time. The medium acidity (pH) variations in HTT can lead to the removal of extractives and starch, hemicelluloses hydrolysis, the destruction of the parenchymal cells wall, and weight loss. Based on the variance analysis, the quadratic and linear models proved to be highly significant with minimal probability values (< 0.0001). The optimum conditions predicted for the HTT were a pH of 7.3, a temperature of 112.7 °С, and a time of 109.6 min.
Keywords: Oil palm wood; RSM; Central composite design; Hydrothermal treatment; Buffered media; Physical properties
Contact information: a: Department of Wood & Paper Science and Technology, Chalous Branch, Islamic Azad University, Chalous, 669-61367 Iran; b: Department of Forest Production, Faculty of Forestry, Universiti Putra Malaysia (UPM), 43400 Serdang, Selangor, Malaysia; c: Department of Biocomposite Technology, Institute of Tropical Forestry and Forest Products (INTROP), Universiti Putra Malaysia, 43400 Serdang, Selangor, Malaysia; jawaid@upm.edu.my
* Corresponding author: eshaghebadi@gmail.com; ebadi_es@iauc.ac.ir
INTRODUCTION
Oil palm (Elaeis guineensis Jacq.) is a monocotyledonous plant and a perennial crop generally grown in the humid tropics. Malaysia is well known for its potential in renewable resources of lignocellulosic materials. Therefore, the replanting of the oil palm tree (OPT) is normally accompanied by large volumes of logs at any economic life span (25 to 30 years) (Hartley 1977; Kilmann and Lim 1985; Bakar et al. 2008). Additionally, the main problems of OPT are the low density, poor strength, and difficulties in avoiding significant defects during drying (Bakar et al. 2008, 2012). Many studies have been conducted to enhance this material (Wang and Cooper 2005; Bezerra et al. 2008; Erwinsyah 2008; Amarullah et al. 2010; Abdullah et al. 2012; Widiarti et al. 2015; Zaidon et al. 2015; Endo et al. 2016).
Hydrothermal treatment (HTT) is a novel non-chemical, eco-friendly, and efficient method that can be used to improve wood properties (Boonstra et al. 1998; Tjeerdsma and Militz 2005; Sundqvist et al. 2006; Sandberg and Navi 2007; Talaei 2010; Loh et al. 2011; Talaei et al. 2013). The physical properties, such as mass loss (ML), equilibrium moisture content (EMC), and anti-swelling efficiency (ASE), that are important in wood applications can be improved by the treatment (Shams and Yano 2004; Poncsak et al. 2006; Talaei and Karimi 2012b). The treatment can remove extractives, hydrolyse hemicellulose, and alter the lignin and cellulose of lignocellulosic materials (Garrote et al. 1999; Gündüz et al. 2009; David and Madison 2010). However, the formation of acetic acid caused by acetyl functional groups of the hemicellulose in the hydrothermal process will increase the treatment medium acidity (pH) (Tjeerdsma and Militz 2005; Talaei et al. 2014; Talaei and Karimi 2015; Saliman et al. 2017). In order to improve this technique, a buffer solution is used as treatment medium (Talaei 2010; Talaei et al. 2013). The buffer solution can control and neutralize the medium’s acidity (pH) in a specified pH level (Talaei 2010; Talaei and Karimi 2012c; Talaei et al. 2014; Ebadi et al. 2019).
There has been very limited research on the hydrothermal treatment of oil palm wood (OPW) in buffered media. Ebadi et al. (2016), reported that HTT using buffered solutions at 140 °C for 120 min significantly decreased some properties of the treated OPW due to the high degradation of hemicelluloses. However, the dimensional stability of the OPW was improved. Treatment temperature appears to be the important factor in enhancing the dimensional stability of the hydrothermal-treated wood (Talaei 2010; Saliman et al. 2017). Therefore, the initial treatment terms were determined based on some of the researchers’ results such as Talaei (2010) and also a pilot-study by the article’s author in similar and real circumstances (buffer solution with various pHs, temperature, and time) on the oil palm wood.
Response surface methodology (RSM) is an appropriate method for designing experiments that helps researchers to build models, evaluate the effects of several factors, and achieve the optimum conditions for desirable responses in addition to reducing the number of experiments (Khuri and Comell 1996; Wu et al. 2009; Khuri and Mukhopadhyay 2010). Central composite design (CCD) is considered as an identification method to predict the more accurate value of the actual response (Myers and Montgomery 2002; Bezerra et al. 2008). The ranges of optimization are the buffer solutions with a pH of 5 to 8, the temperature of 80 to 140 °С, and time of 40 to 120 min as well. Hence, this study aims to evaluate and to optimize the effect of hydrothermal treatment variables (buffer solutions, temperature, and time) on the quality improvement of OPW. CCD and RSM were respectively used to design the experiments and to develop models to optimize treatment variables to achieve optimum improvement of OPW properties.
EXPERIMENTAL
Sample Preparation
Three mature oil palm trees (30 years old) were randomly harvested at the Agricultural Park, Universiti Putra Malaysia (UPM), Serdang-Selangor, Malaysia. Samples were prepared from the outer section of the oil palm trunk (OPT) to minimise variation due to the heterogeneity of the cross-section of the OPT. The trunks were converted by head band-saw and flat sawn into dimensions of 600 mm × 50 mm × 50 mm. To prevent fungal attack and moisture loss, all samples were immediately kept in a cold-room (≈ 4 °C). Buffer solutions (pH 5 to 8) were prepared from di-sodium hydrogen phosphate dehydrate (Na2HPO4.2H2O) and citric acid-monohydrate (C6H8O7.H2O) with different concentrations.
Hydrothermal treatment (HTT)
The HTT was conducted by heating and impregnating the samples in various buffered media with different pHs (5 to 8) under atmospheric pressure in a laboratory digester. Meanwhile, in this study, the pressure was not varied. The pressure was changed by changing the temperature and time as the main variables. So the pressure was not monitored during the treatment. To measure and evaluate each physical property in each treatment combination, 8 to 10 green samples with the moisture content of approximately 114% were placed into the digester and then treated using the buffered solutions in suggested temperature and time by CCD. After HTT, the treated samples were discharged from the digester and thus kept in a conditioning room (20 ± 2 °C and 65 ± 3 %) to reach a moisture content of approximately 12 ± 2%.
Experimental design and data analysis
The Design Expert Software (Design Expert, version 8.04, State-Ease Inc., Minneapolis, MN, USA) was used for the statistical design of experiments and data analysis. Response surface methodology (RSM) is used to elect the best experimental conditions that require a minimum number of experiments to achieve the proper results. CCD is one of the most common items that often works well to optimize the process (Box and Draper 1987; Brown and Melamed 1990). Hence, RSM and CCD were applied to optimize and model the treatment variables as effective experimental (actual) variables and the most important physical properties.
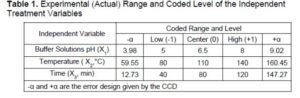
Experiments were started as a preliminary study to achieve a range of treatment conditions for the design of experimental runs. Accordingly, HTT was tested in buffer solutions with different pHs as well as in the temperature and time range, and then continued until the observation of appreciable results in the responses. The range and levels of independent treatment variables are shown in Table 1. In the table, each treatment variable was coded and investigated at five different levels of −α, −1, 0, +1, and +α (Montgomery 2001). Furthermore, the coded levels include the low (5) and high (8) range of pH variables, as well as -α and +α as the minimum and maximum of the CCD levels determined by design expert software, which are lower and higher than the low (5) and high (8) values of pH variables.
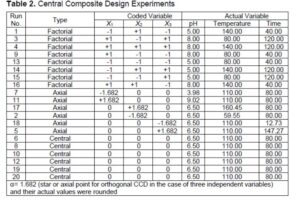
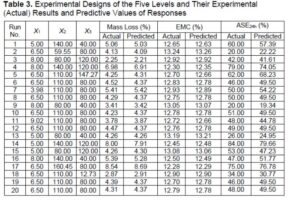
A total of 20 runs were designed to compute the coefficients of the second-order polynomial regression model for three treatment variables (Table 2). This table shows the CCD in the form of a 32 full factorial design with five additional empirical experiments (8, 10, 12, 19, and 20) as repetitions of the central point and obtained empirical results at each taste. In this table, the experimental (actual) values and the predicted values are displayed for the dependent variables (responses). Furthermore, the design variables were the buffer solutions (X1, pH), temperature (X2, °C), and time (X3, min), while response variables were the physical properties.
In order to achieve the optimum treatment conditions, three dependent variables including ML, EMC, and ASE were analyzed as responses. The quadratic equation model for predicting the optimal conditions can be expressed according to Eq. 1,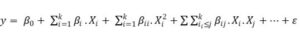
where i is the linear coefficient, j is the quadratic coefficient, β are regression coefficients (β0, βi, βii, and βij are regression coefficients of intercept, linear, quadratic, and interaction coefficients, respectively), k is the number of factors studied and optimized in the experiment, Xi and Xj are the coded independent variables, and ε is the random error. In addition, the behavior of the responses is explained by the following experimental second order polynomial Eq. 2:
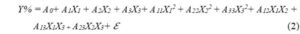
Here Y% is each of the dependent variables, A0 is the interception coefficient, A11, A22, and A33 are the quadratic terms, A12, A13, and A23 are the interaction coefficients, and X1, X2, and X3 are the independent treatment variables studied (buffer solutions, temperature, and time, respectively). The optimal values of the operation factors were estimated by the analysis of three-dimensional response surface of the independent treatment variables (X1, X2, and X3) and the dependent variable (Y%).
Optimization
The optimization by Design-Expert proposes a mixture of factor levels that simultaneously change the considered necessities for each of the factors and responses (optimization criteria). The optimization of each variables can be carried out graphically or numerically. In graphical optimization, the validated model equation can be presented by the response surface plot. The response surface results are presented as the plots of three-dimensional graphics that illustrate the relation between the treatment variables and can determine the level of optimal conditions. Numerical optimization can optimize any combination of the favorite aim for each response and factor. The probable targets are to control the treatment variables (medium acidity (pH), minimize or maximize the temperature, and time) for each of the responses. To determine the best combination, the goals are optimized into a total desirability function (D). For optimization the equation is,
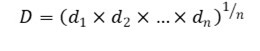
where di represents the desirability of each (i) response, which ranges from 0 to 1 (least to most desirable, respectively), and n is the number of responses being optimized. The numerical optimization finds a point that maximizes the desirability function.
The experimental conditions of the coded and actual values developed by the CCD are shown in Table 2. All the points in the design region are at identical distance from center. The results in distribution of errors between all points are in an equal manner.
Evaluation of Physical Properties
The test of physical properties such as ML (%), EMC (%), and ASE24h (%) were performed using the specified procedure of the standard test methods for the samples of small clear wood according to British-adopted European standard BS EN 373 (1957), and also measured by the oven-dry technique (103 ± 2 °C) using a digital balance (Sartorius Scale GE1302, ± 0.01; Thermo Fisher Scientific, Dreieich, Germany) and a Vernier caliper (Mitutoyo 500-196-30 Digital Caliper, Japan Mitutoyo Company).
Statistical Analysis
The statistical software was Design-Expert (version 8.04, State-Ease Inc., Minneapolis, MN, USA). In addition, the relationship between the treatment variables and the physical properties (responses) were analyzed using RSM. Data were analyzed using ANOVA testing and evaluated with different descriptive statistics including the p-value, F-value, and the degree of freedom (df); the determination coefficient (R2) of each coefficient was determined by Fisher’s F-test and probability values > F. The goodness-of-fit for the models were evaluated by the correlation coefficient R2 (determination coefficients) and adjusted-R2. The lack of fit (LOF) F-test describes the data variation around the fitted model. A high R2 coefficient (close to 1) ensures a satisfactory adjustment of the quadratic model to the empirical data. The model terms were evaluated by the P-value (probability) with 95% confidence level. Furthermore, the variance coefficient (CV) as the ratio of the estimated standard error to the mean value of the observed response determines the efficiency of the model. A model can normally be reproducible if its CV is not greater than 10% (CV ˃ 10).
RESULTS AND DISCUSSION
Analysis of Experimental Data and Prediction of Performance
In this study, the effect of three treatment variables as independent variables were selected in CCD. The physical properties (responses) as dependent variables were empirically measured with CCD as well. Three different tests as sequential F-test (or sequential model sum of squares, SMSS), lack-of-fit, and model summary statistics were employed to decide the adequacy of various models. A total of 20 experiments were employed to model the response surface (Table 3). The experiments were randomly run to avoid suspicious variability that affects the outcome of responses based on unnecessary factors. The observed (actual) and predicted results for the responses of the treated OPW in different buffered media are represented in Table 3.
RSM Model Development
In the present research, second-order RSM based on mathematical models of ML, EMC, and ASE24h were developed in terms of three process parameters, namely, buffer solutions (X1), temperature (X2), and time (X3). Additionally, the model suitability was tested using the ANOVA test. The linear and quadratic polynomial equations of response surface of ML, EMC, and ASE24h% are given by Eqs. 4 through 6,
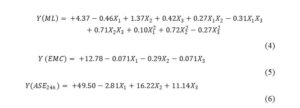
where X1 is the buffer solution with different pHs, X2 is the temperature (°С), and X3 is the time (min).
Regression and adequacy of the model
Table 4 shows regression coefficients to optimize the process conditions. The ANOVA results are summarized for testing the accuracy and correctness of the model in this Table. This table also shows the reduced quadratic models in terms of coded factors and other statistical parameters. Moreover, the adequacy of the model was evaluated to ensure the fitted model was presenting an adequate approximation of the results from the experimental terms. In various models, a high F-value and small p-value (p ˂ 0.05) would show a more noticeable effect on the corresponding response variables. Therefore, the variable with the highest effect on the ML, EMC, and ASE24h of the treated OPW was the treatment temperature, while the buffered solutions and the treatment time demonstrated significantly less effect. Pure errors, such as experimental errors, were minimal as the value of lack-of-fit was insignificant for both responses.
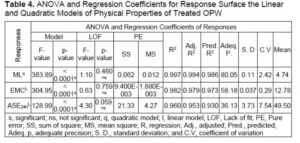
The results were evaluated with different descriptive statistics including the p-value, F-value, and the degree of freedom (df); the coefficient of determination (R2) of each coefficient was determined by Fisher’s F-test and probability values > F. The LOF F-test describes the data variation around the fitted model. The large P-values (> 0.05) for the displayed LOF in Table 4 indicate that the F-statistic was insignificant, which requires a significant model correlation between the treatment variables and responses. The data in this table illustrate that all models were significant at the 5% confidence level (p < 0.05) due to the P-values less than 0.05. In addition, the small probability value (p < 0.001) indicates that the models were highly significant and could be accurately used for the response function prediction.
Estimated regression coefficients of standard deviation, R2, predicted-R2, adjusted-R2, and adequate precession were associated to the effect of treatment variables. Model fit was evaluated using the coefficient of multiple regression (R2). The adjusted-R2 was used for confirming the adequacy of the model. The R2 values were 0.997, 0.982, and 0.960 for the ML, EMC, and ASE24h responses, respectively. The adequacy of the model was further proved by high adjusted-R2 of 0.994, 0.979, and 0.953 for the ML, EMC, and ASE24h responses, respectively. The analysis showed that EMC had the highest coefficient value, followed by the ML and ASE24h values as well as designs fitted well into the linear, quadratic, and linear polynomial models, respectively.
A high R2 value (close to 1) is desirable and a rational agreement with adjusted R2 is essential (Nordin et al. 2004). A high R2 coefficient ensures a satisfactory adjustment of the quadratic model to the empirical data. The goodness-of-fit for the models were thus evaluated by the coefficient of correlation R2 (determination coefficients) and adjusted-R2. The large value of R2 = 0.997 indicated the high reliability of the model in the prediction of the percentage of improvement and enhancement of the responses, by which this model can explain 99.7% of the response variability. Adequate precision (AP) compares the range of the predicted values at the design points to the mean prediction error. Ratios greater than 4 indicate adequate model difference (Beg et al. 2003; Mason et al. 2003). Moreover, Adequate precision (Adeq. p) values higher than 4 (Table 4) for all the responses confirm that all predicted models can be used to navigate the design space defined by the CCD. The coefficient of variance (CV) as the ratio of the estimated standard error to the mean value of the observed response determines the efficiency of the model. A model can normally be reproducible if its CV is not greater than 10% (CV ˃ 10) (Beg et al. 2003).
Effects of Buffered Solutions on Treated Responses
Weight loss/mass loss response function
The greater ML indicated significant degradation of the wood components such as the extractives, starch, and the cell wall of parenchyma tissue. Therefore, the degradation of wood polymers in acidic conditions significantly increases via acidic hydrolysis in various hydrothermal treatments (HTTs) (p < 0.05) (Tjeerdsma et al. 1998a,b). Moreover, in HTT using the buffered solutions, the pH of medium is kept constant at a certain level as well as the degradation effect of acids released is controlled and finally it causes the degradation reduction in treated wood (Talaei 2010; Taghiyari et al. 2011; Talaei and Karimi 2012a; Talaei et al. 2012b). Therefore, according to removal of extractives and starch from the wood structure, and their high dissolvability in aqueous solutions, weight loss and decreasing wood density appeared to be reasonable (Talaei and Yaghoobi 2009; Talaei et al. 2013).
Figures 1(a1, b1, and c1) show the 3D plots that are derived by ML% model. ML%’s range and mean were measured at about 2.25 to 8.61% and 4.73%, respectively. Figure 1a1 shows the response surface plot (RSP) for interaction between the temperature and the buffer solutions and was generated with time fixed in center point level (CPL).
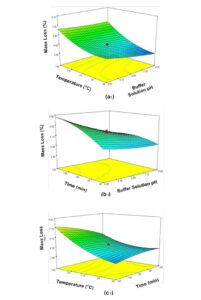
Fig. 1. 3-D Response surface plots for mass loss response function
The results showed that with the decrease of temperature from 140 to 80 °С and in the higher pH, the mass loss (ML%) was significantly reduced. It was shown that the minimum ML was obtained when the temperature was 80 °С. However, the alkalization of the treatment medium affected the ML less than the temperature did. In Fig. 1b1, a response surface plot for interaction between time and buffer solutions is shown with temperature kept constant in CPL. The results show that by decreasing the time from 120 to 40 min, the ML was decreased. It was demonstrated that the maximum ML was obtained when the time was 120 min. As indicated at Fig. b1, the pH of the buffer solution did not have significant effect on the ML. The interactions of temperature and time upon ML are presented in Fig. 1c1. In addition, in Fig. 1c1 the RSP shows the effect of the temperature and the time on ML% with pH fixed in CPL. The outcome indicated that the temperature had more effects on ML than the time. In contrast, the effects of the time were significant in the high range of the temperature; however, it was not significant at the lower temperature.
In all plots, temperature and the buffer solutions were more important factors relative to the changes of ML%. As shown, with the acidification of treatment medium and the increasing of the temperature process, a downward trend in ML% was observed. In this respect, research studies indicated that the decrease in density is due to an increase in ML% arising from heat treatment (Mohebby and Sanaei 2005; Tjeerdsma and Militz 2005; Talaei 2010; Talaei et al. 2014). Therefore, ML in the hydrothermal process is one of the most important factors to evaluate the physical properties of the hydrothermally treated wood that depends on wood species, medium pH of heating, temperature, and the duration of treatment. Thus, the ML% increases with increasing temperature and time of treatment (Boonstra et al. 2007; Esteves et al. 2008b). Yildiz et al. (2003) stated that the reason of the mass reduction can be the unstable nature of hemicellulose against heat so that in high temperature, hemicellulose is decomposed to the sugar and water-soluble compounds.
During the HTT process, degradable compounds and extractives are gradually degraded from the parenchyma cell wall and then transferred into the treatment medium. Additionally, the formation of weak acids, such as formic and acetic acids, resulting from the decomposition of the hemicellulose’s acetyl functional groups during acidic hydrolysis leads to the increase in the acidity of the treatment medium, de-acetylation of hemicellulose, and mass reduction (Sundqvist et al. 2006; Esteves and Pereira 2008). The increase in the temperature and the polysaccharides degradation are accompanied with the formation of acetic and formic acids, and furfural (Boonstra et al. 1998). The treatment in acidic medium degrades the starch, hemicellulose, and other extractives as well (Kim et al. 1998). The wood polymers destruction can be significantly increased through an acidic hydrolysis due to acidic conditions in HTTs (Tjeerdsma et al. 1998b). Mitsui et al. (2008) noted that treatment time had a direct relation with higher degradation and ultimately the reduction of ML.
Esteves et al. (2008b) reported that, although most of the principal extractives vanished from the heat-treated wood, the extractive content increased substantially with the ML. The major increase was due to water and ethanol extractives as a result of polysaccharide degradation. Bourgois et al. (1989) reported that the thermal treatment changes the chemical compositions of wood through degrading cell wall compounds (hemicellulose, cellulose, and lignin) and extractives. The chemical changes during the thermal process depend on wood species, temperature, and the duration of treatment, although temperature is as a major factor. Kocaefe et al. (2007) studied the parameters effect of heat treatment on ML and the mechanical properties of willow wood and found that the ratio of ML increases with increasing the treatment temperature and time.
The highest rate of deacetylation occurred in acidic medium (buffer 5), which was probably due to acidification and the gradual production of acids caused by the hemicelluloses’ degradation from starting the process. While in aqueous medium, with the releasing of organic acids from the wood, the medium will gradually become acidic. Furthermore, it can be concluded that the rate of carbohydrate degradation of wood in water and the acid buffer is much greater than the rate of degradation in neutral and alkaline buffer (pH 5 to 8) (Talaei and Karimi 2012b; Talaei et al. 2013). Therefore, the high ML% was observed in buffer 5 because of the higher degradation in acidic media. In neutral and weak alkaline buffer, the weight losses were lower because of the neutral medium and lower degradation of carbohydrates (Talaei 2010; Ebadi et al. 2019).
Therefore, the major reasons for the decrease can be referred to the extractives removal and starch and the parenchyma cells destruction. Hence, following the removal of extractives and starch from the structure of wood, their high solubility in aqueous solutions, weight loss (WL), and decrease of wood density (WD) appears explainable as well (Talaei and Yaghoobi 2009; Talaei et al. 2013). In addition, the ability for buffering of the treatment medium after relatively severe thermal treatment (140 °C) because of the buffer solutions’ pH reduction and the release of larger values of organic acids decreased and thus the amount of deacetylation increased (Talaei 2010; Talaei et al. 2013; Ebadi et al. 2015, 2016). Therefore, pH of treatment medium decreased with increasing temperature from 80 °С to 140 °С due to the release of large amounts of organic acids (Talaei and Karimi 2012b). The neutral buffer may also have an inhibitory effect through the control and neutralization of the acidity (pH) medium at a specified pH level (Talaei 2010; Ebadi et al. 2015). In the neutral and alkaline buffers, due to the neutralization of the acidic medium, the amount of acidic hydrolysis caused by the destruction of carbohydrates and ML is less (Talaei et al. 2013).
Equilibrium moisture content
The influence of HTT variables and their interaction effects on the EMC can be analyzed by using 3-D response graphs (Figs. 2a2, b2, and c2). EMC%’s range and mean were measured at about 12.28 to 13.24% and 12.78%, respectively. The response surface graphs are drawn/designed by two different parameters and in keeping the other parameter at constant center level (CCL). Figure 2a2 illustrates the interaction effect of temperature and the buffer solutions’ pH on EMC with keeping the other parameter at a CCL. The result showed that the EMC was decreased by increasing the temperature (80 °С to 140 °С) and alkalinization of medium pH. There was a significant difference in the EMC in both alkaline and acidic media as well. Figure 2b2 shows the interaction effects between the time and the buffer solutions, while temperature was fixed in CPL. The result illustrated that the EMC was decreased with increased time and also increased alkalization of the buffered medium. The interaction effects of temperature and time upon EMC with buffer solutions fixed in CPL are shown in Fig. 2c2. According to Fig. 2c2, the effect of the thermal treatment (TT) on the EMC was a more significant factor than the time. In addition, treated OPW in the alkaline media indicated a higher EMC compared to the samples treated in a neutral and acidic media. Therefore, it could be concluded that EMC improves with increasing the temperature (80 to 140 °С) and alkalization of medium pH.
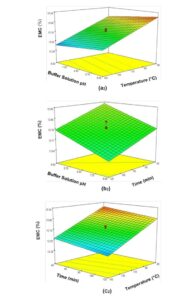
Fig. 2. 3-D response surface graphs for equilibrium moisture content
The initial moisture content (MC) and equilibrium moisture content (EMC) of the untreated (control) samples were 114% and 14.71%, respectively. In all plots, the temperature was the more important factor on the changes of EMC%. The main reasons for the decrease and improvement of the EMC of the hydrothermally treated wood include the removal of extractives from cellular structure, the reduction of -OH groups post-treatment, which participate in hydrogen bonding with the water molecules, as well as the increased crystallinity of cellulose, which reduces the availability of hydroxyl groups to water molecules (Tjeerdsma et al. 1998a,b; Sandberg and Navi 2007; Yuliansyah and Hirajima 2012; Salim et al. 2013; Talaei et al. 2013). The reduction of accessibility of the treated samples’ OH-groups leads to a limited interaction with water compared to the untreated samples (Syrjänen 2001). Moreover, the changes in the chemical composition of hemicelluloses lead to the degradation of -OH groups. This happens because hemicelluloses can be thermally decomposed at a lower temperature than cellulose (Wikberg and Maunu 2004). Hemicellulose is more hydroscopic (approximately 60 to 80%) than cellulose and lignin due to more -OH groups in its structure, so cellulose and lignin contribute minimally to the hygroscopic properties (Abdul Khalil et al. 2007; Boon et al. 2014). Additionally, increasing cellulose crystallinity due to the degradation of amorphous regions leads to an increase in the availability of hydroxyl groups to water molecules and also decreases the EMC (Wikberg and Maunu 2004; Bhuiyan and Hirai 2005; Boonstra et al. 2007).
Anti-swelling efficiency (ASE24h, %)
The response surface plots of the ASE24h model are displayed in Figs. 3a3, b3, and c3. ASE24h, %‘s range and mean were measured at about 0.2 to 0.6% and 0.49%, respectively. The response surface plot in Fig. 3a3 was drawn for the interaction effect between the treatment temperature and the buffer solutions by keeping the time variable at a fixed CPL. The results showed that the ASE24h increased with increased temperature (80 °С to 140 °С) and acidification of the medium pH, while the influence of the temperature was much higher than buffered solutions. Additionally, there was an insignificant difference between the effect of the buffered solutions’ pH upon the ASE24h response compared with the temperature variable. In Fig. 3b3, the response surface plot was designed for interaction effect between the time and buffer solutions upon the ASE24h, while keeping the temperature at a CCL. The results illustrated that the ASE24h was increased with increasing the process time and acidification of the treatment medium pH. In Fig. 4c, 3-D response plot illustrates the interaction effect of temperature and time on the ASE24h% by keeping the buffer solutions’ pH in the fixed CPL. According to the plots in Fig. 4c, the ASE24h% was increased by increasing the temperature and time and keeping the other treatment variable in the fixed center level. Finally, it can be concluded that in all plots, the temperature effect was more effective than the two other treatment variables.
The ASE value may be considered as a measure of the dimensional stability of wood. The determination of the ASE is based on the comparison of a treated specimen and an untreated specimen (Lothar and Alexander 2013). The increase in ASE due to the gradual increase of temperature and duration of the treatment can be explained by the thermal degradation of cell wall components. Further, in the temperature range of up to 120 °C, increasingly hemicelluloses are degraded, whose OH-groups are responsible for the high hygroscopic behavior of the wood (Lothar and Alexander 2013).
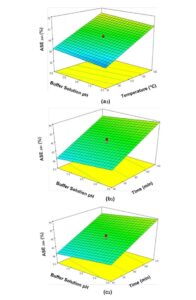
Fig. 3. 3-D response surface plots for %ASE24h
In addition to inaccuracy from measurement, the reliability of ASE as an indicator for reduction in swelling is reduced by the fact that cell walls can and do expand inwards, as mentioned by Hill (2007). However, it should be noted that the inward expansion of the cell wall is unlikely to have any effect on the usability of wood in service (at least from a dimensional stability point of view) and in this sense, ASE is a worthwhile indicator for dimensional stability.
Therefore, ASE demonstrates the difference between the swelling of the treated wood (Militz 2002). Chemical variations in wood structure can be one of the important reasons for the increasing porosity percentage that causes the change and increase in the ASE as well as the high rate of water absorption (Husin et al. 1985; Tomimura 1992; Siti 2009). Zaihan et al. (2011) stated that the absorbed water in the starch is more than the cell wall. Moreover, high absorption rate was seen in the treated samples because of the thin-walled parenchyma cells and the percentage of more porosity (Paridah et al. 2006). The main reasons for increasing the water absorption (WA) in hydrothermally treated samples can also be due to the removal and decomposition of the starch, extractives, the degradation of the parenchyma cell wall, and also the created micro-cracks in the cell wall of the treated wood (Oltean et al. 2007). Siti 2009 stated that the amount of free sugars and starch in the freshly felled oil palm trunk (OPT) might generally reach up to 10% and 25%, respectively. A total amount of 2 to 10% free sugars throughout the trunk height has been reported by Halimahton and Ahmad (1990). In addition, OPW contains the highest extractives content among other monocotyledon plants. Furthermore, in the OPW the amount of extractives can reach up to 9.8% in the alcohol extraction process (Siti 2009).
The Optimum Conditions Prediction of Response Function
For validation of the models based on the optimum treatment variables, a new experiment carried out based on the optimal predicted conditions by CCD using RSM and then the experimental (actual) results were compared with the predicted values (Table 5). Furthermore, there was a good agreement between the predicted and experimental results at the optimum values with residual standard error (RSE) of less than 5%, which represents the high validity of the model. Therefore, the experiential model resulting from experimental design of RSM can be used to describe the sufficient relationship between the treatment variables and responses function (physical properties).
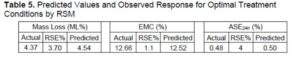
Therefore, the buffer solution with a pH of 7.34, a temperature of 112.7 °С, and a time of 109.6 min would be the optimum conditions predicted for the HTT.
CONCLUSIONS
The hydrothermal treatment (HTT) process was conducted as an efficient method for treating the oil palm wood (OPW) using buffered solutions. Response surface methodology (RSM) based on a central composite design (CCD) was used to evaluate and optimize the effect of the treatment variables (the buffered solutions, temperature, and time) as well as their interaction effects on the physical properties (responses) of the hydrothermally treated OPW. The complete design of the factorial was tested by 20 different treatments with different combinations of treatment variables. The treatment variables were modeled using multiple regression during the HTT process as well.
- It was found that the neutral buffer solution at a relatively low temperature can control the destructive effects of the released acids resulting from acidic hydrolysis during the HTT process via the neutralization of medium acidity.
- The ANOVA indicated high confidence levels of the obtained correlations. The correlation coefficients R² for the linear and quadratic models of the mass loss (ML) (0.997), equilibrium moisture content (EMC) (0.982), and anti-swelling efficiency (ASE24h) (0.960) were quite satisfactory as well.
- The experimental (actual) values agreed with predicted results, which indicates the models’ adequacy. This adequacy state of the derived models was studied to predict the optimal treatment conditions in the range of variables during the experiments. The derived models could be particularly used to optimize the hydrothermal treatment conditions and improve the physical properties of the treated OPW.
- The mean of experimental (actual) values for ML%, EMC%, and ASE24h% were (measured) 4.66, 12.78, and 0.48%, respectively.
ACKNOWLEDGMENTS
The authors would like to thank the Research Management Centre of Universiti Putra Malaysia (UPM), for providing financial support through the Research University Grant Scheme (Grant No. HICoE 6369107).
REFERENCES CITED
Abdul Khalil, H. P. S., Siti Alwani, M., and Mohd Omar, A. K. (2007). “Chemical composition, anatomy, lignin distribution, and cell wall structure of Malaysian plant waste fibers,” BioResources, 1(2), 220-232. doi: 10.15376/biores,1(2), 220-232.
Abdullah, C. K., Jawaid, M., Abdul Khalil, H. P. S., Zaidon, A., and Hadiyane, A. (2012). “Oil palm trunk polymer composite: Morphology, water absorption, and thickness swelling behaviours,” BioResources 7(3), 2948-2948.
Amarullah, M., Bakar, E. S., Zaidon, A., Hamami, S. M., and Febrianto, F. (2010). “Reduction of formaldehyde emission from phenol formaldehyde treated oil palm wood through improvement of resin curing state,” Journal of Tropical Wood Science and Technology 8(1), 9-14 .
Bakar, E. S., Sahri, M. H., and H’ng, P. S. (2008). “Anatomical characteristics and utilization of oil palm wood,” in: The Formation of Wood in Tropical Forest Trees: A Challenge from the Perspective of Functional Wood Anatomy, Universiti Putra Malaysia Academic Press, Serdang, Malaysia, pp. 161-178.
Bakar, E. S., Tahir, P. M., Sahri, M. H., Mohd Noor, M. S., and Zulkifli, F. F. (2012). “Properties of resin impregnated oil palm wood (Elaeis guineensis Jacq),” Pertanika Pertanika J. Trop. Agric. Sci. 36, 93-100.
Beg, Q., Sahai, V., and Gupta, R. (2003). “Statistical media optimization and alkaline protease production from Bacillus mojavensis in a bioreactor,” Process Biochem. 39(2), 203-209. DOI: 10.1016/S0032-9592(03)00064-5
Bezerra, M. A., Santelli, R. E., Oliveira, E. P., Villar, L. S., and Escaleira, L. A. (2008). “Response surface methodology (RSM) as a tool for optimization in analytical chemistry,” Talanta 76(5), 965–977. DOI: 10.1016/j.talanta.2008.05.019.
Bhuiyan, T., and Hirai, N. (2005). “Study of crystalline behavior of heat-treated wood cellulose during treatments in water,” Journal of Wood Science, 51(1), 42-47.
Boon, J. G., Hashim, R., Sulaiman, O., Wan, W.N.A., and Ibrahim, M. H. (2014). “The influence of starch in oil palm trunk particleboard without synthetic adhesive,” Lignocellulose, 3(2), 119-130.
Boonstra, M. J., Van Acker, J., Tjeerdsma, B. F., and Kegel, E. V. (2007). “Strength properties of thermally modified softwoods and its relation to polymeric structural wood constituents,” Ann. Forest Sci. 64(7), 679-690. DOI: 10.1051/forest:2007048
Boonstra, M. J., Tjeerdsma, B. F., and Groeneveld, H. A. C. (1998). “Thermal modification of non-durable wood species, 1. The PLATO technology: Thermal modification of wood (IRG/WP 98: Pp 40123),” in: International Research Group on Wood Preservation, Stockholm, Sweden.
Bourgois, J., Bartholin, M. C., and Guyonnet, R. (1989). “Thermal treatment of wood: Analysis of the obtained product,” Wood Science and Technology, 23(4), 303-310.
Box, G. E., and Draper, N.R. (1987). Empirical Model-building and Response Surfaces, (Vol. 424), Wiley, New York, NY.
Brown, S. R., and Melamed, L. E. (1990). Experimental Design and Snalysis (No. 74), Sage.
BS 373: 1957 (1986). “Standard methods of testing small clear specimens of timber,” British Standards Institution, London, England.
David, E. K., and Madison, W. (2010). “Mechanical properties of wood,” Wood Handbook: Wood as an Engineering Material, U.S. Department of Agriculture, Forest Service, Forest Products Laboratory, Madison, WI, USA, pp. 5.1-5.46.
Ebadi, S. E., Karimi, A., Choo, A. C., Ashaari, Z., Naji, H. R., Soltani, M., and Ridzuan, S. M. A. (2015). “Physical behavior of hydro-thermally treated oil palm wood in different buffered pH media,” BioResources 10(3), 5317-5329. DOI: 10.15376/biores.10.3.5317-5329
Ebadi, S. E., Ashaari, Z., Naji, H. R., Jawaid, M., Soltani, M., and H’ng, P. S. (2016). “Mechanical behavior of hydrothermally treated oil palm wood in different buffered pH media,” Wood and Fiber Science 48(3), 1-9.
Ebadi, S. E., Ashaari, Z., Late Masoumi, H. R. F., Soltani, M., Naji, H. R., and Vaysi, R. (2019). “Evaluation of bending strength of hydrothermally treated oil palm wood in various buffered media using response surface methodology,” J. Trop. Forest Sci. 31(2), 151-161. DOI: 10.26525/jtfs2019.31.2.151161
Endo, K., Obataya, E., Zeniya, N., and Matsuo, M. (2016). “Effects of heating humidity on the physical properties of hydrothermally treated spruce wood,” Wood Sci. Technol. 50(6), 1161-1179. DOI: 10.1007/s00226-016-0822-4
Erwinsyah, V. (2008). Improvement of Oil Palm Trunk Properties Using Bioresin, Ph.D. Dissertation, Technische Universitat Dresden, Germany.
Esteves, B., and Pereira, H. (2008). “Wood modification by heat treatment: A review,” BioResources, 4(1), 370–404.
Esteves, B., Graça, J., and Pereira, H. (2008b). “Extractive composition and summative chemical analysis of thermally treated eucalypt wood,” Holzforschung, (62), 344-351. DOI: 10.1515/HF.2008.057.
Garrote, G., Dominguez, H., and Parajo, J. C. (1999). “Hydrothermal processing of lignocellulosic materials,” Holz. Roh. Werkst. 57(3), 191-202. DOI: 10.1007/s001070050039
Gündüz, G., Aydemir, D., and Karakas, G. (2009). “The effects of thermal treatment on the physical properties of wild pear (Pyrus elaeagnifolia Pall.) wood and changes in physical properties,” Mater. Des. 30(10), 4391- 4395. DOI: 10.1016/j.matdes.2009.04.005.
Halimahton, M., and Ahmad, A.R. (1990). “Carbohydrates in the oil palm stem and their potensial use,” Journal of Tropical Forest Science, 2(3), 220–226.
Hartley, C. W. S. (1988). The Oil Palm (Elaeis guineensis Jacq.), 3rd Ed., Longmans, Green and Co., Ltd., London, England, pp. 37-49.
Hill, C. A. S. (2007). Wood Modification: Chemical, Thermal and Other Processes, Vol. 5, John Wiley & Sons, Chichester, England.
Husin, M., Zakaria, Z.Z., and Hasan, A. H. (1985). “Potentials of oil palm by-products as raw materials for agro-based industries,” in: Proceedings of the National Symposium on Oil Palm By-Products for Agro-Based Industries. Kuala Lumpur, Palm Oil Research Institute of Malaysia, Bangi. PORIM Bulletin, (11), 7–15.
Khuri, A. I., and Cornell, J. A. (1996). Response Surfaces, Design and Analyses, 2nd Ed., Marcel Dekker Inc., New York, NY, USA.
Khuri, A. I., and Mukhopadhyay, S. (2010). “Response surface methodology,” Wiley Interdiscip. Rev. Comput. Stat. 2(2), 128-149. DOI: 10.1002/wics.73 10.1002/wics.73
Killmann, W., and Lim, S. C. (1985). “Anatomy and properties of oil palm stem,” in: Proceedings of the National Symposium of Oil Palm By-Products for Agro based Industries, Kuala Lumpur. PORIM Bulletin, (11), 18-42.
Kim, G., Yun, K., and Kim, J. (1998). “Effect of heat treatment on the decay resistance and the bending properties of radiata pine sapwood,” Material and Organismen 32(2), 101-108.
Kocaefe, D., Chaudbry, B., Poncsak, S., Bouazara, M., and Pichette, A. (2007). “Therogravimetric study of high temperature treatment of aspen: Effect of treatment parameters on mass loss and mechanical properties,” J.Mater Sci, (42), 854-866.
Loh, Y. F., Paridah, M. T., Hoong, Y. B., and Choo, A. C. Y. (2011). “Effects of treatment with low molecular phenol formaldehyde resin on the surface characteristics of oil palm (Elaeis quineensis) stem veneer,” Mater. Des. 32(4), 2277-2283. DOI: 10.1016/j.matdes.2010.11.014
Lothar, C., and Alexander P. (2013). “Determination of dimensional stability of thermally modified beech (Fagus sylvatica L.) and spruce (Picea abies L.) wood,” Conference Agenda (Poster), Wood Modification, Network in Baltic Sea Region, Romania.
Mason, R. L., Gunst, R. F., and Hess, J. L. (2003). “Statistical design and analysis of experiments,” in: Eighth Applications to Engineering and Science, 2nd Ed., John Wiley & Sons, Hoboken, NJ, USA, pp. 568-591.
Mohebby, B., and Sanaei, I. (2005). “Influences of the hydro-thermal treatment on physical properties of beech wood (Fagus orientalis),” in: Annual Meeting Bangalore (Vol. 36).
Myers, R. H., and Montgomery, D. C. (2002). “Response Surface Methodology: Process and Product Optimization Using Designed Experiments, 2nd Ed., John Wiley & Sons, New York, NY, USA.
Nordin, M. Y., Venkatesh, V. C., Sharif, S., Elting, S., and Abdullah, A. (2004). “Application of response surface methodology in describing the performance of coated carbide tools when turning AISI 1045 steel,” J. Mater. Process. Technol. 145(1), 46–58. DOI: 10.1016/S0924-0136(03)00861- 6.
Paridah, M. T., Loh, Y. F., Jalaluddin, H., and Zaidon, A. (2006). “Improving the performance of oil palm trunk plywood by optimising the veneer density distribution,” in: Processing on Second International Symposium on Veneer Processing and Products, May 9 and 10, 2006. Vancouver, BC, Canada, pp. 389-396.
Poncsak, S., Kocaefe, D., Bouazara, M., and Pichette, A. (2006). “Effect of high temperature treatment on the physical properties of birch (Betula papyrifera),” Wood Sci. Technol. 40(8), 647-663. DOI: 10.1007/s00226-006-0082-9
Oltean, L., Teischinger, A., and Hansmann, C. (2007). “Influence of temperature on cracking and mechanical properties of wood during wood drying – A review,” BioResources 2(4), 789-811.
Salim, N., Hashim, R., Sulaiman, O., Nordin, N. A., Ibrahim, M., Akil, H. M., and Hiziroglu, S. (2013). “Effect of steaming on some properties of compressed oil palm trunk lumber,” BioResources, 8(2), 2310-2324.
Saliman, M. A. R., Ashaari, Z., Bakar, E. S., Hua, L. S., Tahir, P. M., Halip, J. A., and Leemon, N. F. (2017). “Hydrothermal treatment of oil palm wood: Effect of treatment variables on dimensional stability using response surface methodology,” J. Oil Palm Res. 29(1), 130-135.
Sandberg, D., and Navi, P. (2007). Introduction to Thermo-Hydro-Physical (THM) Wood Processing, Växjö University Skog & Trä, Växjö, Sweden.
Shams, M., and Yano, H. (2004). “Compressive deformation of wood impregnated with low molecular weight phenol formaldehyde (PF) resin II: Effects of processing parameters,” J. Wood Sci. 50(4), 343-350. DOI: 10.1007/s10086-003-0571-5.
Siti, N. S. (2009). “Effect of cold setting adhesives and glue spread on properties of oil palm trunk laminated veneers,” Master dissertation. Universiti Sains Malaysia.
Sundqvist, B., Karlsson, O., and Westermark, U. (2006). “Determination of formic-acid and acetic acid concentrations formed during hydrothermal treatment of birch wood and its relation to colour, strength and hardness,” Wood Sci. Technol. 40(7), 549-561. DOI: 10.1007/s00226-006-0071-z.
Syrjänen, T., and Oy, K. (2001). “Production and classification of heat Treated Wood in Finland. Review on Heat Treatment of wood,” in: Cost Action E 22, Proceeding of Special Seminar Held in Antibes, February 2001, France, 7-15.
Taghiyari, H. R., Rangavar, H., and Bibalan, O. F. (2011). “Effect of nano-silver on reduction of hot-pressing time and improvement in physical and mechanical properties of particleboard,” BioResources, 6(4), pp.4067-4075.
Talaei, A. (2010). Effects of Hydrothermal Treatment in Buffered Medium on Natural Durability and Physical Properties of Beech Wood, Ph.D. Dissertation, University of Tehran, Tehran, Iran.
Talaei, A., and Karimi, A. (2012a). “Chemical analysis of hydrothermally treated beech wood in buffered media (IRG/WP43 Conference),” in: International Research Group on Wood Preservation, Kuala Lumpur, Malaysia.
Talaei, A., and Karimi, A. (2012b). “Physical properties of hydrothermally treated beech wood in buffered media (IRG/WP43),” in: International Research Group on Wood Preservation, Kuala Lumpur, Malaysia.
Talaei, A., and Karimi, A. (2012c). “Mechanical properties of hydrothermally treated beech wood in buffered mediums (IRG/WP 12-40597),” in: International Research Group on Wood Preservation, Kuala Lumpur, Malaysia.
Talaei, A., Karimi, A., and Thevenon, M. F. (2013). “Influence of heat treatment medium on fungal resistance of beech wood (IRG/WP 13-40643),” in: International Research Group on Wood Preservation, Stockholm, Sweden.
Talaei, A., Karimi, A., and Paridah, M. T. (2014). Heat Treatment of Wood: Methods and Properties, Universiti Putra Malaysia Press, Serdang, Malaysia.
Talaei, A., and Karimi, A. (2015). “Compression strength, hardness and shear strength of heat treated beech (Fagus orientalis) wood in buffered mediums,” International Journal of Mechanical and Production Engineering 3(2), 6-9.
Talaei, A., and Yaghoobi, K. (2009). “Physical and mechanical properties of hydrothermally modified beech (Morus alba L.) Wood,” International Research Group on Wood Preservation, IRG/WP 09-40425, Stockholm, Sweden.
Tjeerdsma, B. F., and Militz, H. (2005). “Chemical changes in hydrothermal treated wood: FTIR analysis of combined hydrothermal and dry heat-treated wood,” Holz. Roh. Werkst. 63(2), 102-111. DOI: 10.1007/s00107-004-0532-8.
Tjeerdsma, B. F., Boonstra, M., Pizzi, A., Tekely, P., and Militz, H. (1998a). ”Characterisation of thermally modified wood: molecular reasons for wood performance improvement. CP-MAS 13C NMR characterisation of thermal modified wood,” Holz als Roh- und Werkstoff, 56(3), 149-153. DOI: 10.1007/s001070050287.
Tjeerdsma, B. F., Boonstra, M., and Militz, H. (1998b). “Thermal modification of non-durable wood species 2. Improved wood properties of thermally treated wood. International research group on wood preservation,” in: Maastricht. The Netherlands, 14-19. N IRG/WP 98- 40124.
Tomimura, Y. (1992). “Chemical characteristics and utilization of oil palm trunks,” JARQ, 25(4), 283-288.
Wang, J. Y., and Cooper, P. A. (2005). “Effect of oil type, temperature and time on moisture properties of hot oil-treated wood,” Holz. Roh. Werkst. 63(6), 417-422. DOI: 10.1007/s00107-005-0033-4
Widiarti, L., Gea, S., and Wirjosentono, B. (2015). “Mechanical properties of oil palm trunk by reactive compregnation method with dammar resin,” International Journal of PharmTech Research. 8(1), 74-79.
Wikberg, H., and Maunu, S. L. (2004). “Characterisation of thermally modified hard- and softwoods by 13C CPMAS NMR,” Carbohydr Polym (58), 461-466.
Wu, T. Y., Mohammad, A. W., Jahim, J. M., Anuar, N. (2009). “Optimized reuse and bioconversion from retentate of pre-filtered palm oil mill effluent (POME) into microbial protease by Aspergillus terreus using response surface methodology,” Journal of Chemical Technology and Biotechnology 84(9), 1390-1396.
Yildiz, U., Gercek, Z., Yildize, S., Gezer, E., Serdar, B., Yildiz, S., Gezer, E. D., Dizman, E., and Temiz, A. (2003). “The effects of heat treatment on the specific gravity of beech and spruce wood (IRG/WP 03- 40254),” in: International Research Group on Wood Preservation 34th Annual Meeting, Brisbane, Queensland, Australia.
Yuliansyah, A. T., and Hirajima, T. (2012). “Efficacy of hydrothermal treatment for production of solid fuel from oil palm wastes,” in: Agricultural and Biological Sciences; Resource Management for Sustainable Agriculture, 1st ed., V. Abrol and P. Sharma (eds.), Intech Open Access Publisher, Rijeka, Croatia. DOI: 10.5772/50581.
Zaidon, A., Lee, S. H., Mustamel, M. N., and Salleh, N. F. M. (2015). “Strength improvement of jelutong (Dyera costulata) wood via phenolic resin treatments,” J. Ind. Acad. Wood Sci. 12(2), 132-136. DOI: 10.1007/s13196-015-0156-0
Article submitted: April 27, 2020; Peer review completed: October 10, 2020; Revised version received: November 29, 2020; Accepted: December 16, 2020; Published: February 8, 2021.
DOI: 10.15376/biores.16.2.2385-2405