
Abstract
A study was undertaken with the aim to determine thermal properties of balsa wood grown in plantations in Papua New Guinea. Thermal conductivity values were measured using the needle probe procedure according to ASTM D5334 (2008). The mean thermal conductivity results of balsa were in the range of 0.0381 W/mK to 0.0665 W/mK, similar to other materials currently used as insulators in the construction industry. A balsa sample with a density of 113 kg m3 had the lowest thermal conductivity value, 0.0339 W/mK, across the tangential and radial wood grain directions. Balsa is exported from Papua New Guinea mostly as end-grain panels to international markets to optimise its strength properties in the axial direction for applications that are exposed to compressive forces. This study revealed that there is the opportunity for Papua New Guinea balsa processors to consider producing perpendicular-grain panels for insulation markets, as the mean thermal conductivity values in this direction can be as low as 0.0381 W/mK, which is much lower than the thermal conductivity of the current end-grain panels at 0.0665 W/mK. The finding creates a potential design opportunity for balsa processors to consider entering new commercial markets to promote Papua New Guinea-grown balsa.
Download PDF
Full Article
Thermal Conductivity of Papua New Guinea Balsa Wood Measured using the Needle Probe Procedure
Nathan J. Kotlarewski,a,* Barbara Ozarska,b and Benson K. Gusamo c
A study was undertaken with the aim to determine thermal properties of balsa wood grown in plantations in Papua New Guinea. Thermal conductivity values were measured using the needle probe procedure according to ASTM D5334 (2008). The mean thermal conductivity results of balsa were in the range of 0.0381 W/mK to 0.0665 W/mK, similar to other materials currently used as insulators in the construction industry. A balsa sample with a density of 113 kg m3 had the lowest thermal conductivity value, 0.0339 W/mK, across the tangential and radial wood grain directions. Balsa is exported from Papua New Guinea mostly as end-grain panels to international markets to optimise its strength properties in the axial direction for applications that are exposed to compressive forces. This study revealed that there is the opportunity for Papua New Guinea balsa processors to consider producing perpendicular-grain panels for insulation markets, as the mean thermal conductivity values in this direction can be as low as 0.0381 W/mK, which is much lower than the thermal conductivity of the current end-grain panels at 0.0665 W/mK. The finding creates a potential design opportunity for balsa processors to consider entering new commercial markets to promote Papua New Guinea-grown balsa.
Keywords: Balsa; Needle Probe; Papua New Guinea (PNG); Thermal Conductivity (TC)
Contact information: a: Swinburne University of Technology, Melbourne, Australia; b: University of Melbourne, Melbourne, Australia; c: Bulolo University College, Bulolo, Papua New Guinea;
* Corresponding author: nkotlarewski@swin.edu.au
INTRODUCTION
Balsa (Ochroma pyramidale, syn. O. lagopus) is a sub-tropical and tropical hardwood native to the Latin American continent but is now found in many other countries, including Papua New Guinea (PNG). The world’s largest balsa processor is Ecuador. According to a study by Midgley et al. (2010), Ecuador supplied 89% of the global balsa market in 2008, whereas PNG supplied 8%. Balsa plantations in PNG are harvested on five to seven year rotations (Midgley et al. 2010). Balsa is commonly harvested, sawn into lumber which is dried, cut and machined into small sized components used for the production of edge laminated panels. The panels are then laminated into large glued blocks of different sizes depending on customers’ requirements. The glued blocks are then sliced into sheets that form end-grain panels with the wood fibres oriented perpendicular to the face of the core sheet. This end-grain orientation offers very high compression and shear properties, fundamental for good sandwich construction and extremely high strength and stiffness-to-weight ratios (Fig. 1).
According to Midgley (2010), processed balsa is categorised into three density groups: light (80 to 120 kg/m3), medium (120 to 180 kg/m3), and heavy (180 to 220 kg/m3). Bootle (1983) highlights that the density ranges of balsa are 50 to 400 kg/m3, with the most desirable densities for commercial use ranging from 110 to 170 kg/m3. The light-weight nature of balsa provides multiple opportunities for its utilisation in applications where weight is an important consideration.

Fig. 1. Large glued block of basla (left) and end-grain panel (right) commonly exported from PNG as a core catalyst material
Balsa’s largest commercial market is for wind turbine production, where end-grain panels are used as a core catalyst material in turbine blades. Unfortunately, this market has declined in production and has reduced the demand for PNG balsa. Balsa is predominantly used in five commercial industries: marine, road and rail, wind energy, aerospace, and defence (Midgley et al. 2012). As identified by Gusamo et al. (2013), there is an opportunity for balsa to compete with lightweight composite building materials such as plywood, masonite, particleboard, or medium density fibreboards in applications such as internal wall and ceiling construction at reduced costs. Another possible application that could be explored is the use of balsa as an insulation material. For this application the thermal properties of balsa are required.
Thermal Conductivity of Wood
The TC is the measurement of “the rate of heat flow through a material when subjected to a temperature gradient” (Bootle 1983). Because wood is anisotropic by nature, the direction of the grain differs in the axial (longitudinal), tangential, and radial directions. There is an abundant amount of experimental literature that measures the TC of insulation materials at a range of local temperatures, material density, and moisture content. Highlighted by Pelaez-Samaniego et al. (2013), the hygroscopic nature of wood affects its physical properties (dimensional stability, density, and affinity to other materials) and performance (mechanical and thermal). The TC of insulation materials is affected by its density, porosity, moisture content, mean temperature difference, grain direction, and extractives content (Bootle 1983; Abdou and Budaiwi 2005; Yapici et al. 2011). Matias et al. (1997) further claimed that TC test results differ from lab to lab. Cai and Garrahan (2006) identified the TC of wood below 0 °C increases with moisture content, due to the presence of ice. Bootle (1983) highlighted that an increase in density, extractives content, and moisture content increases the TC value. Moreover, the rate of heat flow in the axial direction is two and a half times greater than the rate through the radial and tangential directions. Faouel et al. (2012) also highlighted that “the axial TC is largely higher than in other directions and tangential TC is slightly lower than the radial TC”. Additionally, Glass and Zelinka (2010) claimed the TC of timber is also affected by structural irregularities (checks and knots) and fibril angles.
EXPERIMENTAL
Materials
Balsa
All balsa samples used for testing originated from PNG plantations. Samples were harvested, carefully selected as defect free and straight-grained, sawn, and kiln-dried in PNG before being shipped to Melbourne, Australia. Three types of balsa samples were selected. The first was a typical end-grain composite block, the second was high density lumber, and the third was low density lumber. Samples were cut to 85 mm x 85 mm x 85 mm blocks and conditioned at 20 ± 3 °C and 65 ± 3% relative humidity until the weight of each sample was equilibrated and a 12% moisture content was achieved. A total of three samples were tested; one end-grain block of 174 kg/m3 density, one high-density sample of 137 kg/m3 density, and one low-density sample of 113 kg/m3.
Methods
Test execution
Tests were conducted using a TK04 thermal conductivity meter using the standard VLQ full-space probe (needle probe) (TeKa; Berlin, Germany). According to ASTM D5334 (2008), the test method is only suitable for isotropic materials, which can explain the absence in literature of experimenting with the needle probe to determine the TC of wood samples. The needle probe method calculates the TC of isotropic materials by measuring the surrounding body of material perpendicular to the needle probe. The TC of anisotropic materials such as balsa is therefore calculated by measuring the surrounding wood grain directions to determine a geometric mean for the axial/radial, axial/tangential, and radial/tangential wood grain directions (Fig. 2.). Where the literature states the tangential direction has the lowest TC value (Faouel et al. 2012), in order to prove this using the needle probe method the probe was inserted parallel to the radial direction to measure the geometric mean for the axial/tangential grain directions. The purpose of performing the needle probe procedure on balsa samples was to generate quick results to determine if balsa has good thermal performance.
Each balsa sample was drilled in one axial, tangential, and radial direction to allow the needle probe to be inserted into the balsa sample. This allowed the needle probe to calculate the TC as a geometric mean in each grain direction. By inserting the needle probe into the axial direction, the probe would calculate the geometric mean of the radial and tangential directions. Similarly, measurements taken from the radial direction would calculate the geometric mean of the axial and tangential directions. A total of two tests on separate occasions were conducted within this study. Both tests measured the TC from the axial, radial, and tangential directions. The second test measured a different hole spaced 10 to 15 mm away from the original hole. Each hole was tested three times to generate a range of data to see how consistent the calculated results were. The first set of tests measured the temperature rise of the needle probe over 80 seconds (default measuring time). The second tests were performed at the same location using the same equipment over 120 s. It is noted for use of the TK04 Thermal Conductivity Meter 2011 that measurements taken after 80 s are influenced by boundary effects; however tests were conducted to determine a range of variable data. Over the duration of the tests, the rise in temperature was graphed against time to determine the greatest change in temperature.

Fig. 2. Labeled balsa sample identifying wood grain direction
Given the high porosity of balsa, a thermal joint compound paste was used to reduce the amount of air cavities in the sample. Any contact agent with a low viscosity such as glycerine failed in this application because the substance was absorbed by the balsa sample and affected the results due to local saturation in the holes where the needle probe was inserted.
Thermal conductivity formula
The formula given as Eq. 1 was used to calculate the TC (TK04 Thermal Conductivity Meter 2011),
 (1)
(1)
where Λ is the thermal conductivity (TC) (W/mK), T is temperature (°C), ln is the natural logarithm, tis the time interval (s), and Q is heating power (W).
RESULTS AND DISCUSSION
The following terms were used to describe which direction of the sample was tested, therefore measuring the opposing wood grain directions as highlighted in the method: End-grain axial (E-G Long), end-grain radial/tangential side A (E-G RTA), end-grain radial/tangential side B (E-G RTB), low density axial (L Long), low density radial (L Rad), low density tangential (L Tan), high density axial (H Long), high density radial (H Rad), and high density tangential (H Tan).
Table 1. Test 1, Balsa TC Results

Note: Each sample was tested three times to calculate the geometric mean (± standard deviation)
Table 1 highlights the fact that balsa can achieve a TC value as low as 0.0339 W/mK. Figure 3 is the measured curve generated by the TK04 to highlight the region where the change in the natural logarithm and temperature was the greatest. The largest changes in temperature (0.204 °C) and the natural logarithm (0.288) were isolated between 60 and 80 s. Table 2 contains the data used to calculate the TC result.

Fig. 3. Change in natural logarithm and temperature against time
Table 2. Data Used to Calculate the TC for Test 1, Sample L Long, Trial 1

Table 3 shows that the balsa sample with a high density could achieve a low TC value of 0.0373 W/mK. Considering that the H Long sample measured an initial low TC from the axial direction, this indicates that the TC of anisotropic materials can vary depending on the density and other variables such as fibril alignment. Unlike the TC calculated from the axial direction on the high density sample, the tangential and radial values were considerably higher than the values calculated from the lower density sample. Table 4 presents the data used to calculate the result of the H Long sample. The largest change in temperature (0.081 °C) and the natural logarithm (0.125) were isolated between 75 and 85 s.
Table 3. Test 2, Balsa TC Results

Note: Each sample was tested three times to calculate the geometric mean (± standard deviation)
Table 4. Data Used to Calculate the TC for Test 2, Sample H Long, Trial 1

Table 5. Comparison of Mean Balsa TC Results from Test 1 and 2 to Determine Final Geometric Mean

Results presented in this paper reveal that, generally, the lower the density of balsa, the lower the TC value (Fig. 4). Although some measured results did not follow this trend, the majority of the tests did behave as stated in the relevant literature (Bootle 1983; Yapici et al. 2011; Faouel et al. 2012). Table 5 compares the test results of balsa’s TC using the needle probe procedure from the two tests conducted on separate occasions (test 2 was conducted 12 days after test 1). Most values were consistent; however, it is evident that the values measured in the end-grain block sample with a density of 174 kg/m3 were highly variable and behaved differently than the standard lumber samples. Standard lumber TC ranged from 0.0363 W/mK to 0.0558 W/mK compared to the end-grain block’s range of 0.0398 W/mK to 0.0695 W/mK (Table 5). This may be because the end-grain sample contains multiple balsa lumber pieces. This configuration is a combination of lumber with different densities glued together. Although lumber pieces of similar densities are specifically sourced to produce these composite blocks, there is still a large variation of each piece’s density in the final composite. For example, two pieces glued together may have densities of 121 kg/m3 and 179 kg/m3 and be categorised in the same density category (medium). The end-grain block sample in this study consisted of five different balsa densities, as highlighted in Fig. 5.
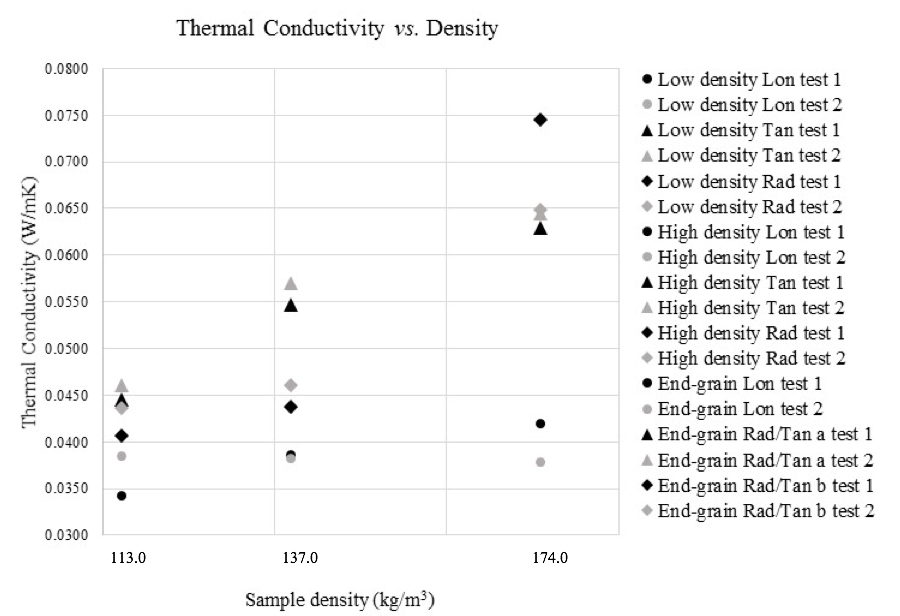
Fig. 4. Mean calculated TC from tests 1 and 2 graphed against density to show the effect density has on TC
The tangential and radial wood grain direction of the lumber glued together in end-grain configurations also varied because it is not necessary for processors to align these grain directions; this is why they are labelled end-grain tangential/radial. Note, all axial grain directions were aligned in the end-grain sample. Table 6 shows that the mean TC in any axial direction produces higher TC values (0.0435 to 0.0665 W/mK) compared to the tangential and radial direction (0.0381 W/mK). The mean axial and tangential TC value (0.0435 W/mK) is also less than the mean axial and radial direction (0.0503 W/mK). The unique combination of tangential and radial directions that exist in the end-grain composite sample produces a superior insulating material that has the lowest mean TC of 0.0381 W/mK. By comparison, the axial and tangential/radial direction has the highest mean TC of 0.0665 W/mK, which may be due to fibril alignment, air pockets, glue interference, and/or poor lamination between lumber, as evident in the end-grain sample results.

Fig. 5. End-grain sample consisting of five different densities (colour used to identify different laminated components of balsa used to manufacture the end-grain sample)
Table 6. Mean TC of Each Grain Direction Calculated from Results of Table 5

Table 7. TC Values of Different Materials

Table 7 is a list of published TC values of various materials. Expanded polystyrene has the lowest TC value, making it a highly desirable insulation material. However, balsa offers many competitive advantages; balsa is a sustainable and renewable resource, has aesthetic qualities, has a naturally low TC value, is processed and manufactured with a low embodied energy, has green star credentials, and is naturally lightweight. The balsa sample with the highest density of 174 kg/m3 (end-grain composite) produced the largest recorded TC value of 0.0763 W/mK (Table 1). This result reveals that even balsa samples with less desirable TC can compete with manufactured materials (plywood and plaster board) that possess higher densities, more weight, and exhibit a less superior and artificial TC value. Actually, polystyrene (0.0365 W/mK) and insulation corkboard (0.045W/mK) would compete directly with balsa as insulation materials for commercial applications.
The values generated from each sample did reveal a pattern, which can be summarised as follows: Measurements taken from the axial direction calculated the lowest TC results, which are related to the microstructure of balsa. Since balsa is cellular by nature, vessels run along the axial direction, making it difficult for heat to flow outwards across the radial and tangential grain. When the balsa end-grain samples were measured in the tangential and radial direction, the values were noticeably higher because the heat flow could travel through the vessels along the axial grain.
Balsa is exported mostly as end-grain panels to international markets. This balsa configuration is suitable for current commercial markets to optimise its strength properties in the axial direction for applications that are exposed to compressive forces. This current end use configuration does not optimise balsa’s greatest thermal performance. Although balsa as an end-grain panel has a TC range from 0.0435 W/mK to 0.0665 W/mK, there is the opportunity for PNG balsa processors to consider producing perpendicular-grain panels for insulation markets. These alternative panels have the potential to reach TC values of 0.0381 W/mK. This is a potential design opportunity for PNG balsa producers to consider entering new commercial markets to promote PNG-grown balsa. While the data presented in this study identify this opportunity, it must be stated that without further design exploration and the generation of design products and applications that utilise balsa as a primary material, PNG balsa processors should not change their current manufacturing processes. Further tests are also needed to determine the TC of balsa at a range of different temperatures to simulate various conditions that balsa insulation would be exposed to in its service life. This would produce a database of highly accurate TC values for specific contexts when designing new products and applications, in particular for residential and non-residential buildings.
CONCLUSIONS
- This study determined the TC of balsa grown in PNG plantations. Variables that affected the TC results in the study were the direction of the grain and the density of the sample. The TC range of balsa was determined by geometric mean values across all samples from different densities. The calculated values were in the range of 0.0381 W/mK to 0.0665 W/mK, which is low by comparison to current materials used as insulators in the construction industry.
- The TC of balsa as an end-grain panel can range from 0.0435 W/mK to 0.0665 W/mK. Perpendicular-grain panels, however, have the potential to reach TC values of 0.0381 W/mK.
ACKNOWLEDGMENTS
A special thank-you to Anson Antriasian and David Belton from the University of Melbourne, School of Earth Sciences, Parkville, Australia, for their assistance and use of their equipment in conducting all TC tests with the authors. Many thanks to the PNG Balsa Company Ltd. for supplying the balsa used for testing.
REFERENCES CITED
Abdou, A. A., and Budaiwi, I. M. (2005). “Comparison of thermal conductivity measurements of building insulation materials under various operating temperatures,” Journal of Building Physics 29(2), 171-184. DOI: 10.1177/1744259105056291
ASTM D5334. (2008). “Standard test method for determination of thermal conductivity of soil and soft rock by thermal needle probe procedure, ASTM International, West Conshohocken, PA.
Bootle, K. R. (1983). Wood in Australia. Types, Properties and Uses, McGraw-Hill, NSW, Australia. 443 pp.
Cai, L., and Garrahan, P. (2006). “Inverse determination of thermal conductivity in frozen lumber,” Wood Science and Technology 40(8), 665-672. DOI: 10.1007/s00226-006-0079-4
Cha, J., Seo, J., and Kim, S. (2012). “Building materials thermal conductivity measurement and correlation with heat flow meter, laser flash analysis and TCi,” Journal of Thermal Analysis and Calorimetry 109(1), 295-300. DOI: 10.1007/s10973-011-1760-x
Faouel, J., Mzali, F., Jemni, A., and Nasrallah, S. (2012). “Thermal conductivity and thermal diffusivity measurements of wood in the three anatomic directions using the transient hot-bridge method,” Special Topics & Reviews in Porous Media 3(3), 229-237. DOI: 10.1615/SpecialTopicsRevPorousMedia.v3.i3.50
Glass, S. V., and Zelinka, S. L. (2010). “Moisture relations and physical properties of wood,” in: Wood Handbook: Wood as an Engineering Material, Chapter 4, Forest Products Laboratory, United States Department of Agriculture Forest Service, Madison, WI., pp. 1-19.
Gusamo, B. K., Semeli, M., and Ozarksa, B. (2013). “Trial processing and lamination of balsa wood as an insulation board for ceiling construction in buildings,” African Journal of Agriculture 8(29), 3888-3892. DOI:10.5897/AJAR12.733
Matias, L., Santos, C., Reis, M., and Gil, L. (1997). “Declared value for the thermal conductivity coefficient of insulation corkboard,” Wood Science and Technology 31(5), 355-365. DOI: 10.1007/BF01159154
Midgley, S., Blyth, M., Howcroft, N., Midgley, D., and Brown, A. (2010). Balsa: Biology, Production and Economics in Papua New Guinea (Report 73), ACIAR, Canberra. 98p.
Pelaez-Samaniego, M., Yadama, V., Lowell, E., and Espinoza-Herrera, R. (2013). “A review of wood thermal pretreatments to improve wood composite properties,” Wood Science and Technology 47(6), 1285-1319. DOI: 10.1007/s00226-013-0574-3
TK04 Thermal Conductivity Meter. (2011). User’s Manual Version 5.0, Teka, Berlin. 135p.
Yapici, F., Ozcifci, A., Esen, R., and Kurt, S. (2011). “The effect of grain angle and species on thermal conductivity of some selected wood species,” BioResources 6(3), 2757-2762.
Article submitted: June 6, 2014; Peer review completed: July 23, 2014; Revised version received and accepted: July 30, 2014; Published: August 5, 2014.