
Abstract
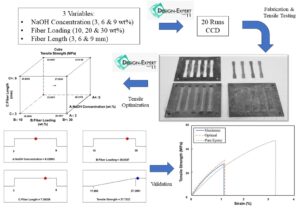
Kenaf fiber is gaining prominence because of its ability as a natural-based reinforced material in advanced composites. However, kenaf contains a hygroscopic natural waxy substance that covers the fiber layer, providing a low surface tension and preventing strong bonding with the polymer matrix. The goal of this study is to optimize the blending parameters of kenaf fiber-reinforced epoxy composites by alkali treatment concentration, length, and fiber-matrix loading using central composite design. The maximum tensile strength was obtained at 6.03 wt% of NaOH concentration, fiber loading of 26.02 wt%, and fiber length at 7.39 mm, which showed a strong correlation between experimental and predicted values. The analysis of variance function model indicated that fiber length, sodium hydroxide concentration, and fiber loading all play important roles in mechanical properties of composites. Based on the fracture surface observations, kenaf fiber composite strength was closely related to bonding at fiber-matrix interfaces. The most common failure modes in the samples were voids, matrix fracture, fiber breakage, weak bonding, and fiber pull-out.
Download PDF
Full Article
Central Composite Design for Optimization of Kenaf-Reinforced Epoxy Composite Bonding Performance
Mohamad Ikhwan Ibrahim,a Noremylia Mohd Bakhori,a Ariff Farhan Mohd Nor,a Roslina Mohammad,a Sa’ardin Abd Aziz,a Mohd Yusof Md Daud,a Hoo Tien Nicholas Kuan,b Melbi Mahardika,c and Mohamad Zaki Hassan a,*
Kenaf fiber is gaining prominence because of its ability as a natural-based reinforced material in advanced composites. However, kenaf contains a hygroscopic natural waxy substance that covers the fiber layer, providing a low surface tension and preventing strong bonding with the polymer matrix. The goal of this study is to optimize the blending parameters of kenaf fiber-reinforced epoxy composites by alkali treatment concentration, length, and fiber-matrix loading using central composite design. The maximum tensile strength was obtained at 6.03 wt% of NaOH concentration, fiber loading of 26.02 wt%, and fiber length at 7.39 mm, which showed a strong correlation between experimental and predicted values. The analysis of variance function model indicated that fiber length, sodium hydroxide concentration, and fiber loading all play important roles in mechanical properties of composites. Based on the fracture surface observations, kenaf fiber composite strength was closely related to bonding at fiber-matrix interfaces. The most common failure modes in the samples were voids, matrix fracture, fiber breakage, weak bonding, and fiber pull-out.
DOI: 10.15376/biores.19.1.605-619
Keywords: Central composite design (CCD); Tensile properties; Kenaf fiber composite; Response surface method; Natural fiber composite
Contact information: a: Razak Faculty of Technology and Informatics, Universiti Teknologi Malaysia, 54100 Kuala Lumpur, Malaysia; b: Department of Mechanical and Manufacturing Engineering, Faculty of Engineering, Universiti Malaysia Sarawak, Kota Samarahan 94300, Malaysia; c: Research Center for Biomass and Bioproducts, National Research and Innovation Agency (BRIN), Cibinong Science Center, 16911 Bogor, Indonesia; *Corresponding author: mzaki.kl@utm.my
GRAPHICAL ABSTRACT

INTRODUCTION
A natural fiber can be categorized based on animal, plant, or mineral resources. Today, the public awareness of the usage of natural fiber is enormous, following its ability to reduce environmental issues (e.g., they are biodegradable, renewable, sustainable, and abundantly available) (Karthikeyan et al. 2013). In addition, the consolidation of plant-based fibers with synthetic polymer offers good mechanical properties, high stiffness, low cost, and is lightweight. The wide application of natural fiber composite in the various manufacturing composite industries is a good demonstration of this affirmation due to their strength and durability (Kuan et al. 2022). A composite is a mixture of two or more individual materials with notably different physical or chemical characteristics. When combined, it forms a new material with properties that can possibly be superior to their constituent behavior. Reinforcing fibers have stiffness in their longitudinal direction, and they can be synthetic fiber, such as carbon, glass, and natural fiber. Contrastingly, the matrix works as a binder that holds the fiber in one place and eventually acts as a medium for transferring external forces to reinforce the fiber.
Natural fibers offer the most environmentally friendly alternative to synthetic fibers (Khan et al. 2020). Like other natural fibers, kenaf is abundant and renewable; it also has low density, is biodegradable, and sustainable. Additionally, kenaf fibers have been promoted as an alternative reinforcement material to replace glass fiber because of their high specific strength, low density, renewability, biodegradability, and sustainability. The tensile strength and modulus of kenaf fibers, which are 223 to 930 MPa and 14.5 to 73 GPa, are equivalent to those of E-glass fibers, which have 1000 MPa and 70 to 76 GPa, respectively (Sapiai et al. 2020). Nevertheless, these cellulosic fibers exhibit certain limitations regarding their thermal and physicomechanical properties. Lack of surface adhesion between two mediums is the fundamental drawback of using kenaf fiber in polymeric resin, leading to subpar qualities in the final biocomposite laminate (Asyraf et al. 2020). Moreover, Jaafar et al. (2018) posit that the inadequate interfacial adhesion can be attributed to the presence of impurities on the morphology of the fiber surface, which results in an irregular topography. The presence of pectin, lignin, and hemicellulose in the fiber is responsible for its poor compatibility with the polymer matrix. According to Krishna and Kanny (2016), the impurities in concern are formed by hydroxyl groups, which give the kenaf fiber its hydrophilic characteristics. Due to the hydrophobic nature of most polymer resins, such as epoxy and polyester (PE), the ability to make effective chemical bonds between kenaf fibers and these polymers is restricted.
Therefore, several studies have used an alkali treatment as a means of enhancing surface properties to mitigate the incompatibility between fibers and polymers (Kamarudin et al. 2019). The process of alkali treatment, also known as mercerization, introduces new chemical groups that may efficiently infiltrate the fiber matrix and remove a certain quantity of hemicellulose, lignin, oils, and wax that coat the fiber cell wall’s external surface. The introduction of NaOH causes a modification in the fiber, resulting in rougher surfaces that enhance the interlocking of fibers and the uptake of the matrix. Additionally, it leads to an increased contact area between the fiber and the matrix (Bar et al. 2018). Alkali treatment eliminates noncellulosic components in fiber, such as hemicellulose and lignin, resulting in the formation of a close-packed cellulose complex. The close-packed cellulose fibers are interconnected by hydrogen bonding and alkaline treatment, resulting in an increase in fiber crystallinity following the treatment method (Loganathan et al. 2020). Alternatively stated, NaOH treatment increases the number of reactive sites accessible for the ester group in the fibers, allowing the ester group in the polymer to bond with OH groups. The process of crosslinking improved the structural integrity of the fibers, resulting in increased strength and enhanced load-bearing capacity inside the matrix.
Central composite design (CCD) is one of the classes under response surface methodology (RSM), which is widely applied in various experiments for its logic, acceptable design, and excellent outcomes. The CCD has advantages over traditional methods. For instance, it requires fewer experiments and experimental data; thus the analysis takes less time and reduces expenses (Dixit and Yadav 2019). Additionally, it offers accurate estimates of the number of runs, is more resilient, and eliminates missed runs or mismeasured responses compared with other RSM methods such as the Box-Behnken Design (BBD). CCD, on the other hand, deals with extreme points, and the axial points are inserted at a specific distance from the design’s center, known as the alpha value. Furthermore, the CCD method requires a higher number of iterations compared to alternative RSMs, and the selection of the alpha value can significantly impact the design’s quality. However, extreme points are possible in composite fabrication because the parameter can be specified prior to fabrication. Hence, in this study, CCD was deemed more advantageous than BBD attributed to its superior accuracy and efficiency, as validated by a previous study that compared these two RSMs (Boateng and Yang 2021). According to BBD, this approach does not use a cubic vertex that defines the upper and lower limits for each variable (Hassan et al. 2020). Instead, all tested points are confined within a specified range. Consequently, the accuracy of the starting and ending points of the interval is lower compared to the other points. Thus, BBD is more suitable for conducting tests that are out-of-range tests of conceptual or physical restrictions, in which there is no restriction on composite fabrication’s parameter. It has also been shown that CCD can be used to model and optimize natural fiber and biocomposite structures (Salih et al. 2022).
In previous work, the optimization parameter of kenaf/epoxy composite often uses the BBD. Moreover, it appears from the aforementioned investigations that numerous research has been conducted on the effects of fiber length, fiber loading, and chemical treatment on the kenaf fiber-reinforced epoxy composites. This concept has recently been challenged by focusing on varying only one parameter and the other parameter being fixed to assess the potential relationships between parameters. Therefore, a RSM tool is recommended for predicting the connections between changing parameters. However, limited works were investigated the simultaneous effect of these three parameters using another RSM, specifically CCD. The optimization of combining three input variables, including fiber length, fiber loading, and chemical treatment, of kenaf fiber-reinforced epoxy using CCD has never been explored. The optimum combination of this fiber-matrix blending is novel. This study aims to enhance the mechanical performance by determining the optimum blending parameter of kenaf fiber reinforced epoxy composites, such as alkaline concentration, fiber loading, and fiber length of kenaf fiber-reinforced epoxy composites using CCD.
EXPERIMENTAL
Materials
In this study, kenaf fiber (Hibiscus cannabinus) harvested in Kelantan (Malaysia) was used. It was purchased from Lembaga Kenaf and Tembakau Negara (LKTN, Kota Bharu, Kelantan, Malaysia). In general, the diameter of fiber was approximately 60 to 110 μm. The fibers were initially treated using sodium hydroxide (NaOH) and glacial acetic acid purchased from Orioner Sdn Bhd (Cyberjaya, Selangor, Malaysia). The alkali treatment was referred to Ismail et al. (2021), in which involved subjecting the kenaf fibers to a NaOH solution for 24 h at room temperature, following the CCD runs parameter specifications. The weight ratio of kenaf fibers to the solution was 1:20. The fibers were thereafter submerged in tap water with a concentration of 1 wt% glacial acetic acid to balance the excess of NaOH. This was followed by a 30 min immersion in distilled water. Subsequently, the kenaf fibers were subjected to a rinsing process using distilled water until the pH level reached 7. Following this, the fibers were dried in an oven at a temperature of 80 °C for a duration of 6 h prior to the composite fabrication. A moisture analyzer (Ohaus Model MB25, Ohaus Corporation, Parsippany, NJ, USA) was used to ensure that the moisture content of the fiber was less than 7%. Then, the dried fiber was chopped using a crusher machine (Cheso Model N3, Loyang, Singapore). A multi-stage sieve that was attached to a rotational shaker model BS410/1986 (Endecots Ltd.) was utilised to achieve certain fiber length. This shaker operated at 275 rpm for 45 min.
Meanwhile, the epoxy resin (D.E.R 331) and hardener (JOINTMINE 901-3S) were mixed to produce the adhesive resin in weight ratio of 2:1. The properties of materials used in this study are given in Table 1. The tensile specimen of kenaf fiber-reinforced epoxy was fabricated via the moulding process. A mild steel mould was manufactured to fabricate the composite tensile specimen according to the ASTM D638 (2014) standard. The mould consisted of three main components: the steel top, injector plate, and base. To fabricate samples, a mould release agent was initially spread on the surface and inner parts of the mould. Then, a Teflon sheet with the same dimensions as the mould cavity was adhered. After the composite mixture was loaded, the base and injector plate were tightened. The mould was fastened with four screws before being placed in a hot press and heated for 20 min at a temperature of 70 °C. The mould was then removed and kept at room temperature for 8 h to cure. Finally, the specimens were removed and visually inspected.
Table 1. Thermophysical and Mechanical Properties of Kenaf Fiber

Design experiment
In this study, a central composite design (CCD) was used to determine the optimum compounding parameters of kenaf fiber reinforced epoxy composites. Table 2 shows the real, coded, and input variables used for the development of the CCD at several ranges of NaOH concentration (A), fiber loading (B), and fiber length (C). These design parameters were generated using Design Expert Software version 11.1.0 (Stat-Ease, Minneapolis, MN, USA).
Table 2. Real and Coded Variable Chosen for the Construction of the CCD

Tensile test
The tensile test for kenaf fiber reinforced epoxy composite was conducted according to ASTM D638 (2014). It was examined using the universal testing machine (Shimadzu AGS-X, 20kN, Kyoto, Japan) at a 1 mm/min crosshead displacement rate. To determine the mechanical properties the stress-strain traces were recorded. Three samples for each of the experimental design were examined.
Scanning electron microscope
The structure morphology image of kenaf reinforced epoxy composite was taken by using the scanning electron microscopy (SEM) machine (JOEL JSM-7800F, Tokyo, Japan). SEM is an essential tool to observe fine structural morphology of nanomaterials with sub-1 nm resolution. An appropriate size specimen was inserted in the chamber and generally mounted rigidly on a specimen stub. To observe the morphologies of fiber, SEM was operated at 2 kV.
RESULTS AND DISCUSSION
The value of tensile strength was chosen as a response to the system. Twenty replicate samples were designed based on CCD and corresponded to tensile strength response according to Eq. 1 (Bhattacharya 2021),
N = 2n + 2n + nc (1)
where N is the total number of experimental runs, n is the number of factors, and k is the number of replicates samples at the center point. The trial runs and input parameters were proposed by software shown in Table 3. The experimental run was orderly randomized to reduce systematic error.
Analysis of variance analysis for fitting the model
The analysis of variance (ANOVA) quadratic function for tensile strength of the three selected variables is indicated in Eq. 2, as follows,
Tensile Strength = 27.01 + 0.49A + 2.07B + 0.4C – 1.65AB – 0.51AC – 0.51BC – 1.69A2 – 1.3B2 – 0.39C2 (2)
where A, B, and C are coded for NaOH concentration, fiber loading, and fiber length, respectively.
Table 5 shows the result of the tensile strength for three parameters following ANOVA analysis. The result found that all parameters of the models were significant, as shown by the P-value of the A, B, C, AB, AC, BC, A², and B², which are all below 0.05. As shown from the table, the lack of fit value was non-significant and indicates that the model fit well with the experimental data.
Model adequacy was also assessed to ensure the design model fit the actual results. Here, the coefficient of determination (R2 = 0.96) for this model was closer to 1, explaining the adequacy of this model. As seen in Table 4, the difference between adjusted R2 and predicted R2 was less than 0.2, and adequate precision was more than four, indicating that this quadratic polynomial model was statistically accurate. Furthermore, a larger F-value and smaller P-value show significance on the response variable.
Table 3. Actual and Predicted of Tensile Strength

Table 4. ANOVA Results for the Quadratic Model

Figure 1(a) demonstrates the relationship between the normal probability plot versus residuals distribution. All the data points were close to a straight line, which suggests that the error was normally distributed. Moreover, the typical studentized residual versus experiment run curve for the yield strength is shown in Fig. 1(b). Again, all the residual values illustrate the randomized scatter value and an unusual pattern of tensile strength. However, this model was highly adequate and located within the lower-higher limit and near-zero axis. All data were located between +4 and -4. Similar findings were reported by Wu et al. (2012). They mentioned that the relationship between the corresponding data of this model was not an apparent problem between the residual value and constant assumption in all run numbers.
Figure 1(c) represents the association between studentized residues and the expected tensile strength value. Here, the residues were uniformly scattered around the “0” line on the y-axis. This can suggest that a high validity for the estimation value was developed from the regression model. The remaining data points were evenly distributed between +3 and 3, demonstrating the quadratic function model’s compatibility with the tensile strength results (Montgomery and Cahyono (2022)). A similar finding was mentioned by Chowdhury et al. (2016). The linear plot of prediction and experimental values for kenaf epoxy composite tensile strength is presented in Fig. 1(d). All scatter points were nearly gathered along the diagonal line, suggesting a strong correlation between the experimental data and the predicted values. This plot validated the model’s adequacy, in which most of the data points were clustered close to the regression line (Akubue et al. 2015). This finding was also in good agreement with the findings by Qiu et al. (2014), who stated that the nearest data points are on the reference line and have the highest reliability for the model.

Fig. 1. (a) Normal probability versus residual, (b) externally residuals versus the experimental run, (c) studentized residual versus predicted, and (d) predicted versus actual results plots for the tensile strength of kenaf epoxy composites
The contour and response surface between A, B, and C on tensile strength
Figure 2 exhibits the contour plots of three-dimensional (3D) and two-dimensional (2D) responses for NaOH concentration and fiber loading on tensile strength behavior. As shown in Fig. 2(a), the 3D surface plot increased in fiber loading when tensile strength increased. However, minimum strength was recorded at the combination of 10 wt% of fiber loading and 3 wt% of NaOH concentration. Figure 2(b) shows that the maximum stress achieved at 30 wt% of fiber loading and 5.5 wt% NaOH concentration. Furthermore, tensile strength also increased with increasing NaOH concentration due to better interlocking between the fiber and matrix. The optimum combination of concentrations of alkali treatment and fiber loadings improved biocomposite tensile strength due to impressive bonding interaction. Akhtar et al. (2016) also reported that this phenomenon happened due to wax removal, which makes stable bonds between the fiber and matrix.

(a) (b)
Fig. 2. The contour of (a) 3D response and (b) 2D for the interaction of NaOH concentration and fiber loading on tensile strength

(a) (b)
Fig. 3. The contour of (a) 3D response and (b) 2D for the interaction of NaOH concentration and fiber length on tensile strength
Figure 3(a) indicates a view of the interaction between NaOH concentration (wt%) and fiber length (mm) on the tensile behavior. The 3D plot shows the maximum tensile strength achieved at NaOH concentration of 6 wt% and fiber length of 7.4 mm. However, the tensile strength decreased after reaching 6 wt% for NaOH concentration and fiber length (Fig. 3(b)).
The lowest value was reported by Karthikeyan et al. (2013), whereby the tensile strength increase was followed by increased NaOH concentrations, which was up to 4 wt% and fiber lengths up to 30 mm with any further increase in NaOH concentration that caused the tensile strength to be weak.
Moreover, Fig. 4 shows a contour view for various fiber loadings (wt%) and fiber length (mm), which explains the interaction following a quasi-static tensile test. The 3D surface plot explains that tensile strength increased with increasing fiber length and fiber loading, as illustrated in Fig. 4(a). The maximum tensile strength recorded a combination of 9 mm fiber length and 30% fiber loading (Fig. 4(b)). Mechanical properties can enhance significantly with increased fiber length and fiber loading. This finding indicated that good adhesion between natural fibers and polymer matrices can be achieved by manipulating parameters, such as fiber length and fiber loading, to optimal tensile strength parameters (Kuan et al. 2022).

(a) (b)
Fig. 4. The contour of (a) 3D response and (b) 2D for the interaction of fiber length and fiber length on tensile strength
Optimization of tensile strength variable
Typical optimization cube and ramp results are seen in Fig. 5. Here, the desirability value correlated between the optimum tensile strength and input variables from zero and outside the limits to where the goal was used. The most efficient parameter value was to choose desirability values equal to unity at an optimum value to all response factors (Chamoli 2015). As shown in Fig. 6, the optimal operating conditions for tensile strength were the fiber length (A) of 7.39 mm and the NaOH material (B) of 6.03 wt%, and a fiber loading (C) of 26.02 wt%. According to the CCD results, the predicted tensile strength was 27.7 MPa.

Fig. 5. Typical ramp for numerical optimization of NaOH concentration, fiber loading, and fiber length
Figure 6 shows the cube of optimization selected according to the desirability value of this study. According to CCD analysis, the predicted tensile strength was 27.73 MPa. The tensile tests were performed under the suggested optimization conditions to confirm the validity of the investigation.

Fig. 6. The optimization cube of CCD
Validation and verification of CCD model
Figure 7 illustrates the stress-strain curve for pure epoxy, optimum conditions, and maximum CCD runs’ tensile properties (run number 8) for kenaf fiber-reinforced epoxy composites. This experiment was used to verify the design model and optimized conditions. The maximum tensile strength was 27.3 MPa with a strain of 1.29%. Based on the tensile test, and with the addition of NaOH, compounding occurs at fiber length and fiber loading during optimal conditions, where an increase in the mechanical properties of the kenaf fiber-reinforced epoxy composites and the tensile strength of 29.0 MPa was recorded. Additionally, comparing the tensile properties of the maximum selected from the CCD run and the optimum conditions kenaf reinforced epoxy composite revealed that the latter had improved by approximately 6.2%. The results indicated that the percentage error between the measured and predicted values was well within 4.5%, suggesting that model adequacy was reasonable for approximately 99% of the prediction interval.

Fig. 7. Stress-strain curve for pure epoxy, optimal, and maximum tensile properties for kenaf fiber-reinforced epoxy composites
Surface morphology
Figure 8 shows the tensile fractography of the (a) optimum and (b) maximum kenaf-reinforced composites. As shown in the figures, void contents, matrix fracture, fiber breakage, weak bonding, and fiber pull-out appeared to be the main reasons for composite failure. Proper matrix/fiber bonding between the surfaces can be suggested to improve the tensile properties of composites due to the optimum chemical treatment (Fig. 8 (a)). The outcome shows that the tensile strength can be increased by combining the ideal fiber length, fiber loading, and alkaline treatment. In addition, it is well known that alkaline treatment cleans impurities out of fibers and enhances surface roughness to improve fiber-polymer matrix interlock (Fuxiang 2011). It also removes the pectin and lignin, which increases the cellulose exposure on the kenaf fiber surface, thus increasing the number of possible reaction sites and contact areas between kenaf fibers and resin (Rokbi et al. 2011). In contrast, the fracture mechanisms of maximum kenaf/epoxy composites were dominated by void defects (Fig. 8(b)). It is believed that reducing matrix dominated properties lowers composite tensile strength and modulus. Void formation may serve as a fracture initiation location, permit moisture penetration, and worsen the anisotropic of the composites. Matrix fracture, fiber breakage, and weak matrix bonding were also observed from the fracture surface of the maximum composites, which may affect the tensile strength properties.

Fig. 8. The morphological fracture surfaces of (a) optimum and (b) maximum tensile properties of kenaf reinforced epoxy composite
As the surface modification by alkaline treatment did not appear to contribute to enhancing the fiber-matrix bonding so much, there are other possible future works that can be done. For instance, a coupling agent such as silane can be used for fiber surface modification as an alternative. Chemical treatment can be effective in diminishing the quantity of cellulose hydroxyl groups, hence enhancing the compatibility between the fiber and matrix. When silane chemistry is employed, the presence of moisture can cause the hydrolysable alkoxyl group to create chemical compounds known as silanols. The silanol undergoes a chemical reaction with the hydroxyl group present in the fiber, resulting in the formation of a covalent link with the cell wall. Therefore, the hydrocarbon chains are restricted due to the expansion of the fiber, resulting in the formation of an interconnected structure by the dissemination of hydrocarbon chains with resin. Besides, acetylation is a widely recognized technique performed by several researchers. In this technique, cellulosic fiber is plasticized via esterification, a well-known chemical alteration. This treatment reduces the quantity of hydroxyl groups that are accessible for interacting with water molecules. Therefore, adequate acetylation significantly decreases the quantity of hydroxyl groups in order to enhance the compatibility between the fiber and matrix. Another method is to employ the grafting approach using polymethyl methacrylate (PMMA) to enhance the interfacial surface of kenaf fiber. The process reduces the hydroxyl group content in the kenaf fiber, facilitating stronger crosslinking with the polymer resin and promoting a hydrophobic interface. This is achieved by the PMMA functional groups chemically modifying the polar hydroxyl groups to form covalent bonds.
CONCLUSIONS
- In this study, the mechanical properties of kenaf-reinforced epoxy composites were investigated and optimized by using the central composite design (CCD) approach. According to the analysis of variance (ANOVA) function model, fiber loading was the major influence, followed by NaOH concentration and fiber length, respectively, and all have significant roles in tensile strength. The tensile characteristics were improved by the interaction between fiber loading, fiber length, NaOH-fiber loading, and NaOH-fiber length.
- The predicted optimum parameters for maximum tensile strength (28.3 MPa) were NaOH content of 6.03 wt%, fiber loading of 26.0 wt%, and fiber length of 7.39 mm. The results demonstrated a high correlation between experimental data and predicted values.
- It was discovered that the main failure mechanisms were voids, matrix fracture, fiber breakage, inadequate bonding, and fiber pull-out. Natural fiber composite strength was found to be closely related to bonding at fiber-matrix interfaces.
ACKNOWLEDGMENTS
The authors are grateful for the support of Universiti Teknologi Malaysia for providing the Grant Postdoctoral (PDRU) Q.K130000.21A2.06E96 and the UTMER Q.K130000.3856.20J97 for this study.
REFERENCES CITED
Ahmad, Z., Iis, S., Halim, Z., and Sarifuddin, N. (2011). “Effect of fiber length variations on properties of coir fiber reinforced cement-albumen composite (CFRCC),” IIUM Engineering Journal 12(1), 63-76. DOI: 10.31436/iiumej.v12i1.116
Akhtar, M. N., Sulong, A. B., Radzi, M. K. F., Ismail, N. F., Raza, M. R., Muhamad, N., and Khan, M. A. (2016). “Influence of alkaline treatment and fiber loading on the physical and mechanical properties of kenaf/polypropylene composites for variety of applications,” Progress in Natural Science: Materials International 26(6), 657-664. DOI: 10.1016/j.pnsc.2016.12.004
Akubue, P. C., Igbokwe, P. K., and Nwabanne, J. T. (2015). “Production of kenaf fibre reinforced polyethylene composite for ballistic protection,” International Journal of Scientific & Engineering Research 6(8), 1-7.
Asyraf, M. R. M., Ishak, M. R., Sapuan, S. M., Yidris, N., and Ilyas, R. A. (2020). “Woods and composites cantilever beam: A comprehensive review of experimental and numerical creep methodologies,” Journal of Materials Research and Technology 9(3), 6759-6776. DOI: 10.1016/j.jmrt.2020.01.013
Bar, M., Alagirusamy, R., and Das, A. (2018). “Advances in natural fibre reinforced thermoplastic composite manufacturing: Effect of interface and hybrid yarn structure on composite properties,” Advances in Natural Fibre Composites: Raw Materials, Processing and Analysis, Springer International Publishing 99-117. DOI: 10.1007/978-3-319-64641-1_10
Bhattacharya, S. (2021). “Central composite design for response surface methodology and its application in pharmacy,” in: Book of Response Surface Methodology in Engineering Science, P. Kayaroganam (ed.), InTechOpen, Online, pp. 1-19. DOI: 10.5772/intechopen.95835
Boateng, I. D., and Yang, X. M. (2021). “Process optimization of intermediate-wave infrared drying: Screening by Plackett–Burman; comparison of Box-Behnken and central composite design and evaluation: A case study,” Industrial Crops and Products 162, article 113287. DOI: 10.1016/j.indcrop.2021.113287
Chamoli, S. (2015). “ANN and RSM approach for modeling and optimization of designing parameters for a V down perforated baffle roughened rectangular channel,” Alexandria Engineering Journal 54(3), 429-446. DOI: 10.1016/j.aej.2015.03.018
Chowdhury, Z. Z., Yehye, W. A., Julkapli, N. M., Al Saadi, M. A. H., and Atieh, M. A. (2016). “Application of graphitic bio-carbon using two-level factorial design for microwave-assisted carbonization” BioResources 11(2), 3637-3659. DOI: 10.15376/biores.11.2.3637-3659
Dixit, S., and Yadav, V. L. (2019). “Optimization of polyethylene/polypropylene/alkali modified wheat straw composites for packaging application using RSM,” Journal of Cleaner Production 240, article ID 118228. DOI: 10.1016/j.jclepro.2019.118228
Fuxiang, C. (2011). “Progress in interfacial modification methods of natural fiber composites,” Materials Review Online.
Hassan, M. Z., Roslan, S. A., Sapuan, S. M., Rasid, Z. A., Mohd Nor, A. F., Md Daud, M. Y., Dolah, R., and Mohamed Yusoff, M. Z. (2020). “Mercerization optimization of bamboo (Bambusa vulgaris) fiber-reinforced epoxy composite structures using a Box–Behnken design,” Polymers 12(6), 1367. DOI: 10.3390/polym12061367
Ismail, N. F., Mohd Radzuan, N. A., Sulong, A. B., Muhamad, N., and Che Haron, C. H. (2021). “The effect of alkali treatment on physical, mechanical and thermal properties of kenaf fiber and polymer epoxy composites,” Polymers 13(12), 2005. DOI: 10.3390/polym13122005zz
Jaafar, C. N. A., Rizal, M. A. M., and Zainol, I. (2018). “Effect of kenaf alkalization treatment on morphological and mechanical properties of epoxy/silica/kenaf composite,” International Journal of Engineering and Technology 7, 258-263. DOI: 10.14419/ijet.v7i4.35.22743
Kamarudin, S. H., Abdullah, L. C., Aung, M. M., and Ratnam, C. T. (2019). “Mechanical and physical properties of kenaf-reinforced poly(lactic acid) plasticized with epoxidized Jatropha oil,” BioResources 14(4), 9001-9020. DOI: 10.15376/biores.14.4.9001-9020
Karthikeyan, A., Kulendran, B., and Kalpana, A. (2013). “The effect of sodium hydroxide treatment and fiber length on the tensile property of coir fiber-reinforced epoxy composites,” Science and Engineering of Composite Materials 21(3), 315-321. DOI: 10.1515/secm-2013-0130
Khan, A., Asiri, A. M., Jawaid, M., Saba, N., and Inamuddin (2020). “Effect of cellulose nano fibers and nano clays on the mechanical, morphological, thermal and dynamic mechanical performance of kenaf/epoxy composites” Carbohydrate Polymers 239, article ID 116248. DOI: 10.1016/j.carbpol.2020.116248
Krishna, K. V., and Kanny, K. (2016). “The effect of treatment on kenaf fiber using green approach and their reinforced epoxy composites,” Composites Part B: Engineering 104, 111-117. DOI: 10.1016/j.compositesb.2016.08.010
Kuan, H. T. N., Tan, M. Y., Hassan, M. Z., and Zuhri, M. Y. M. (2022). “Evaluation of physico-mechanical properties on oil extracted ground coffee waste reinforced polyethylene composite,” Polymers 14(21), article 4678. DOI: 10.3390/polym14214678
Loganathan, T. M., Sultan, M. T. H., Ahsan, Q., Jawaid, M., Naveen, J., Shah, A. U. M., and Hua, L. S. (2020). “Characterization of alkali treated new cellulosic fibre from Cyrtostachys renda,” Journal of Materials Research and Technology 9(3), 3537-3546. DOI: 10.1016/j.jmrt.2020.01.091
Montgomery, D., and Cahyono, St. (2022). Design and Analysis of Experiments, 9th Ed., John Wiley & Sons, Inc., Hoboken, NJ, USA.
Nadlene, R., Sapuan, S. M., Jawaid, M., Ishak, M. R., and Yusriah, L. (2018). “The effects of chemical treatment on the structural and thermal, physical, and mechanical and morphological properties of roselle fiber-reinforced vinyl ester composites,” Polymer Composites 39(1), 274-287. DOI: 10.1002/pc.23927
Nor, A. F. M., Hassan, M. Z., Rasid, Z. A., Aziz, S. A. A., Sarip, S., and Md Daud, M. Y. (2021). “Optimization on tensile properties of kenaf/multi-walled CNT hybrid composites with Box-Behnken design,” Applied Composite Materials 28, 607-632. DOI: 10.1007/s10443-021-09879-x
Qiu, P., Cui, M., Kang, K., Park, B., Son, Y., Khim, E., Jang, M., and Khim, J. (2014). “Application of Box-Behnken design with response surface methodology for modeling and optimizing ultrasonic oxidation of arsenite with H2O2,” Central European Journal of Chemistry 12(2), 164-172. DOI: 10.2478/s11532-013-0360-y
Rokbi, M., Osmani, H., Imad, A., and Benseddiq, N. (2011). “Effect of chemical treatment on flexure properties of natural fiber-reinforced polyester composite,” Procedia Engineering 10, 2092-2097. DOI: 10.1016/j.proeng.2011.04.346
Salih, A. A., Zulkifli, R., and Azhari, C. H. T (2022). “Tensile properties of single cellulosic bamboo fiber (Gigantochloa scortechinii) using response surface methodology,” Journal of Natural Fibers 19(1), 359-368. DOI: 10.1080/15440478.2020.1745117
Sapiai, N., Jumahat, A., Jawaid, M., Midani, M., and Khan, A. (2020). “Tensile and flexural properties of silica nanoparticles modified unidirectional kenaf and hybrid glass/kenaf epoxy composites,” Polymers 12(11), article 2733. DOI: 10.3390/polym12112733
Wu, L., Yick, K.-l., Ng, S.-p., and Yip, J. (2012). “Application of the Box–Behnken design to the optimization of process parameters in foam cup molding,” Expert Systems with Applications 39(9), 8059-8065. DOI: 10.1016/j.eswa.2012.01.137
Article submitted: July 10, 2023; Peer review completed: November 4, 2023; Revised version received and accepted: November 21, 2023; Published: November 30, 2023.
DOI: 10.15376/biores.19.1.605-619