
Abstract
In order to rapidly identify internal damage levels accurately in ancient wood components, stress wave detection technology was used to perform simulated damage tests on pine specimens. Based on the detected wave velocity data, the diameter of the specimen, the attenuation coefficient, and the ratio of the wave velocities on the four paths were selected as the discriminant factors for identifying the level of internal damage in the specimens. A case-based reasoning method for discriminating internal damage levels in ancient wood components based on fuzzy similarity priority was proposed. A fuzzy similarity priority relationship between the target case and the source case was established. By introducing the idea of variable weights, the weight of each discriminant factor was determined via the “penalize-excitation” variable weight function. The comprehensive similarity sequences between the target case and the source case were obtained. The source case that was most similar to the target case was used to determine the damage level of the target case. The results showed that this method can quickly and accurately identify the damage levels in ancient wood components, which provides a new method for the safe evaluation of ancient wood buildings.
Download PDF
Full Article
A Case-Based Reasoning Method for Discriminating Damage Levels in Ancient Wood Components Based on Fuzzy Similarity Priority
Ziyi Wang,a,b Donghui Ma,a,b,c Wei Wang,a,b,* Wei Qian,a,c Xiaodong Guo,a,b,c Junhong Huan,d and Zhongwei Gao a,b
In order to rapidly identify internal damage levels accurately in ancient wood components, stress wave detection technology was used to perform simulated damage tests on pine specimens. Based on the detected wave velocity data, the diameter of the specimen, the attenuation coefficient, and the ratio of the wave velocities on the four paths were selected as the discriminant factors for identifying the level of internal damage in the specimens. A case-based reasoning method for discriminating internal damage levels in ancient wood components based on fuzzy similarity priority was proposed. A fuzzy similarity priority relationship between the target case and the source case was established. By introducing the idea of variable weights, the weight of each discriminant factor was determined via the “penalize-excitation” variable weight function. The comprehensive similarity sequences between the target case and the source case were obtained. The source case that was most similar to the target case was used to determine the damage level of the target case. The results showed that this method can quickly and accurately identify the damage levels in ancient wood components, which provides a new method for the safe evaluation of ancient wood buildings.
Keywords: Ancient wood components; Stress wave; Damage level; Case-based reasoning; Fuzzy similarity priority
Contact information: a: Faculty of Architecture, Civil and Transportation Engineering, Beijing University of Technology, Beijing 100124, China; b: Key Scientific Research Base of Safety Assessment and Disaster Mitigation for Traditional Timber Structure (Beijing University of Technology), State Administration for Cultural Heritage, Beijing 100124, China; c: Beijing Engineering Research Center of Historic Buildings Protection, Beijing University of Technology, Beijing 100124, China; d: School of Civil Engineering, Shijiazhuang Tiedao University, Shijiazhuang 050043, China; *Corresponding author: ieeww@bjut.edu.cn
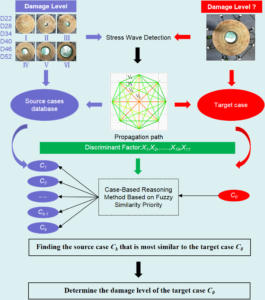
GRAPHICAL ABSTRACT
INTRODUCTION
As an important part of ancient Chinese architecture, wood structures are the crystallization of the sweat and wisdom of ancient people and have high historical, artistic, and scientific value. Since most ancient wooden structures are exposed, long-term erosion from natural sources, e.g., wind, rain, and temperature difference, leads to various sources of decay, e.g., moths, damages, and cracks. This not only brings hidden dangers to the structural safety of the whole ancient building, but it also causes the original and true historical information of ancient buildings to gradually disappear (Li 2015). Therefore, it is necessary to obtain accurate information detailing the damage through appropriate and reasonable detection technology, which is of great importance in evaluating the safety and health status of ancient wood structures.
In recent years, great progress has been made in terms of the detection and protection of ancient wood structures. Among them, as a modern nondestructive testing technology, stress wave testing is widely used in the exploration, analysis, and evaluation of ancient wooden structures. Lee (1965) first used stress wave detection technology to determine the propagation time of lateral stress waves and longitudinal stress waves in wood components, and finally obtained the propagation velocity of the stress waves. Lin and Wu (2013) used the stress wave method to test elm specimens. The results showed that the moisture content of the wood, cracks, size of the holes, and number of holes had significant effects on the expansion parameters and the dynamic elastic modulus. Dackermann et al. (2014) used stress waves to measure structural wood properties and proposed how to evaluate the test results and the health status of the analyzed wood components. Li et al. (2015) selected six variation factors as the discriminant basis to classify the defect grades of wood components based on the stress wave detection data. Morales-Conde and Machado (2017) predicted the elastic modulus of wood via stress wave detection technology considering the spatial variability of wood cross sections. Du et al. (2018) proposed a three-dimensional stress wave imaging method based on TKriging to reconstruct internal defect images of wood. Huan et al. (2018) proposed a stress wave tomography algorithm with a velocity error correction mechanism based on the wave velocity data set measured via stress waves. Finally, a sectional image of the test sample image was generated. Wang et al. (2019) used a stress wave and impedance meter to detect the internal damage of wood components, and induced ordered weighted averaging (IOWA) operators, induced ordered weighted geometric averaging (IOWGA) operators, and induced ordered weighted harmonic averaging (IOWHA) operators were introduced to establish a combined prediction model to predict the internal damage of ancient wood structures. Yue et al. (2019) compared electric resistance tomography and stress wave tomography for decay detection in trees. The results showed that electric resistance tomography was better than stress wave tomography for testing the early stages of decay, while stress wave tomography was more effective for the late stages of decay. Wang et al. (2020) proposed a coupling model of a fuzzy soft set and the Bayesian method to forecast internal defects in wooden structures based on stress waves and an impedance test. Bandara et al. (2021) used time-frequency analysis techniques and stress waves to evaluate health monitoring of timber poles.
According to the existing research, when stress waves are used to detect the damage of ancient wood components, the internal damage is generally judged via analyzing the 2D image. Although the damage can be qualitatively judged, the analysis process is cumbersome and there is not a high degree of accuracy (Xu et al. 2011). There are few scholars who have studied the relationship between the grade of the internal wood damage and the wave velocity of the stress wave. In view of this, the diameter of the specimen, the attenuation coefficient, and the ratio of the wave velocities on the four paths were selected as the discriminant factors for identifying the internal damage levels of specimens. Meanwhile, the concept of fuzzy similarity priority has been introduced to propose case-based reasoning (CBR) for the identification of internal damage in ancient wood components (Zhao and He 2008; He et al. 2009; Zhang et al. 2015). Concretely speaking, the fuzzy similarity priority relationship between the target case and source case is first established for each discriminant factor. Secondly, the weight of each discriminant factor is determined via the “penalize-excitation” variable weight model. Finally, a comprehensive similarity sequence between the target base and source base was obtained to find the source base most similar to the target base. This method can quickly and accurately identify the level of internal damage in ancient wood components.
EXPERIMENTAL
Materials
Pine, which commonly has been used in ancient timber structures, was selected as the test specimen. After visual examination and compression examination, no obvious defects, e.g., joints and cracks, were found in these specimens. The measured average moisture content of the specimens met the requirements of GB/T standard 50005 (2017) and GB/T standard 50329 (2012). Reverse simulation tests were conducted on six specimens, and the simulated type was hollow. The simulated damage ratios were 0, 1/32, 1/16, 1/8, 1/4, and 1/2, respectively. It was assumed that the specimen and the damage shape were a standard complete circle. Table 1 shows the different parameters of the specimens.

Stress Wave Detection
A stress wave detector produced by FAKOOP (Ágfalva, Hungary) was used to test these specimens.

Fig. 1. (a) Stress Wave Detection; (b) Propagation path; and (c) Two-dimensional image
First, eight sensors were selected to place around the specimen using eight steel nails (Fig. 1a). The sensors were connected with a signal amplifier, which could realize wireless connections with a computer via Bluetooth. After tapping each sensor with a hammer three times, each sensor transmitted the wave velocity information to the computer through a signal amplifier. Finally, the 2D image of internal damage of the wood was calculated using the ArborSonic 3D software (Version 5.2.107, FAKOPP, Ágfalva, Hungary) (Fig. 1c). Figure 1b shows the propagation path and the 2D image.
Selection of Discriminant Factors and Damage Level
In this experiment, six intact specimens were first tested to obtain the wave velocity value of each path, which was denoted as the initial comparison value Vm0 (m = a, b, c, d). Then, the wave velocities of the specimens were measured using different damage ratios. Wave velocities can be divided into four categories, according to the propagation path (Fig. 1b). Concretely speaking, the wave velocity values between two adjacent points included Va12, Va23, Va34, Va45, Va56, Va67, Va78, and Va81, of which the mean values were uniformly denoted as V̅a. The wave velocity values of two points with one interval included Vb13, Vb24, Vb35, Vb46, Vb57, Vb68, Vb71, and Vb82, of which the mean values were uniformly denoted as V̅b. The wave velocity values of two points with two intervals included Vc14, Vc25, Vc36, Vc47, Vc58, Vc61, Vc72, and Vc83, of which the mean values were uniformly denoted as V̅c. The wave velocity values of two points with three intervals included Vd15, Vd26, Vd37, and Vd48, of which the mean values were uniformly denoted as V̅d. The attenuation coefficient of the wave velocity (δm) can be calculated according to Eq. 1, (Li 2015).
 (1)
(1)
The ratio of the wave velocity mean values under the four paths were selected as the discriminant factor, which included V̅a/V̅b, V̅a/V̅c, V̅a/V̅d, V̅b/V̅c, V̅b/V̅d, and V̅c/V̅d. Meanwhile, the diameter (D) of the specimen was also taken as a discriminant factor. Therefore, a total of 11 discriminant factors were selected in this model. The classification of the damage level was divided into 6 levels, as shown in Table 2 (Li 2015).

Data Statistics
In this paper, C1 through C36 with known damage levels were taken as training samples to form the source case base. Meanwhile, C01 through C06 with known damage levels were randomly selected as testing samples to form the target case base. The data statistics of the source and target examples are shown in Table 3.

Model Construction
It can be seen in Table 3 that there are many discriminant factors and there is a high degree of nonlinearity between these discriminant factors. It is debatable whether simply relying on a certain discriminant factor to determine the damage level of the target case is suitable. In response to this, this section tentatively proposes a case-based reasoning method for determining the internal damage level of ancient wood components based on a fuzzy similarity priority ratio.
Fuzzy analogy preferred ratio
Suppose A is a set with K objects in the domain U, where A = {a1, a2,···, aK}, ∀ai, aj∈A (i, j=1, 2,···, K). Let ai and aj compare with object a0, then the fuzzy similarity priority relationship R is the following mapping shown in Eq. 2,
 (2)
(2)
where, γij+γji = 0 (i ≠ j, i, j = 1, 2,···, K), γij = 0 (i = 1,2,···, K) (Liu and Zhu 2002).
The above conditions indicate that if ai is compared with itself, there is no so-called priority, and γii = 0. If ai has a priority of γij when compared with aj, then aj has a priority of γji = 1-γij when compared with ai. If γij = 1, it means that ai is much more similar to a0 than aj. If γij = 0.5, it means that ai and aj are the same degree of similarity to a0. Therefore, γij is called the fuzzy similarity priority ratio of ai similar to a0 when compared with aj, and R is called the fuzzy similarity priority relationship.
Representation of the source case and target case
Suppose B = B1 × B2 ×···× Bj ×···× Bn is a n-dimensional factor discrete space and Bj (j = 1,2,···, n) is a finite real number set. The case can be defined as C = (b1, b2,···, bj,···, bn), where, bj ∈ Bj (j = 1, 2,···, n) and bj is the discriminant factor of the source case. Correspondingly, the source case can be expressed as BC = {C1, C2,···, Ck,···, CK}, where Ck ∈ BC (k = 1, 2,···, K) and Ck is the source case. Then, the target case can be expressed as C0 = (b01, b02,···, b0j,···, b0n), where b0j (j = 1, 2,···, n) is the discriminant factor of the target case.
Similarity measure between discriminant factors
Suppose Cp and Cq are the source cases, where, Cp, Cq ∈ BC, Cp ≠ Cq. C0 is the target case, leading to Eq. 3, Eq. 4, and Eq. 5,
Cp = (bp1, bp2,···, bpj,···, bpn) (3)
Cq= (bq1, bq2,···, bqj,···, bqn) (4)
C0 = (b01, b02,···, b0j,···, b0n) (5)
The similarity measurement between the discriminant factors can be expressed by the semantic distance between the discriminant factors, which can be solved using the Hamming distance formula. The semantic distance between the j-th discriminant factor of Cp and the j-th discriminant factor of C0 is expressed as Eq. 6,
D(Cpj, C0j) = |bpj–b0j| (6)
and the semantic distance between the j-th discriminant factor of Cq and the j-th discriminant factor of C0 is expressed as Eq. 7,
D(Cqj, C0j) = |bqj–b0j| (7)
where, D(Cpj, C0j) is the semantic distance between the j-th discriminant factor bpj of Cp and the j-th discriminant factor b0j of C0. D(Cqj, C0j) is the semantic distance between the j-th discriminant factor bqj of Cq and the j-th discriminant factor b0j of C0.
When the semantic distance between the two cases is used to indicate the similarity degree, it can be considered that the smaller the semantic distance is, the more similar the two discriminant factors are.
Constructing the fuzzy similarity priority relationship
The fuzzy similarity priority ratio of Cpj similar to C0j when compared with Cqj can be defined as Eq. 8,
 (8)
(8)
where Djpq ∈ [0, 1], Djqp=1-Djpq ∈ [0, 1]. The bigger Djpq is, the bigger the similarity degree of Cpj similar to C0j when compared with Cqj is.
The fuzzy similarity priority relationship D(j) corresponding to the j-th discriminant factor can be constructed by the following steps:
Taking p and q equal to 1, 2,···, K in turn, if p = 1, and q = 2, 3,···, K, Dj12, Dj13,···, Dj1K is solved. If p = 2 and q = 1, 3,···, K, Dj22, Dj23,···, Dj2K is solved. Meanwhile, if p is equal to q, then Djpq = 1. Finally, the matrix D(j) can be expressed as Eq. 9,
 (9)
(9)
where the matrix is called the fuzzy similarity priority relationship of the j-th discriminant factor. By taking j equal to 1, 2,···, n, in turn, the n fuzzy similarity precedence relationships corresponding to the n discriminant factors can be obtained.
Discriminating the level of internal damage in ancient wood components based on fuzzy similarity priority
Taking a λ-cut set for D(j), the K similarity degree sequences between the j-th discriminant factor of the source cases and the target case C0 is obtained. Let λ be from big to small to check C0, respectively. If the elements on the p-th row are all 1 (except for the elements on the diagonal, which are 0), it can be considered that Cp and C0 are most similar. At this point, the row and column where Cp is located are deleted. By that analogy, the similarity degree sequences between the K source cases and C0 can be obtained.
Suppose that the source case that is most similar to the target case C0 is listed at the top of the sequence and its sequence number is 1 and the source sample that is least similar to the target case C0 is listed at the end of the sequence and its sequence number K. Then, the sequence numbers of the K source cases can constitute the following sequence number set, shown in Eq. 10,
Tj=(t1j, t2j,···, tkj,···, tKj) (10)
There are n sequence number sets corresponding to n discriminant factors, as shown in Eq. 11,
 (11)
(11)
The sequence number of the similarity degree between the k-th source case and the target case C0 can be expressed as Eq. 12,
 (12)
(12)
where ωj is the weight of n discriminant factors. Taking k equal to 1, 2,···, K, in turn, the sequence number of K source cases can be obtained by using Eq. 12. The smaller Fk is, the more similar Ck and C0 is.
Establishment of the variable weight model
Weights are used to measure the relative importance of influencing factors. Considering the sensitivity of the weights, the same factor will have different influences on the decision output in different decision-making environments (Zhou et al. 2010). During the determination of the weight (ωj) of the discriminant factor, whether the weight selection is reasonable or not directly determines the accuracy of the discriminant result. However, the evaluation method adopted by the current evaluation standard is a constant weight evaluation method, i.e., regardless of how the value of the discriminant factors change, the weights of the discriminant factors are constant. If one or two discriminant factors are particularly dangerous, it may be neutralized by other discriminant factor regardless of the utilized evaluation method. This may reduce the accuracy of the evaluation system and decrease the objective impartiality of the evaluation.
In addition, the more discriminant factors there are, the more average the weights are. Therefore, the greater the possibility of misjudgment (Liu 2010). To verify whether the evaluation results were consistent, this paper introduced entropy weight (Zhou et al. 2010), fractal theory (Liu et al. 2005), and projection pursuit (Wang 2019) to determine the weights (ω’j) of the discriminant factors, respectively. In the terms of the limitations of the constant weight method, three variable weight evaluation models integrating “penalize” and “excitation” were established to improve these three constant weight methods, respectively. The variable weight model can effectively solve the unreasonable evaluation results caused by multiple discriminant factors. According to the principle of state variable weight, the state variable weight vector (S) can be expressed as Eq. 13,
S = (s1, s2,···, sj,···, sn) (j = 1,2, ···, n) (13)
where sj is the function of xj, which can be determined by Eq. 14,
 (14)
(14)
where sj is a state variable weight function of the penalize-excitation, xj is the state value of each discriminant factor of the target case, which can be obtained by normalizing 11 discriminant factors, α is the level of “penalize”, β is the level of “excitation”, C, c1, and c2 are the evaluation strategies, and R is the adjustment factor (Duan 2003; Fan and Chen (2008). These parameters need to meet two conditions: 0 < μ < λ < α < β < 1 and 0 < C < c1 < c2 < 1.
The characteristics of the variable weight evaluation are specifically reflected in the following three aspects:
(1) For the evaluation value of each discriminant factor, there is xj ∈ (0,1). The closer the level of “excitation” β is to 1, i.e., the narrower the interval (β, 1), the faster the strong “excitation” that the state in this interval receives is.
(2) If the level of “penalize” α is very close to the level of “excitation” β, i.e., the qualified interval [α, β] is narrow, then there is neither “penalize” nor “excitation” for the state in this interval.
(3) The interval (0, α) of “penalize” is wide and is divided into three stages, including the initial “penalize” stage (λ, α), the strong “penalize” stage (μ, λ], and the veto stage (0, μ]. The level of “penalize” that the state receives is low during the initial “penalize” stage, while the level of “penalize” that the state receives is large during the strong “penalize” stage. In the veto stage, the evaluation value of the evaluation project is too low, but it has a large weight; therefore, the overall evaluation value of the overall target sharply drops. When the evaluation value is lower than or equal to the specified veto value, the entire target will be rejected.
If 0 < C < 1, 0 < 1-β < C,  , and 1 < R <c
  then sj is a state variable weight function of the strong local penalize-excitation (Duan 2003). According to sj, the variable weight model can be obtained according to Eq. 15,
 (15)
(15)
Combining Eq. 15 into Eq. 12 to obtain the weighted sum Fk (k = 1,2,···, K) of the sequence number of all source cases in K sequences yields Eq. 16,
 (16)
(16)
RESULTS AND DISCUSSION
Determining the Similarity Degree Sequence
Taking the target case C01 as an example to illustrate the discriminating process, the fuzzy similarity relations D(1) corresponding to 11 discriminant factors can be established according to Eqs. 6 through 9. Simultaneously, the similarity priority matrix of each discriminant factor was established, which was represented by D(j) (j = 1,2,···, 11). Secondly, the similarity degree sequence Tj (j = 1,2,···, 11) between each discriminant factor of the source cases and each discriminant factor of the target case C01 could be obtained by using the obtained fuzzy similarity priority relationship D(j), which is shown in Table 4.

Determining the Weights of the Discriminant Factors
The fractal theory was taken as an example to illustrate the construction process of the variable weight model of the discriminant factors. The discriminant factors of the target case C01 were normalized to obtain the state value of each discriminant factor of the target case C01. According to the characteristics of the source cases, let μ = 0.2, λ = 0.6, α = 0.7, β = 0.9, C = 0.5, c1 = 0.5, c2 = 0.8, and R = 1.3; under these conditions, the state variable weight function of the local penalize-excitation is expressed as Eq. 17
 (17)
(17)
According to Eq. 15, the weights (ωj) of the discriminant factors based on the fractal theory can be obtained via the variable weight model. Similarly, the weights (ωj) of each discriminant factor based on entropy weights and projection pursuits can be calculated, as shown in Table 5.

Determining the Comprehensive Similarity Sequence
The comprehensive similarity sequence (Fk) of the target case C01 was obtained using Eq. 16, which is shown in Table 6. As shown in Fig. 2, it can be found that the Fk corresponding to the source case C7 obtained by the three weight determination methods is the minimum. Since the smaller Fk is, the more similar the source case and target case C01 is. The results show that the target case C01 is most similar to the source case C7, as shown in Table 6. In addition, C7 represents a source case with a diameter of 22 cm and has a damage level of II. It can be concluded that the damage level of target case C01 is also II.
Similarly, the comprehensive similarity sequence (Fk) between the other target cases and the source cases can be quickly obtained through the above discriminant steps. In order to intuitively represent the discriminant results, Figs. 2 through 7 show the comprehensive similarity sequence (Fk) histograms between target cases C01 through C06 and source cases C1 through C36.

Fig. 2. The Fk histogram between target case C01 and source cases C1 through C36

Fig. 3. The Fk histogram between target case C02 and source cases C1 through C36

Fig. 4. The Fk histogram between target case C03 and source cases C1 through C36

Fig. 5. The Fk histogram between target case C04 and source cases C1 through C36

Fig. 6. The Fk histogram between target case C05 and source cases C1 through C36

Fig. 7. The Fk histogram between target case C06 and source cases C1 through C36

It can be obviously seen from Figs. 2 through 7 that the source cases corresponding to the minimum value of the Fk obtained by the three weighting methods were C7, C19, C14, C26, C3, and C33, respectively. The smaller the weighted sum Fk is, the more similar the source case and target case is. Table 7 shows the discriminant result of damage levels of the target cases C01 through C06. The discriminant results of the model used in this paper are all in line with the actual situation, and the discrimination accuracy is 100%. The case analysis shows that the method has simple reasoning principle and reliable results, which provides a quick and accurate method to discriminate the internal damage of ancient wooden components.

Limitations
This study has certain limitations. This test only simulates the damage type of the hollow through a single symmetrical circle for a wood component of one tree species. A variety of damage conditions (such as decay, cracks, insect attacks, etc.) need to be considered in the follow-up study. Meanwhile, a sample database of different tree species can be established to enhance the applicability of the model. In addition, the discrimination of internal damage of ancient wooden components is not only related to the wave speed, but also affected by other factors. The selection of discriminant factors needs to be studied in depth.
CONCLUSIONS
- In the study, three discriminant factors, i.e., diameter, attenuation coefficient, and wave velocity ratio, were selected based on the stress wave detection data. In addition, the concept of fuzzy similarity priority was introduced to establish a case-based reasoning method for determining the internal damage levels of ancient wood components based on fuzzy similarity priority. Through the comparison of different discriminant factors between the target case and the source case, a reasonable reasoning relationship between them was established. This relationship was established to find the most similar source case to the target case, in order to realize the discrimination of the level of internal damage to the ancient wooden components. This method had a simple reasoning principle, high efficiency, as well as stable and reliable calculation results. Therefore, it can provide a feasible new way for the health assessment of ancient building wood components.
- When determining the weight of a discriminant factor, this paper introduces the idea of variable weight; as such, the state variable weight functions of the local penalize-excitation based on three weighting methods which include entropy weight, fractal theory, and projection pursuit were established, respectively. The results show that the weight distribution of the discriminant factors obtained via the variable models had good consistency, improved the accuracy of the discrimination system, and ensured the objectivity and fairness of the judgment results.
ACKNOWLEDGMENTS
This study was supported by the National Key R&D Program of China (Grant No. 2018YFD1100902-1), the Beijing Municipal Commission of Education-Municipal Natural Science Joint Foundation (Grant No. KZ202010005012) and the National key research and development program (Grant No. 2019YFC1520803).
REFERENCES CITED
Bandara, S., Rajeev, P., Gad, E., Sriskantharajah, B., and Flatley, I. (2021). “Health monitoring of timber poles using time-frequency analysis techniques and stress wave propagation,” Journal of Civil Structural Health Monitoring 11(1). 85-103. DOI: 10.1007/s13349-020-00440-1
Dackermann, U., Crews, K., Kasal, B., Li, J., Riggio, M., Rinn, F., and Tannert, T. (2014). “In situ assessment of structural timber using stress-wave measurements,” Materials and Structures 47(5), 787-803. DOI: 10.1617/s11527-013-0095-4
Duan, S.-Q. (2003). “A method of variable weight synthetic evaluation for safety management of power business,” Mathematics in Practice and Theory 8, 17-23.
Du, X., Feng, H., Hu, M., Fang, Y., and Chen, S. (2018). “Three-dimensional stress wave imaging of wood internal defects using TKriging method,” Computers and Electronics in Agriculture 148, 63-71. DOI: 10.1016/j.compag.2018.03.005
Fan, M.-F. and Chen, G.-H. (2008). “Study on risk assessment method of gas-fired power plant based on variable weight model,” Gas & Heat 24(4), 78-83.
GB/T 50329 (2012). “Standard for test methods of timber structures,” Standardization Administration of China, Beijing, China.
GB 50005 (2017). “Standard for design of timber structures,” Standardization Administration of China, Beijing, China.
He, H., Wen, K., Chen, Z., and Ye, W. (2009). “Case-based reasoning and fuzzy analogy preferred ratio for effective depth of collapsible loess treated with dynamic consolidation,” Journal of Engineering Geology 17(1), 88-93.
Huan, Z., Jiao, Z., Li, G., and Wu, X. (2018). “Velocity error correction based tomographic imaging for stress wave nondestructive evaluation of wood,” BioResources 13(2), 2530-2545. DOI: 10.15376/biores.13.2.2530-2545
Lee, L. D. (1965). “Ultrasonic pulse velocity testing considered as a safety measure for timber structures,” in: Proceedings of the 2nd Nondestructive Testing of Wood Symposium, Spokane, WA, USA, pp. 185-203.
Liu, M., and Zhu, R. (2002). “Case-based reasoning approach to slope stability evaluation based on fuzzy analogy preferred ratio,” Chinese Journal of Rock Mechanics and Engineering 21(8), 1188-1193.
Liu, G.-P., Du, P., and Wang, K. (2005). “Application of fractal theory to evaluation of lake eutrophication,” Acta Agriculturae Universitatis Jiangxiensis 27(6), 925-929.
Liu, K. (2010). “A synthesis evaluation method for highway pavement based on a variable weight model,” Journal of Xiamen University (Natural Science) 49(4), 531-534.
Lin, W. S., and Wu, J. Z. (2013). “Study on application of stress wave for nondestructive test of wood defects,” Applied Mechanics and Materials 401-403, 1119-1123. DOI: 10.4028/www.scientific.net/AMM.401-403.1119
Li, X., Dai, J., Qian, W., and Chang, L.-H. (2015). “Prediction of internal defect area in wooden components by stress wave velocity analysis,” BioResources 10(3), 4167-4177. DOI: 10.15376/biores.10.3.4167-4177
Li, X. (2015). Key Technology Research on Material Performance and Damage Detection for Wooden Components of Ancient Chinese Building, Ph.D. Dissertation, Beijing University of Technology, Beijing, China.
Morales-Conde, M. J., and Machado, J. S. (2017). “Evaluation of cross-sectional variation of timber bending modulus of elasticity by stress waves,” Construction and Building Materials 134, 617-625. DOI: 10.1016/j.conbuildmat.2016.12.188
Wang, C. (2019). “Application and research of optimal projection Pursuit Model in hydraulic modernization evaluation,” Heilongjiang Hydraulic Science and Technology 47(12), 205-208.
Wang, Z., Ma, D., Qian, W., Wang W., Guo, X., Xu, Q., Huan, J., and Gao, Z. (2019). “Detection and prediction of internal damage in the ancient timber structure based on optimal combined model,” Advances in Civil Engineering 2019, 1-18. DOI: 10.1155/2019/7108262
Wang, Z., Wang, W., Ma, D., Guo, X., Huan, J., and Cheng, L. (2020). “Coupling model of fuzzy soft set and Bayesian method to forecast internal defects of ancient wooden structures based on nondestructive test,” BioResources 15(1), 1134-1153. DOI: 10.15376/biores.15.1.1134-1153
Xu, H., Wang, L., You, X., Liu, Y., and Yang, X. (2011). “Propagation velocity of stress wave and ultrasonic wave transmitting on indefectible cross section of standing trees,” Scientia Silvae Sinicae 47(4), 129-134.
Yue, X., Wang, L., Wacker, A. P., and Zhu, Z. (2019). “Electric resistance tomography and stress wave tomography for decay detection in trees-a comparison study,” PeerJ 7, 1-16. DOI: 10.7717/peerj.6444
Zhang, Q., Wang, J., and Li, B. (2015). “Prediction method of loess collapsibility based on fuzzy analogy preferred ratio,” Yangtze River 46(1), 90-93.Zhao, W. and He, Y.-L. (2008). “Case-based reasoning approach to stability evaluation of structured rock slope,” Journal of Railway Engineering Society 25(7), 5-9.
Zhou, L., Wang, W., and Ma, R. (2010) “Application of method of entropy proportion to urban earthquake disaster risk index,” Earthquake Engineering and Engineering Vibration 30(1), 93-97.
Article submitted: March 23, 2021; Peer review completed: May 1, 2021; Revised version received and accepted: May 10, 2021; Published: May 11, 2021.
DOI: 10.15376/biores.16.3.4814-4830