
Abstract
The human perception of softness is an important yet complex property of hygiene tissue paper products. Softness is a function of the combination of machine technology, chemical additives, and furnish composition. As a result, it is difficult to investigate the influence of single parameters. Because no completely satisfactory method for determining the softness of furnishes is available at the laboratory scale, the influence of different fibrous materials in combination with their treatment cannot be comprehensively investigated. To work toward this possibility, this publication describes the development of a method to obtain reliable results based on laboratory handsheets using a modified tissue softness analyzer (TSA). With the help of basic statistical methods, a procedure was developed that reproducibly distinguished the influence between softwood and hardwood. To demonstrate the potential of this method, it was tested on an industrial tissue machine and the influence of four different furnishes on the softness of the semi-finished product was determined.
Download PDF
Full Article
A New Method to Evaluate the Hand-feel Potential of Furnishes for Tissue Paper Products
Marcel Prinz,a,* Helga Zollner-Croll,a Wolfgang Bauer,b and Frank P. Meltzer c
The human perception of softness is an important yet complex property of hygiene tissue paper products. Softness is a function of the combination of machine technology, chemical additives, and furnish composition. As a result, it is difficult to investigate the influence of single parameters. Because no completely satisfactory method for determining the softness of furnishes is available at the laboratory scale, the influence of different fibrous materials in combination with their treatment cannot be comprehensively investigated. To work toward this possibility, this publication describes the development of a method to obtain reliable results based on laboratory handsheets using a modified tissue softness analyzer (TSA). With the help of basic statistical methods, a procedure was developed that reproducibly distinguished the influence between softwood and hardwood. To demonstrate the potential of this method, it was tested on an industrial tissue machine and the influence of four different furnishes on the softness of the semi-finished product was determined.
Keywords: Tissue softness; Handsheets; Tissue softness analyzer; Furnish softness potential
Contact information: a: Department of Paper Technology, Faculty 05, Munich University of Applied Sciences, Lothstraße 34, 80335 Munich, Germany; b: Institute of Bioproducts and Paper Technology, Graz University of Technology, Inffeldgasse 23, 8010 Graz, Austria; c: Mercer Pulp Products, Charlottenstraße 59, 10117 Berlin, Germany; *Corresponding author: mprinz@hm.edu
INTRODUCTION
The softness of sanitary paper refers to a human being’s sensory perception and is created by lightly brushing the surface of hygienic papers and crumpling them. The complex interaction of different sensory cells in the hand and the processing of these stimuli in the human brain leads to a sensation of softness.
Softness is one of the most important properties of many tissue paper grades. Depending on the grade, the requirements regarding its haptic experience can vary. For example, bathroom papers, facial tissues, and napkins have higher requirements for softness than kitchen towels and hand towels (De Assis et al. 2018). In the past, various researchers have attempted to develop a measurement system to objectively evaluate this decisive property. Hollmark and Ampulski (2004) provided a comprehensive overview of the developments in the field of softness measurements and concluded that no universally accepted method was yet available. They also noted that while humans have the best sensing system, they also have a decisive disadvantage: there is no standard human evaluator, which makes the human haptic evaluation subjective and difficult to reproduce. Therefore, an objective evaluation of softness based on human perception requires a high degree of effort regarding the number of test persons, the amount of material, and time. In addition, the plausibility and reproducibility of the results of human panel tests has been the subject of criticsm. In his study, McConnell (2016) shows how high the variation between the results of panels and panelists of one panel can be.
Grüner (2007) published the patent “Method and apparatus for determining the softness of hygienic papers and textiles,” which describes an instrument called the “Tissue Softness Analyzer (TSA)” that simulates the measuring principle of the human hand. According to the manufacturer, the device measures three decisive properties: fiber softness (TS7), texture (TS750), and stiffness (D). From these measured variables, as well as thickness, grammage, and the number of plies, a hand-feel (HF) value is calculated using mathematical models (Grüner 2018). The measuring principle is based on the acoustic perception of the noise generated by a defined method of scratching with eight rotating lamellae over the surface of a sample. The sound spectrum recorded is analyzed by the software. Two peaks are of particular importance. The TS750, which occurs at approximately 750 Hz (200 to 2000 Hz), relates to the vertical vibration of the tested sample, and is mainly influenced by the coarseness of the surface structure. Thus, the TS750 reacts sensitively to roughness and embossing. The TS7 at around 6500 Hz was originally discovered as the seventh peak in the spectrum and is mainly generated by vibrations of the eight rotating lamellae interacting with fibers protruding on the surface. Stiffer fibers cause the lamellae to vibrate with a higher amplitude, causing a higher TS7 peak, meaning that the product is less soft. However, if the fibers on the surface are more flexible, the vibration of the lamellae is reduced and the TS7 peak is lower, indicating a softer product.
As the TSA is frequently used in the tissue paper industry to measure and control softness, various researchers have recently begun to study this method. Perng et al. (2019) compared the TSA hand-feel measurement to an extensive panel test, finding a linear correlation (R² = 0.8559) between the TSA-HF and the corrected hand-felt (CHF) of the panel test. In another study, Wang et al. (2019) investigated 23 commercial bathroom paper products from the American market. They compared different TSA algorithms and individual values with two different panel test methods and noted that the TS7 value in particular had a strong linear correlation to the panel test results. In addition, they found that the TSA worked better for products with simple finishing than for products with intensive embossing or those manufactured using the un-creped through-air dry (UCTAD) process. Both studies indicate that the TSA is useful for a quick and objective assessment of softness in the production process of tissue products, with some limitations.
The factors influencing the softness of hygienic papers are manifold and complex. In principle, the softness of hygienic papers is a function of the production technology, the raw materials in the furnish, and the process chemistry (O’Brian 2017; De Assis 2019). All of these factors affect a paper’s physical properties, such as bulk, smoothness, friction, and strength, which have an influence on softness. This complexity makes it difficult to understand the influence that each of the individual factors have.
One of the most important factors is the choice of raw material. Most tissue furnishes today consist of a mixture of softwood and hardwood pulps. Hardwood pulps, especially bleached eucalyptus kraft (BEK), are known for their good tissue softness properties. Due to their high fiber number per unit mass, low fines content, and short fibers with low-coarseness and uniform morphology, eucalyptus pulps create a uniform sheet structure with many free fiber ends. In contrast, softwood pulps, especially northern bleached softwood kraft (NBSK), are applied to achieve the necessary strength properties, but they negatively influence softness. NBSK fibers have a higher coarseness and a lower fiber number per unit mass compared to hardwood fibers, although they form a fiber matrix that is complemented by hardwood fibers to provide sufficient strength (Nanko et al. 2005).
The softwood/hardwood ratio and the refining conditions are known to have a notable impact on softness (Gigac and Fišerová 2008; Zou and MacDonald 2017; Chang et al. 2018). To gain more precise insight into the influences of different fibrous materials, scientific studies have been conducted to evaluate the softness potential of pulps using creped and un-creped laboratory sheets. Gigac and Fišerová (2008) used 80 g/m² handsheets to determine bulk softness. Therefore, they used flexural rigidity according to the TAPPI method T556 pm-95 (1995) and found that refining increases bulk softness. Other researchers disagree with this finding. McConnell (2016) noticed a negative linear relationship between strength and softness. He introduced the Geometric-Mean Breaking-Length (GMBL) and used the TSA and a hand-feel panel to evaluate softness. Chang et al. (2018) used 30 g/m² air-dried handsheets, the TSA, and a PFI-mill (Paperindustriens-Forskningsinstitutt) to investigate the influence of refining on softness and strength and found that refining negatively influences softness. Anukul et al. (2015) used a laboratory wet-creping method in combination with valley beater refining and a Clark softness-stiffness tester. De Assis et al. (2019) examined the softness of various wood and non-wood pulps using 30 g/m² handsheets measured with a panel test and the TSA. He found no correlation between the two measurements when pulps with different morphologies were compared, for example NBSK and BEK. None of the studies could show that the results obtained on laboratory sheets correlate with the softness of semi-finished or finished products.
The aim of this publication is to find a method by which meaningful softness results can be obtained from laboratory sheets using common paper testing equipment and a modified TSA and test it on semi-finished and finished products. In the future, this method can be used to predict the softness potential of fiber materials and examine individual influencing factors separately.
EXPERIMENTAL
This study consists of two sections. The first section explains how the method was developed by comparing softwood and hardwood handsheets. During this process, the method was gradually adapted by changing the TSA configuration, the drying procedure, and the basis weight. The second section shows industrial results based on the newly developed method, which demonstrates that the new method has potential to predict the softness of semi-finished and finished products based on handsheet measurements.
Pulp Preparation
In the first three parts of the study, an unrefined bleached eucalyptus kraft (BEK, Fibria, Jacaraí, Brazil) and an unrefined northern bleached softwood kraft (NBSK, pine and spruce, Zellstoff Stendal GmbH, Stendal, Germany) were used. They were disintegrated according to DIN EN ISO 5263-1 (2004) using standard tap water with 15.8° German hardness.
In the fourth part, furnish from the machine chest of a dry-crepe tissue (DCT) machine was used to form handsheets and measure the fiber softness potential.
Sheet Preparation
Based on the DIN EN ISO 5269-2 (2005) standard, the handsheets were produced on a Rapid-Köthen sheet former (Senkel Gerd Laborgeräteservice, Mülheim an der Ruhr, Germany). The basis weight was varied from 25 to 35 g/m². Three different drying procedures were investigated during this study. First, vacuum drying was evaluated according to DIN EN ISO 5269-2 (2005). Second, oven drying was done for 30 min at 105 °C. Third, air drying was for 24 h at 23 °C and 50% relative humidity.
Measurement
All samples were conditioned in a climate room maintained at 50% relative humidity and 23 °C according to DIN EN ISO 20187 (1993). The basis weight was measured according to DIN EN ISO 12625-6 (2017).
Softness measurement
To determine the softness, a modified tissue softness analyzer (TSA) from emtec (Leipzig, Germany) was used. The modified device had an additional top microphone. The investigation was performed with and without use of a film. A polytetrafluoroethylene (PTFE) film with a thickness of 50 µm below the sample was tested to reduce the effect of porosity induced sound attenuation. The PTFE film was chosen because of its low coefficient of friction, which ensures good clamping of the samples into ring holder. These changes resulted in four possible TSA configurations:
- Top microphone with film
- Top microphone without film
- Bottom microphone with film
- Bottom microphone without film (standard configuration for tissue testing)
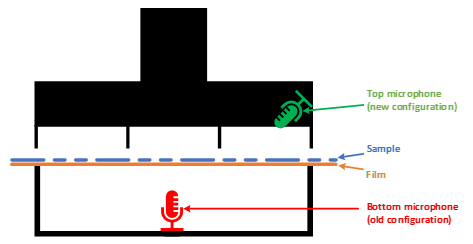
Fig. 1. New TSA configuration
Round samples with an area of 100 cm² were clamped into the holder and measured with the different TSA configurations. The rotational speed of the 8 lamellae was 2 Hz with a contact pressure of 100 mN. The rotation over the sample surface caused vibrations that were captured by one of the two microphones. The values TS7, TS750, and D were recorded for handsheets. The standard configuration was used to evaluate semi-finished products, and the Base Tissue 1 algorithm was used to calculate the HF value. The HF values ranges from 0 (least soft) to 100 (softest), whereby a high HF value stood for higher softness; high TS7 or TS750 values, however, indicated lower softness. Low stiffness resulted in higher D values.
Evaluation of the Method
Basic statistical methods were used to assess the variability of the method. The objective was to find a method with low variability between replicate tests. The standard deviation was used as a measure of variability, the standard deviation was used and was calculated as follows,
 (1)
(1)
where sx is standard deviation TS7 (dB),  is the average TS7 (dB), and n is the number of samples.
The combined standard deviation was used to compare different methods using a dataset of long and short fiber samples, and calculated as followed,
scomb = [1 / (nSF + nLF)] · [(sSF · nSF) + (sLF ·nLF)] (2)
where scomb is the combined standard deviation, sSF is the standard deviation of short fiber samples, sLF is the standard deviation of long fiber samples, nSF is the number of short fiber samples, and nLF is the number of long fiber samples.
Furthermore, the correctness of the method was evaluated by the difference between long fiber and short fiber handsheets (Fig. 7). Henceforth, this value is called plausibility. The objective was to find a method with high plausibility, meaning that the influence of long and short fibers can be distinguished. The formula is,
 (3)
(3)
where Px is plausibility,  is the TS7 average of long fiber handsheets (dB), and
  is the TS7 average of short fiber handsheets (dB).
After a potential method was developed by distinguishing between hardwood and softwood pulps, the most promising settings were tested on an industrial tissue machine (AHEAD-2.0S, Toscotec, Lucca, Italy).
RESULTS AND DISCUSSION
Contradicting results seemed to be attributable to the varying sound transmission behavior of the handsheet samples and their different porosities (Fig. 2). António (2011) describes that porosity has a strong influence on the sound transmission of fibrous materials, whereby sound absorption increases with increasing porosity.
Softwood handsheets with a specific volume of 5.08 cm³/g had a greater void volume, thus dampening the vibrations of the rotating lamellae. Hardwood handsheets, however, had a lower specific volume of 4.27 cm³/g, and transmitted the sound through the sample more easily. In the case of handsheet measurements, this difference dominated the TS7 measurement and yielded conflicting results. Figure 3 shows that with the original TSA configuration (bottom microphone without film, red), the TS7 was higher for hardwood than for softwood samples, indicating a higher softness for the softwood pulp. This finding contradicts various scientific findings (Nanko et al. 2005; Zou and MacDonald 2017; De Assis et al. 2018). After applying the described statistical methods, a high standard deviation (2.41 TS7) and a negative plausibility (-3.06 TS7) was observed for the standard measurements. To overcome this issue, two options were tested. The first option was the placement of a film cover below the handsheet sample to improve the sound transmission through the sample. This effect can be compared to the function of a stethoscope. The second option was use of a second microphone near the rotating lamellae to receive the TS7 signal without dampening by the sample (Fig 1). For each configuration, the number of samples nSF and nLF was 5.

Fig. 2. Different sound transmission behavior dominating the TS7 measurement of the TSA

Fig. 3. Comparison of TS7 values for softwood and hardwood handsheets with the various TSA configurations

Fig. 4. Statistical analysis of TS7 values for the various TSA configurations to measure handsheets comparing softwood and hardwood
With the modified measurement setup, the expected differences between hardwood and softwood handsheets were obtained. The high attenuation of the TS 7 signal of softwood handsheets could be compensated by using PTFE film. Nevertheless, there was a high variation of the results, which may be caused by the ring-shaped clamping. During the clamping procedure, the sample was deformed and thus partially became lifted off the film. This effect was much stronger with softwood handsheets than with hardwood handsheets. The effect of the different noise transmission was reduced by using the modified version of the TSA, with the top microphone. The new TSA configuration in combination with a PTFE film under the sample showed the most promising results in terms of variation (1.19 TS7) and plausibility (8.77 TS7). Figures 3 and 4 also showed that similar results were achieved with and without film when the top microphone was used.
Sample Drying
The laboratory drying method was examined in detail with the modified measuring procedure for handsheets.
It is known that conventional drying in accordance with DIN EN ISO 5269-2 (2005) is not suitable for softness testing, as the sheet is pressed between two smooth papers. This approach smoothens the surface and compresses the sample, thus preventing the measurement of differences caused by the influence of fibrous materials. Therefore, three different sample drying methods were investigated to determine the most suitable option. One option was oven drying. The samples were couched and dried with one side exposed to the air for 30 min in an oven at 105 °C. The second option was the standard drying method according to DIN EN ISO 5269-2 (2005). The third option was air drying with one side exposed to the air for 24 h in a conditioned room at 23 °C and 50% relative humidity. The handsheets had a basis weight of 30 g/m². The number of samples nSF and nLF was 10.

Fig. 5. Comparison of TS7 values for softwood and hardwood handsheets with different drying methods and the new TSA configuration (top microphone with film)

Fig. 6. Statistical analysis of the three sample drying methods to prepare specimens for the hand-feel measurement comparing NBSK and BEKP
Figures 5 and 6 show the influence of the sample drying on TS7 results. Conventional drying according to DIN EN ISO 5269-2 (2005) provided unsuitable results. Especially, the variation of the softwood handsheets was high, resulting in a high combined standard deviation (2.83). This can be attributed to the compression and the resulting stiffening of the samples, which makes it difficult to clamp them evenly in the ring holder. In addition, the surface to be measured was smoothed by the cover sheets. Thus, only a small difference between LF and SF handsheets was found, which was reflected in the lower plausibility (6.44). Drying in an oven at 105 °C was fast, but the variation was high (3.25). This was probably due to the fact that the samples curled in the drying oven. Air drying for 24 h gave the best results.
Basis Weight
After the measurement method and sample preparation were optimized for handsheet measurements, an optimal handsheet basis weight was determined. Therefore, the same approach was used, whereby the handsheet grammage was varied.
Figure 7 shows the relationship between basis weight and TS7. At this point, the samples were produced using the air-drying method and measured using the top microphone with film. It can be observed that the TS7 value increased with increasing basis weight, meaning that the measurement indicated lesser softness. This behavior was more pronounced with softwood than with hardwood. For this reason, the differentiability between softwood and hardwood increased with increasing basis weight. The statistical analysis showed that 30 g/m² was best suited to differentiate between the softness of softwood and hardwood (Fig. 8).

Fig. 7. Influence of grammage on the TS7 of handsheets produced with the air-drying method and measured with the top microphone and with a PTFE film

Fig. 8. Statistical analysis of the handsheet grammage; comparing NBSK and BEKP
Industrial Results
The method was tested at an industrial tissue paper production facility to determine its suitability. Four different furnishes, consisting of one softwood and four different hardwood pulps, were taken from the machine chest to produce handsheets as previously described. The TSA HF values of the base tissues produced on this paper machine were compared to the TS7 values of the handsheets. During the trial period, all softness parameters of the paper machine were kept constant, such as refining conditions, nip pressure, creping conditions, and machine speed.
The results demonstrated in Fig. 9 show that the TSA configuration with a plastic film underneath the sample resulted in a medium correlation between handsheet TS7 and base tissue HF (R² = 0.75754). This means that although the film could lead to better differentiation between long and short fiber handsheets, the softness potential of fibers on the paper machine was less predictable. The reason for this could be the more difficult adjustment of the contact pressure of the rotating lamellae. The film generates a higher counterpressure during the measurement and thus influences the surface tension of the sample.
A better linear relationship between handsheet TS7 and the base tissue HF values could be obtained without the film. An R² of 0.99828 demonstrated that evaluating furnish softness based on handsheets according to the presented new method was suitable to predict furnish performance at the paper machine. In addition, it has to be noted that the variation of both the base tissue hand-feel and the handsheet TS 7, showed high variation during the trial, which can be attributed to an uneven tension of the sample introduced by the ring shaped fixing of the paper samples.
Based on the evaluations, the following sample preparation and measurement conditions are suggested to analyze the softness potential of furnishes:
- New TSA configuration without film using the top microphone
- Sample drying with one side exposed to the air at standard climate conditions (23 °C and 50% relative humidity)
- 30 g/m² handsheets

Fig. 9. Correlation between base tissue HF, using the base tissue 1 algorithm and handsheet TS7 with the new TSA configuration, with and without film; error bars represent the 95% confidence interval
The next step was a benchmark study using nine different toilette papers. The newly developed method was used to retrospectively determine the softness potential of market toilet papers. For this purpose, 9 different products from the US market were defibered and processed into 30 g/m² laboratory sheets. With these samples the fiber softness potential was determined and compared to the HF values of the associated finished products. To evaluate the HF values the TP2 algorithm was chosen as it shows a good correlation to human perception (Wang et al. 2019).
Figure 10 shows that the softness of toilet paper depended to a large extent on the softness potential of the fibers used. There was a strong correlation between the softness potential TS 7 measured on handsheets and the HF measured on the final toilet paper. The coefficient of determination was 0.9048.
Although the influences of machine configuration and converting were not taken into account, it can be said that fibers with a high softness potential have to be used to make toilet paper with a high softness.

Fig. 10. Correlation between handsheet TS 7 and toilet paper hand-feel for 9 different samples from the US market
CONCLUSIONS
- The default TSA configuration for evaluating tissue softness produced contradictory results when measuring handsheets. Softwood appeared softer than hardwood.
- A change in the position of the microphone ensured that the expected differences of softwood and hardwood regarding their softness potential for tissue products could be evaluated in the laboratory based on handsheets.
- The placement of a PTFE film below the handsheet reduced the effect of porosity on the sound transmission and the expected differences between softwood and hardwood were measured. In combination with the top microphone, the film reduced the R² when handsheets were compared with base tissue products.
- In order to increase reproducibility and differentiability, handsheets were produced with a basis weight of 30 g/m² and the specimens were dried with one site exposed to the air under standard climate conditions.
- There was a linear correlation (R² = 0.99828) between the TS7 measurements of the handsheets and the hand-feel measurements of the base tissue samples after the paper machine.
ACKNOWLEDGEMENTS
This work was financially supported by WEPA Hygieneprodukte GmbH and Mercer Pulp Products. Special Acknowledgement goes to emtec Electronic GmbH for providing the modified TSA.
REFERENCES CITED
António, J. (2011). “Acoustic behaviour of fibrous materials,” in: Fibrous and Composite Materials for Civil Engineering Applications, R. Fangueiro (ed.), WP Woodhead Publ., Oxford, pp. 306-324. DOI: 10.1533/9780857095583.3.306
Anukul, P., Khantayanuwong, S., and Somboon, P. (2015). “Development of laboratory wet creping method to evaluate and control pulp quality for tissue,” TAPPI Journal 14(5), 339-345.
Chang, C.-H., Yu, S.-T., and Perng, Y.-S. (2018). “Effects of furnish and refining on properties of household paper,” Cellulose Chemistry and Technology 52(5-6), 433-440.
De Assis, T. (2019). “Understanding the effect of fiber features and mechanical refining on tissue properties,” in: Proceedings of Tissue Conference, Raleigh, NC, USA.
De Assis, T., Reisinger, L. W., Pal, L., Pawlak, J., Jameel, H., and Gonzalez, R. W. (2018). “Understanding the effect of machine technology and cellulosic fibers on tissue properties – A review,” BioResources 13(2), 4593-4629. DOI: 10.15376/biores.13.2.DeAssis
De Assis, T., Pawlak, J., Pal, L., Jameel, H., Venditti, R., Reisinger, L. W., Kavalew, D., and Gonzalez, R. W. (2019). “Comparison of wood and non-wood market pulps for tissue paper application,” BioResources 14(3), 6781-6810. 10.15376/biores.14.3.6781-6810
DIN EN ISO 12625-6 (2017). “Tissue-papier und tissue-produkte – Teil 6: Bestimmung der flächenbezogenen masse [Tissue paper and tissue products – Part 6: Determination of grammage],” Deutsches Institut Für Normung E.V. (German National Standard), Berlin, Germany.
DIN EN ISO 20187 (1993). “Papier, pappe und zellstoff; Normalklima für die vorbehandlung und prüfung und verfahren zur überwachung des klimas und der probenvorbehandlung [Paper, board and pulps; standard atmosphere for conditioning and testing and procedure for monitoring the atmosphere and conditioning of samples],” Deutsches Institut Für Normung E.V. (German National Standard), Berlin, Germany.
DIN EN ISO 5263-1 (2004). “Faserstoffe – Nassaufschlagen im labor – Teil 1: Aufschlagen von chemiezellstoff [Pulps – Laboratory wet disintegration – Part 1: Disintegration of chemical pulps],” Deutsches Institut Für Normung E.V. (German National Standard), Berlin, Germany.
DIN EN ISO 5269-2 (2005). “Laborblattbildung für physikalische Prüfungen – Teil 2: Rapid-Köthen-Verfahren [Pulps – Preparation of laboratory sheets for physical testing – Part 2: Rapid-Köthen method],” Deutsches Institut Für Normung E.V. (German National Standard), Berlin, Germany.
Gigac, J., and Fišerová, M. (2008). “Influence of pulp refining on tissue paper properties,” TAPPI Journal 7(8), 27-32.
Grüner, A. (2018). “Emtec TSA – Textile softness analyzer: A new and objective way to measure smoothness, softness, and stiffness of textiles,” in: Proceedings of High-Tex from Germany, Atlanta, GA, USA.
Grüner, G. (2007). “Verfahren und vorrichtung zur bestimmung der weichheit von hygienepapieren und textilien [Method and apparatus for determining the softness of hygienic papers and textiles],” German Patent No. DE102006007678A1.
Hollmark, H., and Ampulski, R. S. (2004). “Measurement of tissue paper softness: A literature review,” Nordic Pulp & Paper Research Journal 19(3), 345-353. DOI: 10.3183/npprj-2004-19-03-p345-353
McConnell, W. (2016). “I am in Spec … but where did my softness go? Solving tissue softness problems with data analytics,” Tissue Story, (https://www.tissuestory.com/2018/03/12/wheredidmysoftnessgo/), Accessed July 19, 2020.
Nanko, H., Button, A., and Hillman, D. (2005). The World of Market Pulp, TAPPI Press, Atlanta, GA, USA.
O’Brian, H. (2017). “Tissue sheet softness – Theory, measurement, and chemical applications which can improve it,” Tissue Story, (http://www.tissuestory.com/2017/08/31/tissue-sheet-softness-theory-measurement-and-chemical-applications-which-can-improve-it/), Accessed Sept. 11, 2017.
Perng, Y.-S., Teng, T.-Y., and Chang, C.-H. (2019). “A study of the softness of household tissues using a tissue softness analyzer and hand-felt panels,” TAPPI Journal 18(3), 195-209. DOI: 10.32964/TJ18.3.195
TAPPI T556 pm-95 (1995). “Bending resistance of paper and paperboard (Lorenztzen & Wettre type tester),” TAPPI Press, Atlanta, GA, USA.
Wang, Y., De Assis, T., Zambrano, F., Pal, L., Venditti, R., Dasmohapatra, S., Pawlak, J., and Gonzalez, R. (2019). “Relationship between human perception of softness and instrument measurements,” BioResources 14(1), 780-795. DOI: 10.15376/biores.14.1.780-795
Zou, X., and MacDonald, K. (2017). “Fiber preparation for tissue making,” in: Proceedings of PaperCon 2017, Minneapolis, MN, USA.
Article submitted: June 15, 2020; Peer review completed: September 5, 2020; Revised version received and accepted: November 27, 2020; Published: December 4, 2020.
DOI: 10.15376/biores.16.1.684-697