
Abstract
The diameter of nanocellulose most often is detected using scanning electron microscopy (SEM), transmission electron microscopy (TEM), atomic force microscopy (AFM), and other related techniques. These detection methods are not only expensive, time-consuming, and complicated to operate, but also are not conducive to the detection of the diameter during the actual production of nanocellulose. In this study, the settling height of cellulose nanocrystals (CNCs) was related to CNC diameter by sedimentation method to find a convenient technique for the rapid detection of CNC diameter. The results showed that when the CNC concentration was at 0.2 wt%, the sodium chloride (NaCl) dosage at 40 g/L, and at the standing time of 48 h, the CNC sedimentation performance was the best. Furthermore, with the increase of CNC diameter, the settling height of CNCs gradually decreased. The relationship between CNC diameter and settling height was Y (Settling height) = -30.17 ln(X (CNC diameter)) + 123.64; and the coefficient of determination for the fit was 0.9965. This research provides a new method for the diameter detection of CNCs in the actual CNCs production in enterprises.
Download PDF
Full Article
A Simple and Rapid Method for the Diameter Detection of Cellulose Nanocrystals via Sedimentation Method
Shancong Huang,a Jialin Xing,a Guisheng Zhou,b and Xinxing Xia a,*
The diameter of nanocellulose most often is detected using scanning electron microscopy (SEM), transmission electron microscopy (TEM), atomic force microscopy (AFM), and other related techniques. These detection methods are not only expensive, time-consuming, and complicated to operate, but also are not conducive to the detection of the diameter during the actual production of nanocellulose. In this study, the settling height of cellulose nanocrystals (CNCs) was related to CNC diameter by sedimentation method to find a convenient technique for the rapid detection of CNC diameter. The results showed that when the CNC concentration was at 0.2 wt%, the sodium chloride (NaCl) dosage at 40 g/L, and at the standing time of 48 h, the CNC sedimentation performance was the best. Furthermore, with the increase of CNC diameter, the settling height of CNCs gradually decreased. The relationship between CNC diameter and settling height was Y (Settling height) = -30.17 ln(X (CNC diameter)) + 123.64; and the coefficient of determination for the fit was 0.9965. This research provides a new method for the diameter detection of CNCs in the actual CNCs production in enterprises.
DOI: 10.15376/biores.17.4.6941-6952
Keywords: Cellulose nanocrystals; Diameter; Settling height; NaCl dosage
Contact information: a: College of Textile Science and Engineering (International Institute of Silk), Zhejiang Sci-Tech University, Hangzhou, 310018, China; b: Zhejiang Jinze Paper Technology Co., Ltd., Quzhou, 324404, China; *Corresponding author: xinxingxia2000@hotmail.com
GRAPHICAL ABSTRACT
INTRODUCTION
Nanocellulose (NC) can be defined as a nano-size polymer material with a diameter of 1.0 to 100 nm with a definite aspect ratio (Hambardzumyan et al. 2022). Cellulose nanocrystals (CNCs) are a type of NC, and their morphology is usually rod-shaped, which has the advantages of being renewable and biodegradable, and having large specific surface area, high hydrophilicity, high transparency, high strength, etc. (Sharaby et al. 2022). In addition, it has been widely used in many fields, such as papermaking, medicine, and food (Bangar et al. 2022; Li et al. 2022; Mali and Sherje 2022; Xu et al. 2022). As one of the most important quality indicators of CNCs, the diameter is usually quantified by transmission electron microscopy (TEM), atomic force microscopy (AFM), scanning electron microscopy (SEM), and laser particle size analyzer (Cao and Verian 2017; Zhang et al. 2020; Campano et al. 2021).
The CNC morphology has been primarily observed by SEM, and it was found that the CNCs had a large aspect ratio and the diameter was less than 100 nm (Mocktar et al. 2020). In addition, the CNC agglomeration could be observed in the SEM images, which is caused by the hydrogen bonding force between fibers (Surip et al. 2012). The resolution of TEM is approximately 0.1 to 0.2 nm, and the magnification can reach several million times. Therefore, TEM is more suitable for observing the morphology of nano-size samples than SEM. Onkarappa et al. (2020) used TEM to study the surface morphology of CNCs made from corn husks. They found that the CNCs had a rod-like structure with an average diameter between 14 nm and 29 nm and a length range of a few nm to several hundred nm. In addition, AFM is a powerful analytical instrument for detecting nanocellulose structure. Lahiji et al. (2010) used AFM to study the morphology of the CNCs prepared, and they found that the length of the CNCs was 100 to 300 nm and the diameters were 2 to 8 nm.
Although the CNC morphology can be directly detected by these instruments, the diameter of the sample needs to be analyzed by software such as Nano Measurer, Image J, and NanoScope Analysis, etc. (Zhang et al. 2014; Rha et al. 2015; Zhang et al. 2018). Therefore, the conventional nanocellulose diameter detection method is complex, the detection time is long, and the detection cost is expensive, which seriously limits the large-scale use of nanocellulose. Thus, there is an urgent need to develop a concise method for the diameter detection of nanocellulose.
Boluk et al. (2011) developed a method to determine the shape parameters (length/diameter) of rod-like CNC particles by measuring the viscosity of CNC suspensions. The captured AFM images showed the CNC aggregated and dispersed regions. After analysis, the CNC length was 100 to 300 nm and the diameter was 4 to 8 nm. Ultimately, the shape factors obtained from the intrinsic viscosity measurements were basically in good agreement with the AFM measurements.
A colloid can be defined as a dispersion system that contains dispersoid and dispersant. The diameter of dispersoid particle is in the range of 1.0 to 100 nm. Therefore, nanocellulose suspensions fall within the definition of a colloid. The interaction between colloidal particles is an important factor affecting many properties and behaviors of colloids, including the stability of colloids (Alexander et al. 1984; Grosse et al. 1999) and the disordered and ordered phase transitions of colloids (Mognetti et al. 2013; Yi et al. 2013; Edison et al. 2015). The surface of CNCs has negatively charged sulfonic acid groups. Due to the existence of electrostatic repulsion, CNCs that have been prepared using concentrated sulfuric acid are uniformly and stably distributed in water (Revol et al. 1992; Habibi et al. 2010; Chu et al. 2020). Through the addition of opposite charges, the colloidal particle charge is neutralized, and the colloidal particles aggregate into large particles, thereby causing sedimentation. Thus, when the cationic electrolyte is added to the CNC suspensions, the CNCs will agglomerate and settle. Based on this theory, the authors further explored the relationship between CNC diameter and sedimentation performance.
In this paper, the authors prepared CNCs with different diameters by adjusting the concentration of sulfuric acid in acid hydrolysis, studied the effects of sodium chloride (NaCl) dosage, standing time, CNC concentration, and CNC diameter on the sedimentation performance of CNCs, and established the relationship between CNC diameter and settling height. This research would provide a concise detection method for assessing the CNC diameter.
EXPERIMENTAL
Materials
Microcrystalline cellulose (MCC, diameter 25 μm) was obtained from Shanghai Aladdin Biochemical Technology Co., Ltd. (Shanghai, China). Sulfuric acid (AR grade) and sodium chloride (AR grade) were purchased from Sinopharm Chemical Reagent Co., Ltd. (Shanghai, China).
Methods
Preparation of CNCs
To begin, MCC was mixed with sulfuric acid solutions of different concentrations at a solid-liquid ratio of 1:10 (g: mL), which was then reacted at 50 °C for 1.5 h. Afterwards, the mixture was centrifuged and washed several times with de-ionized water. The CNCs on the upper layer of the centrifuge tube were collected and dialyzed in a dialysis bag (MW: 8000-14000) until the filtrate was neutral; thus CNCs with various diameters were obtained (Gil-Castell et al. 2022; Zubair et al. 2022). The samples were numbered as shown in Table 1.
Table 1. Sample Number of CNCs

TEM analysis of CNCs
The morphology of CNCs were studied by TEM (JEM-1400Flash, JEOL Ltd., Tokyo Japan). The CNC suspension (1 wt%) was prepared, and 10 μL of CNC suspensions was dropped on the surface of copper grid. Then, 10 μL of uranyl acetate solution (2 wt%) was added dropwise, stained for 2 to 3 min, the dye was sucked out with filter paper, and CNCs were dried at room temperature. Finally, the CNC image was obtained by TEM at an accelerating voltage of 120 KV (Campano et al. 2021).
CNC Diameter Measurement
The diameters of 8 kinds of prepared CNCs were measured in the TEM image using the Image J (200 CNCs were measured in each image) software, and the obtained data were analyzed using the Origin software (OriginLab, OriginPro 2021, Northampton, MA, USA).
NaCl dosage
A total of 0.2 g nanocellulose (CNCs-8) was added to 100 mL NaCl solution, mixed well, placed in a 100-mL graduated cylinder, and allowed to stand for 48 h to observe the settling height. Various dosages of NaCl, such as 0, 10, 20, 30, 40, and 50 g/L, were used.
Standing time
For this study, the 0.2 wt% CNCs-8 and a NaCl dosage of 40 g/L was used, which was placed in a 100-mL graduated cylinder, and the effect of standing time on the settling height was observed.
CNC concentration
Various concentrations of CNCs-8, such as 0.05 wt%, 0.1 wt%, 0.2 wt%, 0.3 wt%, and 0.4 wt%, and NaCl dosage of 40 g/L, and the standing time of 48 h were used to observe the effect of CNC concentration on the settling height.
Relationship between CNC diameter and settling height
A 0.2 wt% CNCs, NaCl dosage of 40 g/L, and the standing time of 48 h was used. The CNCs with different diameters were placed in a 100-mL graduated cylinder, and the CNC settling height was measured. A scatter chart of CNC diameter and settling height was drawn by Excel software (Microsoft, Microsoft Office Home and Student 2019, Redmond, WA, USA). Furthermore, the logarithmic function was used to fit the data to obtain the function between CNC diameter and settling height.
RESULTS AND DISCUSSION
TEM Analysis of CNCs
Figure 1 shows the TEM images of CNCs prepared under various sulfuric acid concentrations, and the CNCs all appeared rod-shaped. The diameter distributions of CNC-1, CNC-2, CNC-3, CNC-4, CNC-5, and CNC-6 were more dispersed, while those of CNC-7 and CNC-8 were more concentrated (Fig. 2). In addition, with the gradually increasing sulfuric acid concentration during acid hydrolysis, the diameter of the prepared CNCs gradually decreased, as shown in Table 2. This is because of the reaction of sulfuric acid with glucose β-1,4 glycosidic bonds in cellulose macromolecules, and thus the cellulose amorphous region is hydrolyzed (Dong et al. 1998).

Fig. 1. TEM images of a: CNCs-1; b: CNCs-2; c: CNCs-3; d: CNCs-4; e: CNCs-5; f: CNCs-6; g: CNCs-7; and h: CNCs-8
Table 2. Average Diameter of CNCs


Fig. 2. Diameter distribution figures of a: CNCs-1; b: CNCs-2; c: CNCs-3; d: CNCs-4; e: CNCs-5; f: CNCs-6; g: CNCs-7; and h: CNCs-8
Effect of NaCl Dosage on CNC Sedimentation Performance
As shown in Fig. 3a, the settling height of the CNC suspensions gradually decreased with the increase of NaCl dosage. When the NaCl dosage was greater than 20 g/L, the settling height began to decrease noticeably, which indicated that the CNC suspension began to exhibit colloidal instability. When the NaCl dosage was 40 g/L, the sedimentation performance of the CNC suspensions reached the best, and its settling height was 80.2 mL. With the NaCl dosage continued to increase, the settling height hardly changed. Therefore, the optimal dosage of NaCl was 40 g/L.
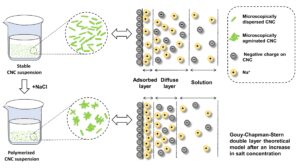
Figure 3b shows the effect of NaCl dosage on the electrokinetic properties of CNC suspensions. It can be seen from Fig. 3b that the CNCs were negatively charged, and with the increase of NaCl dosage, the absolute value of zeta potential decreased gradually. When the NaCl dosage was at 40 g/L, the zeta potential was close to zero. With the addition of NaCl, the electric double layer of the CNC particles was compressed, the negative charge was weakened, then the mutual repulsion force was decreased, and the stability of the CNC suspensions was destroyed, according to the Gouy-Chapman-Stern double layer theoretical model (Fig. 3c) (Jin et al. 2021). This is the reason why the CNC subsidence occurs with the addition of NaCl.

Fig. 3. a: Effect of NaCl dosage on CNC settlement height; b: Effect of NaCl dosage on electrical properties of NCC suspensions; and c: NaCl-induced CNC sedimentation mechanism
Effect of Standing Time on CNC Sedimentation Performance
Figure 4 shows the effect of standing time on the CNC settling height. Within 48 h, the settling height of the CNC suspensions gradually decreased with the increase of time. From 48 to 72 h, the settling height of the CNC suspensions hardly changed with time, and it finally stabilized at around 80.7 mL. Therefore, the reasonable settling time of CNCs was 48 h.

Fig. 4. Effect of standing time on CNC settling height
Effect of CNC Concentration on CNC Sedimentation Performance
The settling height of CNCs increased with increasing CNC concentration (Fig. 5). When the concentration of CNCs were at 0.05 wt% and 0.1 wt%, the settling heights were 38.2 and 57.4 mL, respectively, both less than 60 mL. It was difficult to accurately draw the CNC diameter – settling height curve when the settling height was too low. When the CNC concentrations were at 0.3 and 0.4 wt%, the settling height of the CNC suspensions were 95.7 and 98.8 mL, respectively, and the sedimentation performance of CNCs decreased. Therefore, the optimal concentration of CNCs was selected as 0.2 wt%, and the settling height of CNC-8 was 80.6 mL.

Fig. 5. Effect of CNC concentration on CNC settling height
Relationship Between CNC Diameter and Settling Height
Figure 6 shows the settling height photos for different CNC diameters. When the CNC diameter decreases, the CNC settling height gradually increases. The fitting curve of CNC settling height and diameter is drawn as shown in Fig. 7, and the function was obtained as: Ysettling height = -30.17 lnXCNC diameter + 123.64. The fitting degree was 0.9965. Thus, the diameter of CNCs can be quickly calculated from the settling height.

Fig. 6. The CNC settling height pictures of different diameters

Fig. 7. Relationship between CNC diameter and settling height
CONCLUSIONS
This study showed that the sedimentation of CNC suspensions could be reproducibly brought about by the addition of NaCl to the solution, and that the sedimented CNC layer could be conveniently measured.
- A CNC concentration of 0.2 wt%, NaCl dosage of 40 g/L, and standing time of 48 h achieved the best sedimentation performance of CNCs. (CNCs is prepared from MCC as raw material using 50% to 64% sulfuric acid hydrolysis.)
- With the increase of CNC diameter, the settling height of CNCs gradually decreased. The function between CNC diameter and settling height was Ysettling height = -30.17 lnXCNC diameter + 123.64; The fitting degree was 0.9965. Therefore, this mathematical function is expected to be used as a new method for the rapid detection of CNC diameter.
ACKNOWLEDGMENTS
This work was supported by the Key Research and Development Project of Zhejiang Province (2020C02043).
REFERENCES CITED
Alexander, S., Chaikin, P. M., Grant, P., Morales, G. J., Pincus, P., and Hone, D. (1984). “Charge renormalization, osmostic pressure, and bulk modulus of colloidal crystals,” The Journal of Chemical Physics 80(11), 5776-5781. DOI: 10.1063/1.446600
Bangar, S. P., Harussani, M. M., Ilyas, R. A., Ashogbon, A. O., Singh, A., Trif, M., and Jafari, S. M. (2022). “Surface modifications of cellulose nanocrystals: Processes, properties, and applications,” Food Hydrocolloids 130, article ID 107689. DOI: 10.1016/j.foodhyd.2022.107689
Boluk, Y., Lahiji, R., Zhao, L. Y., and McDermott, M. T. (2011). “Suspension viscosities and shape parameter of cellulose nanocrystals (CNC),” Colloids and Surfaces A: Physicochemical and Engineering Aspects 377(1-3), 297-303. DOI: 10.1016/j.colsurfa.2011.01.003
Campano, C., Lopez-Exposito, P., Gonzalez-Aguilera, L., Blanco, A., and Negro, C. (2021). “In-depth characterization of the aggregation state of cellulose nanocrystals through analysis of transmission electron microscopy images,” Carbohydrate Polymers 254, article ID 117271. DOI: 10.1016/j.carbpol.2020.117271
Cao, Y. Z., and Verian, K. P. (2017). “A VEDA simulation on cement paste: Using dynamic atomic force microscopy to characterize cellulose nanocrystal distribution,” MRS Communications 7(3), 672-676. DOI: 10.1557/mrc.2017.57
Chu, G., Vasilyev, G., Qu, D., Deng, S. W., Bai, L., Rojas, O. J., and Zussman, E. (2020). “Structural arrest and phase transition in glassy nanocellulose colloids,” Langmuir 36(4), 979-985. DOI: 10.1021/acs.langmuir.9b03570
Dong, X. M., Revol, J.-F., and Gray, D. G. (1998). “Effect of microcrystallite preparation conditions on the formation of colloid crystals of cellulose,” Cellulose 5(1), 19-32. DOI: 10.1023/A:1009260511939
Edison, J. R., Tasios, N., Belli, S., Evans, R., van Roij, R., and Dijkstra, M. (2015). “Critical casimir forces and colloidal phase transitions in a near-critical solvent: A simple model reveals a rich phase diagram,” Physical Review Letters 114(3), article ID 038301. DOI: 10.1103/PhysRevLett.114.038301
Gil-Castell, O., Reyes-Contreras, P., Barra, P. A., Mendonca, R. T., Carrillo-Varela, I., Badia, J. D., Serra, A., and Ribes-Greus, A. (2022). “The role of eucalyptus species on the structural and thermal performance of cellulose nanocrystals (CNCs) isolated by acid hydrolysis,” Polymers 14(3), article ID 423. DOI: 10.3390/polym14030423
Grosse, C., Pedrosa, S., and Shilov, V. N. (1999). “Calculation of the dielectric increment and characteristic time of the LFDD in colloidal suspensions of spheroidal particles,” Journal of Colloid and Interface Science 220(1), 31-41. DOI: 10.1006/jcis.1999.6486
Habibi, Y., Lucia, L. A., and Rojas, O. J. (2010). “Cellulose nanocrystals: Chemistry, self-assembly, and applications,” Chemical Reviews 110(6), 3479-3500. DOI: 10.1021/cr900339w
Hambardzumyan, A., Vayer, M., Foulon, L., Pernes, M., Devers, T., Bigarre, J., and Aguie-Beghin, V. (2022). “Nafion membranes reinforced by cellulose nanocrystals for fuel cell applications: Aspect ratio and heat treatment effects on physical properties,” Journal of Materials Science 57(7), 4684-4703. DOI: 10.1007/s10853-022-06921-6
Jin, S. A., Facchine, E. G., Khan, S. A., Rojas, O. J., and Spontak, R. J. (2021). “Mesophase characteristics of cellulose nanocrystal films prepared from electrolyte suspensions,” Journal of Colloid and Interface Science 599, 207-218. DOI: 10.1016/j.jcis.2021.04.071
Lahiji, R. R., Xu, X., Reifenberger, R., Raman, A., Rudie, A., and Moon, R. J. (2010). “Atomic force microscopy characterization of cellulose nanocrystals,” Langmuir 26(6), 4480-4488. DOI: 10.1021/la903111j
Li, Y. C., Yu, D. H., Wang, X. Y., Wang, Q., Zhang, Z., and Liu, W. X. (2022). “Lauric arginate/cellulose nanocrystal nanorods-stabilized alkenyl succinic anhydride pickering emulsion: Enhancement of stabilization and paper sizing performance,” Cellulose 29(6), 3253-3269. DOI: 10.1007/S10570-022-04502-Z
Mali, P., and Sherje, A. P. (2022). “Cellulose nanocrystals: Fundamentals and biomedical applications,” Carbohydrate Polymers 275, article ID 118668. DOI: 10.1016/J.CARBPOL.2021.118668
Mocktar, N. A., Razab, M. K. A. A., Noor, M., and Abdullah, N. H. (2020). “Preparation and characterization of kenaf and oil palm nanocellulose by acid hydrolysis method,” Materials Science Forum 1010, 495-500. DOI: 10.4028/www.scientific.net/MSF.1010.495
Mognetti, B. M., Saric, A., Angioletti-Uberti, S., Cacciuto, A., Valeriani, C., and Frenkel, D. (2013). “Living clusters and crystals from low-density suspensions of active colloids,” Physical Review Letters 111(24), article ID 245702. DOI: 10.1103/PhysRevLett.111.245702
Onkarappa, H. S., Prakash, G. K., Pujar, G. H., Kumar, C. R. R., Radha, V., and Betageri, V. S. (2020). “Facile synthesis and characterization of nanocellulose from Zea mays husk,” Polymer Composites 41(8), 3153-3159. DOI: 10.1002/pc.25606
Revol, J.-F., Bradford, H., Giasson, J., Marchessault, R., and Gray, D. (1992). “Helicoidal self-ordering of cellulose microfibrils in aqueous suspension,” International Journal of Biological Macromolecules 14(3), 170-172. DOI:10.1016/S0141-8130(05)80008-X
Rha, E. Y., Kim, J. M., and Yoo, G. (2015). “Volume measurement of various tissues using the Image J software,” Journal of Craniofacial Surgery 26(6), E505-E506. DOI: 10.1097/SCS.0000000000002022
Sharaby, M., Soliman, E., Abdel-Rahman, A., Egiza, A., and Khalil, R. (2022). “Valorization of cotton wastes for production of cellulose nanocrystals,” Materials Science Forum 1053, 405-409. DOI: 10.4028/p-7369dc
Surip, S. N., Wan Jaafar, W., Azmi, N., and Anwar, U. (2012). “Microscopy observation on nanocellulose from kenaf fibre,” Advanced Materials Research 488-489, 72-75. DOI: 10.4028/www.scientific.net/AMR.488-489.72
Xu, D. Z., Cheng, Y. A., Wu, S., Zou, Q. X., Mondal, A. K., Ning, D. W., and Huang, F. (2022). “Study on the effect of tunicate cellulose nanocrystals in the preparation of sodium alginate-based enteric capsule,” Cellulose 29(4), 2497-2511. DOI: 10.1007/S10570-022-04445-5
Yi, G.-R., Pine, D. J., and Sacanna, S. (2013). “Recent progress on patchy colloids and their self-assembly,” Journal of Physics: Condensed Matter 25(19), article ID 193101. DOI: 10.1088/0953-8984/25/19/193101
Zhang, T., Mahgsoudy-Louyeh, S., Tittmann, B., and Cosgrove, D. J. (2014). “Visualization of the nanoscale pattern of recently-deposited cellulose microfibrils and matrix materials in never-dried primary walls of the onion epidermis,” Cellulose 21(2), 853-862. DOI: 10.1007/s10570-013-9996-1
Zhang, L., Zhou, Y., Jin, X., Du, X. Y., and Li, B. S. (2018). “The microstructure and high-temperature properties of novel nano precipitation-hardened face centered cubic high-entropy superalloys,” Scripta Materialia 146, 226-230. DOI: 10.1016/j.scriptamat.2017.12.001
Zhang, Y. Q., Xu, Y. J., Yue, X. P., Dai, L., Gao, M. L., and Zhi, Y. (2020). “A new approach for the preparation of cellulose nanocrystals from bamboo pulp through extremely low acid hydrolysis,” TAPPI Journal 19(1), 21-27. DOI: 10.32964/TJ19.1.21
Zubair, M., Mu’azu, N. D., Nasir, M., Manzar, M. S., Aziz, M. A., Saleem, M., and Al-Harthi, M. A. (2022). “Cellulose nanocrystals from office paper waste for green mortar: Process optimization modeling, characterization, and mechanical properties,” Arabian Journal for Science and Engineering 47(4), 5377-5393. DOI: 10.1007/s13369-022-06609-8
Article submitted: September 21, 2022; Peer review completed: October 15, 2022; Revised version received and accepted: October 20, 2022; Published: October 25, 2022.
DOI: 10.15376/biores.17.4.6941-6952