
Abstract
This paper presents the effects of a low velocity impact test on the hybrid composites of kenaf and Kevlar. In recent years, there has been a trend to replace the synthetic fibers, used as reinforcement in epoxy composites formation, with natural fibers due to their low cost, high flexibility, biodegradability, and recyclability. In order to surpass the low mechanical strength of natural fibres in comparison to the conventional composites, hybrid composites combining both types of fibres was introduced. This combination will lead to improvement in the mechanical strength and biodegradability of epoxy composites, which is important for waste reduction and protection of the environment. The materials were fabricated in a seven-layer laminate configuration utilizing a ratio of 3:1:3 (Kevlar:kenaf:Kevlar) for a hybrid composite. This combination earlier had been found to give the best tensile test performance. An original composite with seven layers of kenaf (full kenaf) and one with seven layers of Kevlar (full Kevlar) were also prepared for comparison. The selected specimens underwent a low velocity impact test with variations in energy. The failure mode was observed. The results showed that a seven layer laminate only withstood an impact energy below 30 Joules, and it failed when the impact energy approached 40 Joules. The hybrid composites approached the quality performance of full Kevlar and exhibited better mechanical properties than full kenaf composites. Therefore, the novel hybrid composites can be used for product development in environmentally friendly technologies.
Download PDF
Full Article
A Study on the Low Velocity Impact Response of Hybrid Kenaf-Kevlar Composite Laminates through Drop Test Rig Technique
Muhammad F. Ismail,a,* Mohamed T. H. Sultan,a,b,* Ahmad Hamdan,a and U. Md Shah a
This paper presents the effects of a low velocity impact test on the hybrid composites of kenaf and Kevlar. In recent years, there has been a trend to replace the synthetic fibers, used as reinforcement in epoxy composites formation, with natural fibers due to their low cost, high flexibility, biodegradability, and recyclability. In order to surpass the low mechanical strength of natural fibres in comparison to the conventional composites, hybrid composites combining both types of fibres was introduced. This combination will lead to improvement in the mechanical strength and biodegradability of epoxy composites, which is important for waste reduction and protection of the environment. The materials were fabricated in a seven-layer laminate configuration utilizing a ratio of 3:1:3 (Kevlar:kenaf:Kevlar) for a hybrid composite. This combination earlier had been found to give the best tensile test performance. An original composite with seven layers of kenaf (full kenaf) and one with seven layers of Kevlar (full Kevlar) were also prepared for comparison. The selected specimens underwent a low velocity impact test with variations in energy. The failure mode was observed. The results showed that a seven layer laminate only withstood an impact energy below 30 Joules, and it failed when the impact energy approached 40 Joules. The hybrid composites approached the quality performance of full Kevlar and exhibited better mechanical properties than full kenaf composites. Therefore, the novel hybrid composites can be used for product development in environmentally friendly technologies.
Keywords: Kenaf; Kevlar; Hybrid; Layered composite; Low Velocity Impact Test
Contact information: a: Aerospace Manufacturing Research Centre, Faculty of Engineering, Universiti Putra Malaysia, 43400 UPM Serdang, Selangor Darul Ehsan, Malaysia; b: Laboratory of Biocomposite Technology, Institute of Tropical Forestry and Forest Products (INTROP), Universiti Putra Malaysia, 43400 UPM Serdang, Selangor Darul Ehsan, Malaysia;
* Corresponding author: faizzdeen.ismail@gmail.com; thariq@upm.edu.my
INTRODUCTION
The production of next-generation materials from renewable sources is a growing area of research and development. These materials can be alternatives to non-renewable sources when these sources are not available to meet our demands in the next century. These products involve the integration of global environmental factors with the principles of sustainability and industrial ecology in order to exhibit eco-efficiency and green engineering. Composite materials, especially renewable composites, fit well into this paradigm shift (FAO 2013).
Composite industries typically develop small-scale products and then scale them up in accordance with demands and availability of the necessary supplies. Research interests in both natural and synthetic fibers are rapidly growing. However, natural fibers are considered to be the next generation of fibers for composite manufacturers because they have the potential to replace synthetic fibers. The advantages of natural fibers over synthetic fibers are their lower cost, lower density, and a specific strength that is acceptable (FAO 2013).
Natural fibers are raw materials from plants and animals that can be transformed into filament, thread, or rope. They can be further processed into woven, knitted, matted, and bound configurations. The availability and quality of the materials, as well as their consistency and environmental friendliness, have increased the popularity of natural fibers (Mohanty et al. 2005). Because the fibers are biodegradable, they release little to no pollution or greenhouse gasses during a cycle of production and utilization (Azmi and Derashid2012).
The properties of natural fibers are closely dependent on the environment in which they were grown, including temperature, humidity, air, soil composition, and other environmental effects that affect the height, strength, and density of the plants (HIS 2015). The tensile strength and the Young’s modulus of natural fibers is lower than that of fibers used in composites materials. However, the specific strength and the density are quite comparable (FAO 2013). This research examined lightweight and cost-effective materials to find those that exhibit similar mechanical and physical properties to their sources as well as preserving natural resources. This study serves the industry by providing an insight into the low velocity impact behaviour of kenaf and Kevlar hybrid composites.
Kenaf Fibre
One of the most consumed natural fibers is kenaf. Kenaf, or Hibiscus cannabinus L., is an annual herbaceous plant originating from west Africa. This warm season and short-day plant has been cultivated since 4000 B.C. Kenaf has a high growth rate, with the ability to rise from 12 feet to 18 feet in 4 to 5 months (Wigotsky 2002; FAO 2013). Kenaf contains two fiber types, long and short. Kenaf consists of 44 to 57% cellulose and 15 to 19% of lignin, with mean dimensions of 2.6 mm (length) and 0.02 mm (width). Lignin acts as a resin that binds together cellulose fibers inside plants (FAO 2013).
Kenaf fibers can be used as reinforcing fibers for composites. Kenaf sheets have similar anisotropic mechanical properties to composite sheets. The tensile strength and Young’s modulus of kenaf fibers are lower but still comparable to those of composites. Therefore, kenaf fibers have good potential to replace current reinforcement materials in high-performance biodegradable composites (Wigotsky 2002; FAO 2013; Hamdan et al. 2016).
Kevlar Fibre
Synthetic fibers are used to improve naturally existing animal and plant fibers. There are hundreds of types of synthetic fibers; polyester and nylon are the two most common. Previously, most of the studies performed on the woven form of textile composites have been with synthetic fibre, rather than natural fibre (Azrin et al. 2013). Several advantages of synthetic fibers are their low absorbency, thermoplastic, abrasion-resistant, and availability (Yang 1994). In comparison with natural fibers, synthetic fibers are much more durable, stronger, easier to maintain, and washable.
Other typical synthetic fibres are fiberglass including E-glass and S-glass, carbon fibre, boron, and Kevlar (aramid). Carbon fibres have lower specific gravity and high performance of tensile strengths compared to fiberglass. Kevlar is two times stronger than fibreglass and ten times stronger than aluminium (Kaw 2006). Their productions undergo several steps, involving chemical processing, spinning, twisting, and packaging. A comparison of its properties with other fiber types is provided in Table 1.
Table 1. Comparison of Fibre Properties

Kevlar belongs to the subclass of the nylon family called aramid fibers. Kevlar is used in a wide range of applications, especially in polymer engineering, and it is included in bulletproof vests, combat helmets, gloves, jeans, and jackets. For example, in military applications, this synthetic fibre is used in the production of combat helmets and bulletproof vests, which benefit from Kevlar’s high strength. However, the relatively high weight and expensive nature of Kevlar are regarded as limitations. The optimal design requires a balance between the need for protection from trauma and the comfort and practicality of the combat helmets and bulletproof vest for the users to ensure the best outcomes (CSIR 2009).
Kevlar fully resists rusting or corrosion, and it absorbs vibrations. The multiple cross-linking of internal fibers makes it able to withstand any kind of force. Kevlar’s tensile strength is five times higher than that of steel. Hence, Kevlar is amongst the best component in advanced composites due to its tensile modulus. Kevlar also has a lowest specific gravity, and it is the only fiber available for structural applications (Balaguru et al. 2008). However, because special precaution is required to handle the concentrated sulfuric acid used in its production, Kevlar has higher production costs. Furthermore, Kevlar has low compressive strength, is difficult to machine, and is complicated to handle. The general mechanical properties and specific properties of Kevlar are 1.44 g/cm³ in density, 2800 MPa in strength, and 124 MPa in stiffness (Yang 1994). Table 2 shows the different properties of Kevlar with respect to different type of Kevlar. Overall types of Kevlar is acceptable for use as a synthetic fibre in composites applications in terms of tensile strength and density, where their range meet the general properties of Kevlar respectively as being described by Yang 1994 in previous specific properties.
Table 2. Different Properties for Different Type of Kevlar

There are substantial demands for lightweight and cost-effective materials in terms of improving environmental friendly outcomes (Sharba et al. 2016). Such goals can be achieved by reducing its costs and modifying its materials, such as implementing a hybrid kenaf-Kevlar composite material (Razali et al. 2014). The usage of composites has the potential for reducing the weight by up to 80% for steel parts and 20% to 50% for aluminum components (Gombos 2010). The use of natural fibers as a renewable material reduces the use of synthetic fibers (Safri et al. 2014), which preserves natural resources.
Low Velocity Impact
The most critical damage caused by impact are holes and cracks, which may reduce strength (Horton and McCarty 1993). The residual tensile strength also decreases substantially due to fiber cracks in the impact contact zone (Christoforou 2001; Razali et al. 2014). Another consequence of impact damage is delamination. Delamination is in the state of a microscopic effect that is difficult to be inspect visually. Delamination may also reduce the residual compressive strength (Kaw 2006; Safri et al. 2014). Delamination represents debonding between the layers of fiberglass. It is caused by high interlaminar stresses and relatively low interlaminar strengths in conjunction with typically very low through thickness strength. Therefore, delamination reduces the strength of composite materials (Maio et al. 2013; Safri et al. 2014; Sharba et al. 2016). Delamination only occurs at interfaces between layers that have different fiber orientations (Abrate 1998; Safri et al. 2014).
There are several factors that contribute to impact failure. The factors are fibre/matrix adhesion, reinforcement properties, thickness, and matrix properties (Fox et al. 2009). Almost all impacts cause damage to the material as well as the stiffness and strength of the material. Several researchers recently investigated low velocity impact damage in composites (Nguyen et al. 2013; Razali et al. 2014; Safri et al. 2014). Low velocity impact is one of the impact responses caused by a large mass impact. While the impact velocity is low, the total mass of the impact is larger (Abrate 1998; Safri et al. 2014). Low velocity impact occurs at a velocity stated below 10 m/s. An example of an impact with low velocity is tool drops (Vaidya 2011). Composites subjected to a low velocity impact may experience internal delamination (Aslan et al. 2002), which is hazardous because the damage to the impact area is invisible (Chowdury and Jeelani 2007; Safri et al. 2014). Furthermore, in advanced composite materials research, impact loading can cause significant internal structural damage, resulting in the loss of stiffness and strength (Trowbridge et al. 2012).
EXPERIMENTAL
Woven kenaf fibers and woven Kevlar were utilized for this research. The matrix used was epoxy type Zeepoxy HL002TA (My East, Selangor, Malaysia), which was cured with Zeepoxy HL002TB hardener (My East, Selangor, Malaysia). The resin and hardener were prepared with a 2:1 ratio for slow curing epoxy resin and hardener mixtures (US Comp. 2010). The rationale for the ratio stated is that slow curing should be only used at temperatures up to 80 °C for 2 h unless an extremely long curing time is needed. The two epoxy resin components were stirred constantly until the solution became non-viscous. The mixture of epoxy resin ingredients to the weight of the seven layers panel used a 35:65 percentage ratio (US Comp. 2010). A square panel plate with the dimensions of 350 mm × 350 mm was fabricated using specific layer combinations.
There were three combination layers (Fig. 1), seven layers of full kenaf (Ke = 7), seven layers of full Kevlar (Kv = 7), and seven layers of hybrid kenaf-Kevlar composites (Kv:Ke:Kv = 3:1:3). A layer of kenaf had the thickness of 2 mm, while a layer of Kevlar was 0.57 mm thick. The amount of layering was kept constant at seven layers, where the thickness of each sample may be different from each other, as indicated in Table 3. Several combinations of hybrid stacking sequences were made in this seven layer arrangement. Earlier findings on tensile performance clearly showed that the combination of 3Kv:1Ke:3Kv, in which one layer of kenaf is arranged in the middle, provided the best performance, and therefore such a condition is included to this paper.

Fig. 1 Specimens of (a) full kenaf; (b) full Kevlar; and (c) hybrid kenaf-Kevlar

Fig. 2. Specimen left for 24h (one day)
The specimen (Fig. 2) was left for 24 h and cured for 120 min. The cured specimens were cut into specific dimensions following the test requirement, for example, 100 mm × 150 mm dimensions for a drop test or a low velocity impact test (LVIT). The test specimen was prepared in a rectangular shape plate (Fig. 3) with the dimensions provided by the Boeing Specification Support Standard BSS 7260 (1988), i.e., 101.6 mm × 152.4 mm (± 1 mm to 3 mm offset). The cutting process used a CNC machine (AC MECA, Johor, Malaysia) and a grinding machine to obtain accurate dimensions and avoid cracking.

Fig. 3. Specimen ready to undergo drop test
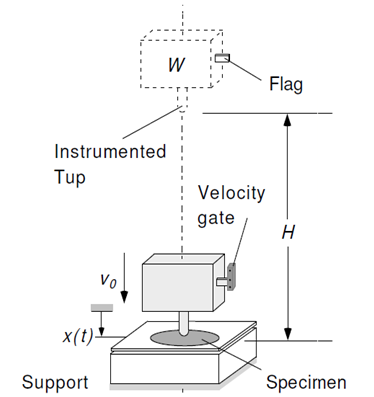
Fig. 4. Drop weight impact test machine principal
Low velocity impacts rely on the principle of drop weight (Fig. 4), inspired by the first law of vibrations, the static mode (Elber 1983). The contact force duration is longer than the time required for the impact wave to reach its limit and return back to its original position. Therefore, the higher modes can be neglected. This phenomenon can be similarly described as an energy balance model in which the total energy of the system is conserved, while the higher vibration modes, friction, and other losses of energy are neglected (Kim et al. 2012).
The low velocity impact test was conducted using a drop test machine (Fig. 5) model (Imatek Ltd, type 8000D, model D5000, Knebworth, UK) (Razali and Sultan 2015). This machine is available at the Aerospace Materials Laboratory, UPM (Selangor, Malaysia). The principal of testing is portrayed in Fig. 1 where the test specimens being clamped at all four ends (Fig. 6). The impact energy varies from 10 J up to 40 J in increments of 10. The formula for gravitational potential energy is stated in Eq. 1,
F = mg (1)
where F is force (kN), m is mass (g), g is gravity (m/s), and h is the height (m) of the striker before release for impact to the specimen depending on the value of impact energy (Table 3).
Table 3. Height of the Striker and its Impact Energy


Fig. 5. Drop test for LVIT

Fig. 6. Test specimens being clamped all four ends and adjusted to the center of striker
RESULTS AND DISCUSSION
The specimens were selected for the drop test. Different specimens for the LVIT testing were used. The conservation of energy is related with the free downfall phenomenon. There are three conditions in which the free fall take place: The first condition is free fall, stop and rebound. The second condition is free fall and stop, and the third condition is free fall and perforation.
The amount of absorbed energy (Table 4) for three different specimens was tabulated. The graph of force versus displacement was tabulated from the average data collected for each specimen of full kenaf, full Kevlar, and hybrid specimens accordingly. The graphical results of force versus displacement from the impact test were compared for all the specimens with different impact energy.
Table 4. Technical Data Collected for All Specimens


Fig. 7. Graph of forces against displacement for absorbed energy of 10 Joules
A closed curve from the graph showed that the striker during testing did not penetrate the specimen. An open curve from the same graph showed that the striker had penetrated the specimen. The highest tip of the curve represents maximum impact energy, while the end of the curves represents the absorbed energy. When the maximum displacement is achieved, the sample transfer elastically the excess impact energy back to the striker, where bounce phenomenon between striker and the sample occurs. The rebound of the striker when in contact to the sample is the differences between maximum impact energy and the absorbed energy.
The graph of force against displacement (Fig. 7), shows closed curves, which imply the non-penetration of the specimen by the striker. For full kenaf with a thickness of 14 mm, the absorbed energy was 3.71 J, which was slightly lower than the absorbed energy of full Kevlar with a thickness of 4 mm (7.91 J). The mechanical properties of the kenaf and Kevlar hybrid composites were almost similar to the performance of full Kevlar, which exhibited better performance than full kenaf. The hybrid kenaf and Kevlar fibre composites with a thickness of 6 mm had an absorbed energy of 7.65 J. A smaller thickness corresponded to a higher absorbed energy. Thus, it was assumed that a seven layer arrangement can withstand the impact energy of 10 Joule.

Fig. 8. Graph of forces against displacement for absorbed energy of 20 Joules
The graph of force against displacement (Fig. 8) shows that the closed curve results from the non-penetration of the specimen by the striker. For full kenaf with a thickness of 14 mm, the absorbed energy was 11.66 J; this was slightly lower than the absorbed energy of full Kevlar with a thickness of 4 mm, which was 17.17 J. The mechanical properties of the kenaf and Kevlar hybrid composites were almost similar to the performance of full Kevlar and exhibited better performance than kenaf alone. Hybrid composites of kenaf and Kevlar fibres with a thickness of 6 mm had an absorbed energy of 15.74 J. As the thickness of the specimen decreased, the absorbed energy increased. It was assumed that a seven layer arrangement can withstand an impact energy of 20 J.
The graph of force against displacement (Fig. 9) shows that the closed curve results from the non-penetration of the specimen by the striker. For full kenaf with a thickness of 14 mm, the absorbed energy was 20.55 J, slightly lower than the average energy of full Kevlar with a thickness of 4 mm, which was 27.25 J. These results indicated that the mechanical properties of the kenaf and Kevlar hybrid composites were almost similar to full Kevlar and exhibited better performance than kenaf alone. Hybrid composites of kenaf and Kevlar fibres with a thickness of 6 mm had an energy of 25.25 J. As the thickness of the specimen decreased, the absorbed energy increased. Thus, it was assumed that a seven layer arrangement can withstand the impact energy of 30 Joules.

Fig. 9. Graph of forces against displacement for absorbed energy of 30 Joule

Fig. 10. Graph of forces against displacement for absorbed energy of 40 Joule
The graph of force against displacement (Fig. 10) shows that the open curve was obtained as a result of the striker penetrating the specimen during testing. For full kenaf with a thickness of 14 mm, the absorbed energy was 30.83 J; this was slightly lower than the absorbed energy of full Kevlar with a thickness of 4 mm, which was 36.69 J. Hybrid composites of kenaf and Kevlar fibres with a thickness of 6 mm had an energy of 35.24 J. Thus, it was assumed that a seven layer arrangement cannot withstand an impact energy more than 30 Joules.
As mentioned earlier, a closed curve represents the incident energy that was fully transferred to the specimen after maximum displacement is achieved. The open curve shows after maximum displacement is achieved, the incident energy did not fully transfer to the specimen itself. The specimen transferred the impact energy stored back to the impactor elastically after it reached maximum displacement. According to the principle of energy conservation, the energy absorbed by the specimen is equivalent to the energy that is apply to the damage (Boeing 2010). Therefore, a severely damaged specimen would have high absorbed energy directly proportional to the incident impact energy.
All of the graphs showing force versus displacement for each specimen indicate the area under the graph as a result of the energy absorption. The graph of force (kN) against displacement (mm) represents the energy absorbed during the impact test. Once the mass hit the specimen, the specimen absorbed the energy exerted by the impact. This shows that the specimen was capable of withstanding a dedicated impact force. A higher impact resulted in higher energy absorption and increased damage area. The larger damaged area affects the residual properties of the structure, hence reducing the strength and ability of the specimen to withstand impact force.
The hybrid specimen showed comparable output to full Kevlar and full kenaf specimens at all energy impacts. The same trends of open and closed curves occurred for full kenaf, full Kevlar, and hybrid specimens. The point at which the force curve returns to zero is the point where the maximum deflection occurs (Tita et al. 2008). The highest tip of the curve represents maximum impact energy at the point where maximum deflection occurs, while the end of the curves represents the absorbed energy. Thus, it was assumed that a seven layer arrangement could only withstand the impact energy up until 30 Joules, and it would be penetrated when the impact energy approaches 40 Joules. The results obtained from the experiment prove that the mechanical properties of the kenaf and Kevlar hybrid composites were similar the performance of full Kevlar, therefore exhibiting better performance than kenaf alone.
Damage analysis through the thickness of sample and the energy absorbed by the samples were further studied after the drop testing. Delamination or the debonding between the arrangement of the seven layer reduced the strength of the specimen as in Fig. 11 (a), (b), and (c) and also Fig. 12 (a), (b), and (c). Matrix cracks are observed from tensile cracks and shear cracks. For this test, the specimen has a lowest thickness, and matrix cracks as in Fig. 13 (a), (b), and (c) will occur at the lowest layer, starting a pattern of matrix cracks and delaminations. The size and shape of the delaminations and the presence of matrix cracks and fibre cracks (Fig. 14 (a), (b), and (c)) were detected by visual observation and by using microscopic view.

(a)

(b)

(c)
Fig. 11. Delamination of full kenaf (a); full Kevlar (b) and hybrid of kenaf-Kevlar for absorbed energy of 10 Joule

(a)

(b)

(c)
Fig. 12. Delamination of full kenaf (a); full Kevlar (b) and hybrid of kenaf-Kevlar for absorbed energy of 20 Joule

(a)

(b)

(c)
Fig. 13. Matrix cracking of full kenaf (a); full Kevlar (b) and hybrid of kenaf-Kevlar for absorbed energy of 30 Joule

(a)

(b)

(c)
Fig. 14. Fibre cracking of full kenaf (a); full Kevlar (b) and hybrid of kenaf-Kevlar for absorbed energy of 40 Joule
CONCLUSIONS
- Different types of fibre combinations exhibited different results in the low velocity impact test. The fibre properties affected the stiffness of the structure, and while in contact during an impact the stiffness had a significant effect on the dynamic response of the structure.
- The impact dynamics of the specimen is influenced by its thickness. Hybrid composite materials have an advantage in their lightweight and low-cost characteristics, which meet the requirement properties of the material.
- The overall performance of the full Kevlar layer is superior to a full kenaf layer. Hence, the poor performance could be improved by introducing a kenaf-Kevlar hybrid composite for impact applications.
- These results indicate the potential of kenaf-Kevlar hybrid composites as an alternative to existing materials.
ACKNOWLEDGMENTS
The authors thank Universiti Putra Malaysia for the close collaboration provided through the Grant Putra GP-IPB grant No. 9490600. Special thanks to Aerospace Manufacturing Research Centre (AMRC) Universiti Putra Malaysia and also to the Laboratory of Biocomposite Technology, Institute of Tropical Forestry and Forest Products (INTROP-HiCOE).
REFERENCES CITED
Abrate, S. (1998). “Impact on sandwich structures,” in: Impact on Composite Structures, Cambridge University Press, Cambridge, UK, pp. 240-257.
Aslan, Z., Karakuzu, R., and Sayman, O. (2002). “Dynamics characteristics of laminated composites plate subjected to low velocity heavy mass impact,” Journal of Composite Materials 36(21) 2421-2442. DOI: 10.1177/0021998302036021672
Azmi, A., and Derashid, Z. (2012). “What is kenaf?,” (http://www.kenafeverise.com.my/Kenaf_Everise.html/), Accessed on 17 April 2015.
Azrin, H, A. R., Chan, T. S., Roslan, A., and Mariatti, J. M. (2013). “Impact and flexural properties of imbalance plain woven coir and kenaf composite,” Applied Mechanics and Materials 271-272, 81-85.
Balaguru, P., Nanni, A., and Giancaspro, J. (2008). FRP Composites for Reinforced and Prestressed Concrete Structures, CRC Press, Boca Raton, FL, USA.
Boeing (1988). “Boeing specification support standard BSS 7260,” in: Advance Compression Tests Conference, Seattle, USA.
Boeing (2010). “AERO – Boeing 787 from the ground up,” (http://www.boeing.com/commercial/aeromagazine/articles/qtr_4_06/article_04_2.html), Accessed on 23 March 2015.
Chowdury, F., and Jeelani, S. (2007). “Low velocity impact response and ultrasonic NDE of nanoclay nanocomposites,” Journal of Composite Materials 41(18) 2195-2212. DOI: 10.1177/0021998307074146
Christoforou, A. P. (2001). “Impact dynamics and damage in composite structures,” Composite Structures 52, 181-188. DOI: 10.1016/S0263-8223(00)00166-5
Council for Scientific and Industrial Research (CSIR) (2009). “What are natural fibres?,” (http://www.csir.co.za/Grips/fibres.html), Accessed on 23 July 2015.
Elber, W. (1983). Failure Mechanics in Low-Velocity Impacts on Thin Composite Plates (NASA Tech Paper 2152), (https://ntrs.nasa.gov/archive/nasa/casi.ntrs.nasa.gov/19830016291.pdf), Accessed on 9 April 2014.
Food and Agriculture Organization of United Nations (FAO) (2013). Application of Natural Fibre Composites in the Development of Rural Societies, (www.fao.org/docrep/007/ad416e/ad416e00.htm), Accessed on 10 January 2016.
Fox, B. L., Gao, D., Stevenson, A. W., and Zhang, J. (2009). “Inspection of drop-weight impact damage fabricates by different processes,” Journal of Composite Materials, 43(19), 1939-1946. DOI: 10.1177/0021998308078686
Gombos, Z. (2010). Analysis of Glass Fiber Mat Structures and their Impact on The Resin Absorption Process and on the Characteristics of Composites, Budapest University of Technology and Economics, Budapest, Hungary.
Hamdan, A., Mustapha, F., Ahmad, K. A., Ishak, M. R., and Ismail, A. E. (2016). “The effect of customized woven and stacked layer orientation on tensile and flexural properties of woven kenaf fibre reinforced epoxy composites,” International Journal of Polymer Science 2016(2016) 1-11 DOI: 10.1155/2016/6514041
Horton, R. E., and McCarty, J. E. (1993). “Damage tolerance of composites,” in: Engineered Materials Handbook, ASM International, Russell Township, OH, USA pp. 259-267.
IHS Engineering 360 (2015). “Synthetic fibres and fabrics information,” (http://www.globalspec.com/learnmore/materials_chemicals_adhesives/composites_textiles_reinforcements/synthetic_fibers_fabrics_polymer_textiles), Accessed on 23 August 2015.
Kaw, A. K. (2006). Mechanics of Composite Materials, CRC Press, Boca Raton, FL, USA.
Kim, H., Halpin, J. C., and DeFrancisci, G. K. (2012). “Impact damage of composite structure,” in: Long-Term Durability of Polymeric Matrix, Springer, New York, NY, pp. 143-180.
Maio, L., Monaco, E., Ricci, F., and Lecce, L. (2013). Simulation of Velocity Impact on Composite Laminates, University of Naples, Naples, Italy.
Mohanty, Amar, Misra, M., Drzal, L., Selke, S., Harte, B., and Hinrichsen, G. (2005). Natural Fibres, Biopolymers, and Biocomposites, CRC Press, Boca Raton, FL, USA.
Nguyen, S., James, T., Iannucci, L., and Campus, S. K. (2013). “Low, medium and high velocity impact on composites,” in: 16th International Conference on Composite Structures, London, UK.
Razali, N., and Sultan, M. T. H. (2015). “The study of damage area and non-destructive testing on glass fibre reinforce polymer after low velocity impact event,” Applied Mechanics & Materials 754-755(7), 874-880. DOI: 10.4028/www.scientific.net/AMM.754-755.874
Razali, N., Sultan, M. T. H., Mustapha, F., Yidris, N., and Ishak, M. R. (2014). “Impact damage on composite structures – A review,” The International Journal of Engineering and Science 3(7), 08-20. DOI: 10.1016/0961-9526(93)90095-2
Safri, S. N. A., Sultan, M. T. H., Yidris, N., and Mustapha, F. (2014). “Low velocity and high velocity impact test on composite material – A review,” The International Journal of Engineering and Science3(9), 50-60. DOI: 10.1177/1099636216650989
Sharba, M. J., Leman, Z., Sultan, M. T. H., Ishak, M. R., and Hanim, M. A. A. (2016). “Tensile and compressive properties of woven kenaf/glass sandwich hybrid composites,” International Journal of Polymer Science 2016(2016) 1-6. DOI: 10.1155/2016/1235048
Tita, V., deCarvalho, J., and Vandepitte, D. (2008). “Failure analysis of low velocity impact: Experimental and numerical approaches,” Composite Structures 83(4), 413-428. DOI: 10.1016/j.compstruct.2007.06.003
Trowbridge, D. A., Grady, J. E., and Aiello, R. A. (2012). Low Velocity Impact Analysis with Nastran, University of Georgia, Athens, GA, USA.
US Composites (2010). “Epoxy Resins and Hardener Systems,” (http://www.uscomposites.com/epoxy.html), Accessed on 10 April 2014.
Vaidya, U. (2011). “Impact response of laminated and sandwich composites,” in: Impact Engineering of Composite Structures, Springer, New York, NY, pp. 97-191.
Wigotsky, V. (2002). “Innovative products and processes,” Antec Fundamentals Forum 58(3), 26-34. DOI: 10.4028/www.scientific.net/AMR.734-737.2244
Yang, H. H. (1994). Kevlar Aramid Fibre, Wiley, Hoboken, NJ, USA.
Article submitted: September 29, 2017; Peer review completed: December 16, 2017; Revised version received: January 25, 2018; Accepted: January 26, 2018; Published: March 6, 2018.
DOI: 10.15376/biores.13.2.3045-3060