
Abstract
Activated carbon was prepared from waste melamine-impregnated paper (MIP) by pyrolysis with activation by NaOH. The adsorption parameters such as carbonization temperature (300, 350, 400, 450 °C), NaOH to C ratio (2:1, 3:1, 4:1, 5:1), and initial methylene blue (MB) dye concentration (20 to 600 mg/L) were studied. The adsorption results were fit by the Langmuir isotherm model and pseudo-second order kinetics. It was found that the activated carbon from MIP had a maximum adsorption capacity of 497 mg/g at 400 °C (carbonization temperature) and NaOH to C ratio (2:1). The highest removal of methylene blue (MB) via activated carbon was 99.4%. The π-π interaction between dye molecules and MIP active carbon was proposed to be a primary driving force for dye adsorption. This activated carbon adsorbent based on MIP was shown to be highly promising for water decontamination applications.
Download PDF
Full Article
Activated Carbon from Melamine-Impregnated Paper
Yaokun Zhang, Xiuyi Lin, Chuanshuang Hu, and Hong Yun *
Activated carbon was prepared from waste melamine-impregnated paper (MIP) by pyrolysis with activation by NaOH. The adsorption parameters such as carbonization temperature (300, 350, 400, 450 °C), NaOH to C ratio (2:1, 3:1, 4:1, 5:1), and initial methylene blue (MB) dye concentration (20 to 600 mg/L) were studied. The adsorption results were fit by the Langmuir isotherm model and pseudo-second order kinetics. It was found that the activated carbon from MIP had a maximum adsorption capacity of 497 mg/g at 400 °C (carbonization temperature) and NaOH to C ratio (2:1). The highest removal of methylene blue (MB) via activated carbon was 99.4%. The π-π interaction between dye molecules and MIP active carbon was proposed to be a primary driving force for dye adsorption. This activated carbon adsorbent based on MIP was shown to be highly promising for water decontamination applications.
DOI: 10.15376/biores.18.1.1128-1140
Keywords: Melamine impregnated paper; Active carbon; Carbonization temperature; NaOH; Methylene blue
Contact information: College of Materials and Energy, South China Agricultural University, 483 Wushan Road, Guangzhou 510642 China; *Corresponding author email: hongy@scau.edu.cn
GRAPHICAL ABSTRACT
INTRODUCTION
Melamine-impregnated paper (MIP) is a kind of facing material in which paper is used as the base material and the surface paper is impregnated with melamine formaldehyde resin. It is currently widely used for the surface decoration of wood-based panels. The world produces approximately 9 million m2 of MIP every year, and the cutting volume reaches 380,000 m3 per year. Since melamine is a thermosetting resin, it is difficult to recycle the waste MIP. It can only be treated as industrial waste, which not only increases production costs, but also pollutes the surrounding environment.
Presently, some companies pulverize melamine impregnated paper and use it as a filler for wood-based panels (Chen et al. 2020). Some researchers used an artificial board hot pressing process to make melamine impregnated paper powder into composite particleboard. However, this method does not considerably improve the performance of the board, and the added value of the product is low. Therefore, the development of high value-added waste melamine impregnated paper utilization technology is of great importance.
Environmental issues, e.g., water and air pollution, have become a great concern to the scientific community in recent years. Among them, water pollution has drawn more attention to the world because of its devastating and catastrophic effects (Thabede et al. 2020). The direct discharge of industrial waste (from textile, paper, dye synthesis, printing, leather, electroplating, and cosmetics industries) containing different types of pollutants, e.g., heavy metals, crude oils, pigments, synthetic dyes and organic solvents, cause severe water pollution (Phathania et al. 2013; Novais et al. 2018; Wen et al. 2019).
Activated carbon is made of solid carbonaceous material through high temperature carbonization and activation with limited exposure to air. It has a developed pore structure, a large specific surface area, and abundant surface chemical groups, which provide it with a relatively high specific adsorption capacity (Li et al. 2021). Researchers have used agricultural waste and by-products or industrial waste and by-products to produce activated carbon with excellent performance (Saini et al. 2020). Camellia husk, sucrose, etc., can be made into activated carbon with excellent performance under the activation of alkali (Bedin et al. 2016; Wang et al. 2020). Various factors, e.g., the pyrolysis temperature and activator type, will also affect the performance of activated carbon materials. The research results of Wang et al. (2018) showed that the adsorption performance of methylene blue reached the maximum when the pyrolysis temperature reached a temperature of 800 °C. Furthermore, the adsorption performance of the activated carbon is controlled by the charge, chemical structure, and size of organic pollutants (Gupta and Khatri 2019). In another study, Jawad et al. (2020) treated coconut shells with sulfuric acid to prepare activated carbon. The results showed that the amount of adsorbent was 0.1 g/100 mL, the pH value of the solution was 8, and the adsorption effect was best when the temperature was 303 K. Sun et al. (2021) studied lignin-based biological activated carbon modified with iron ions, and a removal rate of 100 mg/L of methylene blue (MB) by the adsorbent reached 100% within 15 min, which is not suitable for industrial intention because it required more energy (Sun et al. 2021).
Wang et al. (2018) used a mesoporous zeolite-activated carbon composite material to remove the ammonia nitrogen and methylene blue in an aqueous solution. The results showed that the composite activated carbon material had adsorption capacities of 754.75 mg/g and 9 mg/g (298 K) for MB and ammonia-nitrogen (NH3-N) (Wang et al. 2018). Yadav et al. (2021) synthesized activated carbon from eucalyptus with carbon nanotubes to make a new type of activated carbon adsorbent (Yadav et al. 2021). Studies have shown that when the dye concentration was 8 mgL-1, the composite activated carbon was less effective for methylene blue (MB) and eosin yellow (EY). The optimal amount of adsorbent was 1.5 g/L and 0.5 g/L. In summary, there is a strong global urge for the designing and development of advanced activated carbon materials that have high dye removal efficiencies.
The ratio of base paper to dipping amount in melamine-impregnated paper is about 1 to 1.1. The paper fiber has a disordered porous structure, which provides a porous precursor material for activated carbon. However, it is easily destroyed during the carbonization process, and the carbon structure formed by the melamine resin at high temperature provides a hard skeleton, which makes up for the low physical strength of the paper fiber carbon materials. In this study, waste melamine-impregnated paper was used as raw material and activated carbon materials were prepared via NaOH chemical activation method, and the effect of the carbonization temperature and activation method on the performance of activated carbon was studied. As such, this study was used to produce an activated carbon material with superior adsorption performance, realize the high value-added utilization of waste materials, and achieve the purpose of protecting the environment.
The sorption behavior of dyes on an activated carbon composite surface has been examined utilizing the batch adsorption method. The physicochemical characteristics of the adsorbent were investigated using thermogravimetric analysis (TGA), scanning electron microscopy (SEM), and the Brunauer-Emmett-Teller (BET) method. The adsorption tests were performed and the impact of the working conditions, e.g., NaOH to C ratio, dye concentration, carbonization temperature, and adsorbent-adsorbate contact timing were explored on the adsorption proficiency of adsorbent (Chen et al. 2018). A specific goal of the examination was to estimate the kinetics of adsorption of MB by the adsorbent. The data were fit to isotherm and kinetic models to decide the best-fit equation (Jia et al. 2017; Oyelude et al. 2017; Alwi et al. 2020; Shahbazi et al. 2020; Somsesta et al. 2020)
EXPERIMENTAL
Material
The reagents used in the experiment were of analytical grade and were purchased from McLean (China). The melamine-impregnated paper was obtained from the Guangdong Yaodonghua Decorative Material Technology Co., Ltd. The stock solutions of the dyes, methylene blue (MB), which had a chemical formula of C16H18ClN3S (molecular weight of 319.87 g/mole) were prepared by the dissolution of 25 mg in 500 mL of distilled water (DW). They were further prepared via consecutive dilution for achieving the required concentrations (2 to 50 mg/L) of the dye for the adsorption experiments. The solution was prepared by dissolving the required amount of dye in distilled water.
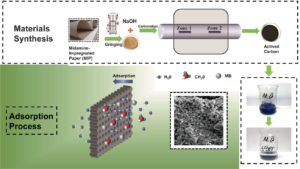
Materials Synthesis
Preparation of activated carbon
For the experimental work, a powder of 40 to 60 mesh (Chinese medicine grinding machine) was prepared from the melamine impregnated paper (MIP). The powder was placed in an oven at a temperature of 105 °C and dried for 2 h to remove moisture from the material. The material was placed in a tube furnace for carbonization, in conjunction with the selected carbonization temperature, i.e., 300 °C, 350 °C, 400 °C, and 450 °C. Then, the four carbonized materials at different temperatures were activated by NaOH.

Fig. 1. Schematic representation of the experimental set-up and their related photographs as well as the carbonization process of melamine-impregnated paper
The NaOH to C ratio was 2 to 1, 3 to 1, 4 to 1, and 5 to 1. This was mixed with the carbonized samples, and an appropriate amount of deionized water was added in magnetic mixer for two h. Then, the materials were placed in an oven at a temperature of 105 °C to remove moisture, and then were finally placed in the tube furnace to undergo a 600 °C activation treatment. After activation, the sample was washed to neutral via deionized water and hydrochloric acid. The whole process is shown in Fig. 1.
Adsorbability Performance of Activated Carbon
The methylene blue reagents were used to prepare the standard solution of different solubilities of methylene blue at the following concentrations: 100, 200, 300, 400, and 500 mg/L. Then, 30 mg of 80 mesh to 100 mesh activated carbon and 50 mL of 100 mg/L methylene blue solution were placed in a 250 mL conical bottle and placed in a constant temperature oscillator at a temperature of 30 °C and 150 rpm until adsorption equilibrium (adsorption equilibration time 45 min to 60 min). The adsorption amount was calculated by Eq. 1 by measuring the MB absorbance before and after the adsorption through the ultraviolet photometer.
Performance Test
Thermogravimetric (TG) and derivative thermogravimetry (DTG) analysis
First, 5 mg to 15 mg of the sample was placed into an alumina crucible (6.8 ø × 4.0 mm, Shanghai Jingyi Chemical Material Co., Ltd.), which was placed in a thermogravimetric analyzer (STA449C, NETZSCH-Gerätebau GmbH, Germany) for pyrolysis performance testing. The nitrogen flow rate was 30 mL/min, the heating rate was 10 °C/min, and the target temperature was 800 °C.
RESULTS AND DISCUSSION
Analysis of Adsorbability Results
The prepared 100 mg/L of methylene blue was diluted to 2, 4, 6, 8, 10, and 12 mg/L. After decantation and filtration, the equilibrium concentrations of the dye in the solution were measured at 665 nm using UV-visible spectrophotometer:

According to the fitted equation, the adsorption capacity of the activated carbon at different methylene blue concentrations was calculated. The fitted equation is shown in Fig. 2a (R2 = 0.9941).
The adsorption capacity and the removal rate of activated carbon for methylene blue were calculated according to Eq. 2 and Eq. 3, respectively,

where qe is the adsorption capacity (mg/g), C0 is the initial concentration (mg/L), Ce is the solution concentration after adsorption (mg/L), V is the volume of solution (L). W is the quantity of activated carbon (g), and R is the percent removal (as shown in Table 1).

Fig. 2. (a) Standard curve of methylene blue; (b) Effect of the carbonation temperature on MB adsorption; (c) The effect of different NaOH to C ratios on the adsorption capacity of activated carbon; and (d) TG analysis of the melamine-impregnated paper
Table 1. Influence of the Carbonization Temperature and NaOH to C Ratio on the Adsorption Capacity and Percentage Removal Using Activated Carbon

Effect of Carbonization Temperature on Adsorption
According to Fig. 2b, the amount of methylene blue adsorbed by the activated carbon increased as the carbonization temperature increased and reached a peak when the temperature reached 400 °C, and then it began to decrease.
The primary function of the carbonization process of MIP is to enrich the fixed carbon in the raw materials, as well as reduce the volatile components and moisture in the raw materials, thereby improving the strength of the carbonized materials, and at the same time generating initial porosity, which helps the activation process. If the carbonization temperature is too low, the components will not be completely volatilized, meaning sufficient initial porosity will not be generated, which will affect the adsorption. If the temperature is too high, the graphite crystallites in the carbonized product will change in an orderly manner. This will reduce the gaps between the crystallites and affect the activation process.
Effect of NaOH to C Ratio on Adsorption
According to Fig. 2c, the ratio of NaOH to C had a considerable effect on the adsorption capacity of the activated carbon. When the ratio of NaOH to C was 2 to 1, the adsorption capacity reached 497 mg/g. With different NaOH to C ratios, the properties of the prepared materials were different, which was primarily reflected in the difference in specific surface area.
The chemical activation method was used to prepare additional pore structures. With the increase in the proportion of the activating reagent NaOH, the precursor of the material was brittle and could not withstand severe chemical changes, resulting in larger pores or through-holes. Because the surface area was reduced, the adsorption capacity of the activated carbon was poor.
Thermogravimetric (TG) Analysis and Results
According to Fig. 2d, from room temperature to approximately 250 °C is the initial stage of the pyrolysis temperature increase. The MIP raw material sample absorbs heat and evaporates water, thereby reducing the weight. Within the temperature ranging from 250 to 400 °C, i.e., the pyrolysis stage of MIP, which is primarily hemicellulose and cellulose pyrolysis, the material loss the most weight, and the weight loss rate was the fastest. When temperature increased to 400 °C, the primary ingredients of the melamine facing paper reached the end of pyrolysis; as such, the structure gradually stabilized and formed a carbon layer. Finally, the carbon residue percentage of MIP was 25.1%, which was similar to that of ordinary agricultural waste.
Scanning Electron Microscopy (SEM) – Morphological Studies
A SEM study was undertaken to reveal the microstructural morphological features of activated carbon. Figures 3a through 3d show the prepared carbonization/pyrolysis processes, which revealed the morphological features of activated carbon. Small and large particles microstructures views with different magnifications were explored at 20 to 10 μm. The major part of the samples, i.e., NaOH, was chemically treated and thermally activated via the pyrolysis/carbonization effects of the 3D–porous carbon. When the carbonization temperature was 400 °C and the ratio of NaOH to C ratio was 2 to 1, the surface of the activated carbon was relatively dense, and the pore structure was rich, with pore size ranging from 0.1 to 4 nm. When the NaOH to C ratio was 3 to 1, rough irregular surfaces with cavities and disintegrated surface morphologies. When the ratio of NaOH to C ratio was 4 to 1 or 5 to 1, the pore structure of the activated carbon was not uniform, and the minimum pore size was approximately 0.2 nm. Clearly, as shown in Fig. 6a, the lower magnification micro-structural images of the 3D-porous fully interconnected network combined of the cellular structure formed an interconnected porous network.

Fig. 3. The SEM images of the activated carbon with different NaOH to C ratios: a) the NaOH to C ratio is 2 to 1; b) the NaOH to C ratio is 3 to 1; c) the NaOH-to-C ratio is 4 to 1; and d) the NaOH to C ratio is 5 to 1
Brunauer-Emmett-Teller (BET) Analysis
To investigate the textural features, i.e., the surface area and pore size distribution, of the adsorbent, nitrogen adsorption-desorption isotherms were determined by using a surface area analyzer. The BET (as shown in Fig. 4) survey curve showed the major contribution of the activated carbon, which was clearly observed in the N2 adsorption-desorption isotherm and pore size distribution. The curve was primarily s-shaped, which is a type II isotherm. There was an inflection point in the low-pressure zone, which indicated that the single-layer adsorption was saturated at this time, and the way to continue the adsorption is multi-layer adsorption. As seen in Fig. 4b, when the NaOH to C ratio was 3 to 1, the adsorption capacity was the lowest.
The pore structure changes in the activated carbon caused by temperature variation during the preparation process are shown in Table 2. The maximum specific surface area of the activated carbon was 609 m2/g, the average pore diameter was primarily between 1.93 nm to 3.04 nm, the micropore volume was small, the pore diameter distribution was mainly concentrated between micropores and mesopores, and the minimum pore volume was 0.131 cm3/g.

Fig. 4. The N2-desorption isotherm and pore size distribution diagram: a) Carbonized at 400 °C and the NaOH to C ratio is 2 to 1; b) Carbonized at 400 °C and the NaOH to C ratio is 3 to 1; c) Carbonized at 400 °C and the NaOH to C ratio is 4 to 1; and d) Carbonized at 400 °C and the NaOH to C ratio is 5 to 1
Table 2. Specific Surface Area and Pore Structure Parameters of the Activated Carbon Under Different Conditions

Therefore, based on the understanding and control strategy of the activated carbon pore structure formation process, creating additional micropores is conducive to the improvement of the MB adsorption performance. In general, the MB molecules include aromatic rings and delocalized electrons, whereas MIP active carbon contains a large discontinuous graphitic carbon region enriched with electrons, as well as many structural defects. The π-π interaction between dye molecules and MIP active carbon is expected to be a primary driving force for dye adsorption and the electrostatics interaction between negatively charged carboxylic and phenolic group containing oxygen functionalities of MIP active carbon and the cationic center of MB dye along with trapping of dye molecule on structural defects of MIP active carbon which contributes to cationic dye adsorptive removal. The next section will further consider this problem by using kinetic study and adsorption isotherm models.
Kinetic Study
The adsorption capacity and other parameters were evaluated using pseudo-first-order models and pseudo-second-order models.
The adsorption kinetics of the methylene blue by the activated carbon was investigated under the following conditions: a temperature of 30 °C, no pH value adjustments, and 0.03 g of activated carbon. The nonlinear fitting of the pseudo-first-order kinetics model (as shown in Eq. 6) and the pseudo-second-order kinetics model (as shown in Eq. 7) was performed, respectively, as shown in Eqs. 6 and 7,

where t (h or min) is the adsorption time, qt and qe (mg/g) are the adsorption capacity at time t and when equilibrium is reached, respectively, k1 (h-1 or min-1) is the pseudo-first order kinetic rate constant, and k2 (mg·g-1·min-1) is the pseudo-second-order kinetic rate constant (as shown in Fig. 5).

Fig. 5. Plots for the (a) pseudo-first order kinetic and (b) pseudo-second-order kinetic equations
As shown in Table 4, the correlation coefficient of the experimental data obtained by the non-linear fitting of the quasi-second-order kinetic model was 0.9961, and the correlation coefficient of the pseudo-first-order was 0.70495. The adsorption amount (qe,cal) value calculated by the pseudo-second-order kinetic equation was relatively close to the experimental data. Good fits of adsorption data to the pseudo-second-order model mean that the rate-limiting step in the process is related to diffusion of the adsorbate into a network of very small pores (Hubbe et al. 2019). When MIPAC is in contact with MB, due to the porous structure of MIPAC, diffusion from the bulk solution takes place across a boundary layer or film to the external surface of an adsorbent. Then diffusion continues within relatively large pores, within smaller pores, and finally within either micropores or a gel-like material. Because of MB has an affinity for MIPAC, such affinity is expected to slow down the progress of diffusion, especially in the very small pores (Hubbe et al. 2019).
Table 3. Equation Parameters

Interpreting the isotherm information is important for originating an equation that can be utilized. The Langmuir (as shown in Eq. 4) and Freundlich (as shown in Eq. 5) models were used to analyze the adsorption isotherm models of the MIP activated carbon,

where Ce (mg/L) is the concentration of the adsorbate in the solution at equilibrium, qe (mg/g) is the adsorption capacity per unit mass of the adsorbent at equilibrium, qm (mg/g) is the maximum single-layer adsorption per unit mass of adsorbent, Kf is the Freundlich isotherm adsorption empirical constant, which is related to the adsorption capacity and the adsorption strength, and KL (L/mg) is the Langmuir isotherm adsorption energy constant (as shown in Fig. 5).
The correlation coefficients obtained by the nonlinear fitting of the Langmuir and Freundlich isotherm models were 0.9810 and 0.8745, respectively, which indicated that the adsorption of methylene blue by activated carbon was more consistent with the Langmuir model. Thus, adsorption was well explained by a model in which the sites on the adsorbent surface were uniform in energy of adsorption. The calculated parameters of the isotherms for MB removal are given in Table 4.
Table 4. Langmuir and Freundlich Equation Parameters


Fig. 6. Fits to the a) Langmuir; and b) Freundlich equations
Table 5. Comparison with Other Separators Reported for Adsorption

- Activated carbon, which was prepared with melamine impregnated paper scraps as the raw materials, showed good adsorption performance for methylene blue. When the carbonization temperature was 400 °C and the ratio of alkali to carbon was 2 to 1, the average pore diameter of the activated carbon was primarily between 1.93 nm and 3.04 nm, and the specific surface area was 609 m²/g, which showed the best performance. The adsorption capacity of methylene blue reached 497 mg/g and the decolorization efficiency reached 99.4%.
- The Langmuir isotherm fitted well with the equilibrium data, which confirmed that the sorption occurs via a single-layer adsorption interaction. The adsorption kinetics showed the process follows the pseudo-second-order model. This new adsorbent is very useful for the efficient removal of dyes from wastewater.
ACKNOWLEDGEMENTS
The authors Zhiqiang Xu for their support during the BET analysis.
Authorship Contribution Statement
Yaokun Zhang: methodology, investigation, formal analysis, visualization, and writing of the original draft; Xiuyi Lin: validation and formal analysis; Chuanshuang Hu: project administration; and Hong Yun: conceptualization, validation, supervision and writing – review and editing.
Declaration of Competing Interest
This work did not have competing financial interests or personal relationships.
Data Availability
The datasets generated during or analyzed during the current study are available from the corresponding author on reasonable request.
Formatting of Funding Sources
This study was supported by the Science and Technology Program of Guangzhou (Project No. 202103000011) and the Forestry Administration of Guangdong Province (Project No. 2022KJCX016).
REFERENCES CITED
Alwi, R. S., Gopinathan, R., Bhowal, A., and Garlapati, C. (2020). “Adsorption characteristics of activated carbon for the reclamation of eosin Y and indigo carmine colored effluents and new isotherm model,” Molecules 25(24). DOI: 10.3390/molecules25246014
Bedin, K. C., Martins, A. C., Cazetta, A. L., Pezoti, O., and Almeida, V. C. (2016). “KOH-activated carbon prepared from sucrose spherical carbon: Adsorption equilibrium, kinetic and thermodynamic studies for methylene blue removal,” Chemical Engineering Journal 286, 476-84. DOI: 10.1016/j.cej.2015.10.099
Chen, R., Zhang, W., Guan, L., Gu, J., Lin, W., and Hu, C. (2020). “Study on the preparing technology of waste melamine impregnated paper and wood composite particleboard,” China Forest Products Industry 57(9), 20-23, 31. DOI: 10.19531/j.issn1001-5299.202009005
Chen, Y. D., Lin, Y. C., Ho, S. H., Zhou, Y., and Ren, N.-Q. (2018). “Highly efficient adsorption of dyes by biochar derived from pigments-extracted macroalgae pyrolyzed at different temperature,” Bioresour. Technol. 259, 104-110. DOI: 10.1016/j.biortech.2018.02.094
Gupta, K., and Khatri, O. P. (2019). “Fast and efficient adsorptive removal of organic dyes and active pharmaceutical ingredient by microporous carbon: Effect of molecular size and charge,” Chemical Engineering Journal 378. DOI: 10.1016/j.cej.2019.122218
Hubbe, M. A., Azizian, S., and Douven, S. (2019). “Implications of apparent pseudo-second-order adsorption kinetics onto cellulosic materials. A review,” BioResources 14(3), 7582-7626. DOI: 10.15376/biores.14.3.7582-7626.
Jawad, A. H., Abdulhameed, A. S., and Mastuli, M. S. (2020). “Acid-factionalized biomass material for methylene blue dye removal: A comprehensive adsorption and mechanism study,” Journal of Taibah University for Science 14(1), 305-313. DOI: 10.1080/16583655.2020.1736767
Jia, Z., Li, Z., Ni, T., and Li, S.-B. (2017). “Adsorption of low-cost absorption materials based on biomass (Cortaderia selloana flower spikes) for dye removal: Kinetics, isotherms and thermodynamic studies,” Journal of Molecular Liquids 229, 285-292. DOI: 10.1016/j.molliq.2016.12.059
Li, L., Wu, M., Song, C., Liu, L., Gong, W.-L., Ding, Y.-H., and Yao, J.-M. (2021). “Efficient removal of cationic dyes via activated carbon with ultrahigh specific surface derived from vinasse wastes,” Bioresour. Technol. 322, article 124540. DOI: 10.1016/j.biortech.2020.124540
Novais, R. M., Ascensão, G., Tobaldi, D. M., Seabra, M. P., and Labrincha, J. A. (2018). “Biomass fly ash geopolymer monoliths for effective methylene blue removal from wastewaters,” Journal of Cleaner Production 171, 783-94. DOI: 10.1016/j.jclepro.2017.10.078
Oyelude, E. O., Awudza, J. A. M., and Twumasi, S. K. (2017). “Equilibrium, kinetic and thermodynamic study of removal of eosin yellow from aqueous solution using teak leaf litter powder,” Sci. Rep. 7(1), article 12198. DOI: 10.1038/s41598-017-12424-1
Pathania, D., Sharma, S., and Singh, P. (2017). “Removal of methylene blue by adsorption onto activated carbon developed from Ficus carica bast,” Arabian Journal of Chemistry 10S1445-S51. DOI: 10.1016/j.arabjc.2013.04.021
Saini, A., Maheshwari, P. H., Tripathy, S. S., Waseem, S., and Dhakarte, S. R. (2020). “Processing of rice straw to derive carbon with efficient de-fluoridation properties for drinking water treatment,” Journal of Water Process Engineering 34. DOI: 10.1016/j.jwpe.2020.101136
Shahbazi, D., Mousavi, S. A., and Nayeri, D. (2020). “Low-cost activated carbon: Characterization, decolorization, modeling, optimization and kinetics,” International Journal of Environmental Science and Technology 17(9), 3935-3946. DOI: 10.1007/s13762-020-02698-w
Somsesta, N., Sricharoenchaikul, V., and Aht-Ong, D. (2020). “Adsorption removal of methylene blue onto activated carbon/cellulose biocomposite films: Equilibrium and kinetic studies,” Materials Chemistry and Physics 240. DOI: 10.1016/j.matchemphys.2019.122221
Sun, Y., Wang, T., Han, C., Lv., X.-T., Bai, L., Sun, X.-Y., and Zhang, P.-F. (2021). “Facile synthesis of Fe-modified lignin-based biochar for ultra-fast adsorption of methylene blue: Selective adsorption and mechanism studies,” Bioresour. Technol. 344(Pt A), article 126186. DOI: 10.1016/j.biortech.2021.126186
Thabede, P. M., Shooto, N. D., and Naidoo, E. B. (2020). “Removal of methylene blue dye and lead ions from aqueous solution using activated carbon from black cumin seeds,” South African Journal of Chemical Engineering 33, 39-50. DOI: 10.1016/j.sajce.2020.04.002
Wen, X., Liu, H., Zhang, L., Zhang, J., Fu, C., Shi, X.-Z., Chen, X.-C., Mijowska, E., Chen, M.-J., and Wang, D.-Y. (2019). “Large-scale converting waste coffee grounds into functional carbon materials as high-efficient adsorbent for organic dyes,” Bioresour. Technol. 272, 92-98. DOI: 10.1016/j.biortech.2018.10.011
Wang, Z., Hu, C., Tu, D., Zhang, W., and Guan, L. (2020). “Preparation and adsorption property of activated carbon made from Camellia oleifera shells,” Journal of Forestry Engineering 596-102. DOI: 10.13360/j.issn.2096-1359.202001032
Wang, M., Xie, R., Chen, Y., Pu, X.-Q., Jiang, W.-J., and Yao, J. (2018). “A novel mesoporous zeolite-activated carbon composite as an effective adsorbent for removal of ammonia-nitrogen and methylene blue from aqueous solution,” Bioresour. Technol. 268, 726-732. DOI: 10.1016/j.biortech.2018.08.037
Yadav, S. K., Dhakate, S. R., and Pratap Singh, B. (2021). “Carbon nanotube incorporated eucalyptus derived activated carbon-based novel adsorbent for efficient removal of methylene blue and eosin yellow dyes,” Bioresour. Technol. 344(B), article 126231. DOI: 10.1016/j.biortech.2021.126231
Article submitted: June 8, 2022; Peer review completed: July 11, 2022; Revised version received and accepted: December 4, 2022; Published: December 13, 2022.
DOI: 10.15376/biores.18.1.1128-1140