
Abstract
Micro-solid oxide fuel cells (SOFC) sensors prepared via depositing a thin film BYCF (10 wt% [Ba0.95FeY0.05O2.8] + 90 wt% [Co2O3]) – GDC20 (Gd0.20Ce0.80O1.95) cathode and NiO-GDC20 (Gd0.20Ce0.80O1.95) anode on a GDC20 electrolyte layer were operated at 800 °C. The structure, which receives only biogas, was formed into 15-mm pellets with only one side for detecting methane (CH4). The detection of 40% to 99.99% CH4 provided a high level of accuracy compared with 10% to 30% CH4. The biogas (60% CH4) from the Oil Palm Industry and Rubber Cooperative Fund, Thailand, increased remarkably at voltage levels of 20 to 21 mV. The electrical signal from the micro-SOFC sensor corresponded to the quantity of CH4, with the chemical reaction of the dry reforming activities (NiO and Co3O4) highly catalyzed and transformed from CH4 to H2, thus generating electrons. It was concluded that the micro-SOFC sensor is suitable for detecting methane measurements at intermediate temperatures, with the ceramic structure offering low degradation compared with metal sensors.
Download PDF
Full Article
Analysis of Electric Signals from Micro-Solid Oxide Fuel Cell Sensors Detecting Methane Biogas
Thitirat Ninwijit,a Arkom Palamnit,b Montri Luengchavanon,c,* Sutida Marthosa,d Nafisah Osman,e Md Shahariar Chowdhury,f and Sutham Niyomwas g
Micro-solid oxide fuel cells (SOFC) sensors prepared via depositing a thin film BYCF (10 wt% [Ba0.95FeY0.05O2.8] + 90 wt% [Co2O3]) – GDC20 (Gd0.20Ce0.80O1.95) cathode and NiO-GDC20 (Gd0.20Ce0.80O1.95) anode on a GDC20 electrolyte layer were operated at 800 °C. The structure, which receives only biogas, was formed into 15-mm pellets with only one side for detecting methane (CH4). The detection of 40% to 99.99% CH4 provided a high level of accuracy compared with 10% to 30% CH4. The biogas (60% CH4) from the Oil Palm Industry and Rubber Cooperative Fund, Thailand, increased remarkably at voltage levels of 20 to 21 mV. The electrical signal from the micro-SOFC sensor corresponded to the quantity of CH4, with the chemical reaction of the dry reforming activities (NiO and Co3O4) highly catalyzed and transformed from CH4 to H2, thus generating electrons. It was concluded that the micro-SOFC sensor is suitable for detecting methane measurements at intermediate temperatures, with the ceramic structure offering low degradation compared with metal sensors.
DOI: 10.15376/biores.17.1.281-298
Keywords: Micro-SOFC; Catalyst; Sensor; Bio-Methane; Electrical signal; NiO; Co3O4
Contact information: a: Energy Technology program, Faculty of Engineering, Prince of Songkla University, Hat Yai, Songkhla 90110, Thailand; b: Faculty of Engineering, Prince of Songkla University, Hat Yai, Songkhla 90110, Thailand; c: Wind Energy and Energy Storage Systems Centre (WEESYC), Sustainable Energy Management Program, Faculty of Environmental Management, Prince of Songkla University, Hat Yai, Songkhla 90110, Thailand; d: Faculty of Science and Industrial Technology, Prince of Songkla University, Suratthani Campus, Surat Thani 84000, Thailand; e: Faculty of Applied Sciences, Universiti Teknologi MARA, Perlis Branch, 02600, Arau, Perlis, Malaysia; f: Faculty of Environmental Management, Prince of Songkla University, Hat Yai, Songkhla 90110, Thailand; g: Department of Mechanical Engineering, Faculty of Engineering, Prince of Songkla University, HatYai, Songkhla 90110, Thailand
* Corresponding Author: montri.su@psu.ac.th
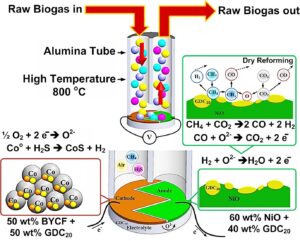
GRAPHICAL ABSTRACT
INTRODUCTION
Solid oxide fuel cells (SOFCs) have attracted considerable attention due to their capacity to serve as a power source for supplying methane or biogas; both of these types of gas can be reformed to hydrogen gas (H2) (Gür 2016). They are particularly well known for their high efficiency and fuel flexibility. Potentiometric measurements of synthesised ceramic composites were carried out to test an apparatus for hydrogen gas. These sensors act on the proton conductor element Sr3CaZr0.9Ta1.1O8.55, which indicates stable output potential close to the theoretical value calculated with the Nernst equation. The proton conductor elements of SrCe0.95Yb0.05O3−α, CaZr0.9In0.1O3−α, and Ba3(Ca1.18Nb1.82)O9−α can be operated with a deviation over 100 mV between the theoretical and experimental data, which was obtained for sensing hydrogen gas (H2) (Serret et al. 2011). Additionally, SOFCs are compatible with natural gas, propane, methanol, and ethanol (Kushi 2016). The fabrication of 30 μm thin film Gd0.2Ce0.8O2-δ(GDC) electrolyte using a screen-printing method has been shown to produce a maximum power density of 188 mW/cm2 at 500 °C for a H2/air fuel cell (Xia et al. 2001). Therefore, the GDC materials can be deposited onto a thin film to provide the highest ionic conductivity, enabling the sensing SOFC to enhance the conduction of electrons from sensing H2 gas. The SOFC sensors show a rapid response to H2 gas streams ranging between 1 and 100 vol%. Additionally, the SOFC system generates the electricity by H2 gas. SOFC sensors can also generate electricity by methane (CH4) gas, which enhances catalytic for the dry reformation of CH4. The catalytic materials can reform the CH4 to H2, such as nickel oxide and cobalt oxide (Ashok et al. 2019; Jadhav et al. 2016; Wei et al. 2018).
While chromatography systems are used in the majority of gas detectors (Cruz et al. 2015), flame ionization detectors (FID) have also been developed for gas chromatography (GC) based on gas detectors (Kim et al. 2019) and thermal conductivity (TCD) (Rastrello et al. 2013). Nevertheless, these detectors have several limitations. For instance, FID requires many types of carrier gases and TCD has low sensitivity to hydrocarbons and hydrogen gas, limiting their applications with GC. Nanomaterials based on semiconductor-detectors (Tian et al. 2013) and fuel cell technology (Lengden et al. 2013) have been designed with the ability to enhance the measurement sensitivity of chromatography systems, but with a simplified structure and size reduction. This design allows the detectors to overcome problems faced by conventional methods using GC, especially regarding the long-term stability and cross sensitivity of SOFC detectors deployed in a portable GC. Therefore, there is a need for an SOFC to be developed that can enable the electronic structure of the entire GC system to be analysed, with better detection limits than conventional FID and TCD methods and with fewer required chromatographic columns and types of carrier gases (Fan et al. 2017).
This work employed a novel design to investigate SOFCs in gas detectors under an intermediate temperature of 800 °C. BYCF-GDC20, GDC20, and NiO-GDC20 were selected as the cathode, electrolyte, and anode, respectively. A narrow space was located between the anode and the cathode using a triangular-saw tooth design. The Pt wires were current collectors that connected to the cathode and anode of the sensor for transmitting electrical signals. The electrical signal analysis in the SOFC sensor was analysed for CH4 based on the chemical reaction and catalyst materials.
EXPERIMENTAL
Preparation of Cathode Composite
A cathode composite BYCF (Ba0.054Y0.029Co1.8Fe0.062O2.89) (Hing et al. 2015; Suklueng et al. 2014) was prepared using reagent grade metal oxide powders from Sigma Aldrich, City, Germany. A mixture with a composition with 5 wt% BaO, 3 wt% Fe2O3, 2 wt%Y2O3, and 90 wt%Co3O4 was obtained in solid state with conventional ceramic powder processing (Fuel cell Materials, Ohio, USA).
Preparation of Electrolyte Composite
Commercial GDC20 (20% gadolinium doped ceria, Gd0.20Ce0.80O1.95) electrolyte powder was obtained from Fuel Cell Materials (Ohio, USA), with properties of a surface area of 10 to 14 m2/g and particle size of 0.1-0.4 µm.
Preparation of Anode Composite
The NiO anode powder was also imported from Fuel Cell Materials USA (Columbus, Ohio, USA), with properties of a surface area of 2.9 m2/g and particle size of 0.5 to 1.5 µm. The cathode was a 50:50 mixture of BYCF and GDC20, and the anode was a 60:40 mixture of NiO and GDC20, respectively.
Preparation of Sensor
These compositions were used to control and maintain the thermal expansion coefficient (TEC) to be close to that of GDC20, which is 13.08 × 10⁻⁶ °C-1 at 900 °C (Guo et al. 2014). The electrolyte powder was ground for 1 h and then mixed with distilled water, including 10% polyvinyl alcohol (PVOH) (Mogul Carcare, Bangkok, Thailand) as binder, by weight (wt%). The cathode and anode composite was respectively milled for 12 h in a cylindrical capped container with alumina balls as filling using a horizontal rotary ball mill, and then dried in an oven at 150 °C. The powders were ground again for 4 h in the authors’ in-house-made grinding machine and sieved through a 150-mesh screen.

Fig. 1. Structure of micro-SOFC: (a) micro-SOFC exhibiting all the components for operational methane detection from biogas: (b) the micro-SOFC based on real experiments that was inserted in the furnace at 800 °C for sensing operations: (c) the plant layout for raw-biogas cleaning and upgrading as well as micro-SOFC sensor testing station can installation
The production of the micro-SOFC sensor started with the manufacture of the full fuel cell with a 50:50 BYCF + GDC20 cathode and 60:40 NiO + GDC20 anode deposited on the GDC20 electrolyte pellet (50:50 BYCF + GDC20|60:40 NiO + GDC20| GDC20). The GDC20 powder was pressed to form a 15-mm diameter pellet of 2 mm thickness by uniaxial press under 3000 psi pressure. The GDC20 pellet was sintered at 1,400 °C with a heating rate of 10 °C/min for 10 h under atmospheric pressure conditions (101.3 kPa). The 50:50 BYCF + GDC20 cathode was deposited on the GDC20 electrolyte pellet by spray pyrolysis (model; Ultra spry pyrolysis, Beijing, China) in which the triangular saw-tooth shape sticker covered the surface to control the shape of the cathode layer.
In the spray pyrolysis technique, the spray gun was operated at 120 psi air pressure, and the nozzle was set up at a height of 20 cm with a 16-cm spraying diameter. The pellet was placed on a stainless steel substrate and the temperature was increased to 450 °C. To use this technique, the cathode and anode mixtures had to be in the form of slurries; the mixtures were mixed with distilled water in the ratio 30:70 vol%, respectively. All slurries were milled for 12 h in a horizontal rotary ball mill for acquiring highly homogenous slurries.
After spraying the cathode, this pellet was co-sintered at 1,100 °C with a heating rate of 10 °C/min for 10 h under atmospheric pressure conditions. Meanwhile a 60:40 NiO + GDC20 anode was also deposited on the GDC20 electrolyte pellet, opposite to the cathode area, by spray pyrolysis in which the triangular saw-tooth shape sticker covered the cathode layer to control the shape of the anode and provided a space between the anode and cathode area. To obtain high porosity for the adsorption of gas and increase the electrochemical power density (Ohimain and Izah 2017), this pellet was co-sintered at 1,100 °C with a heating rate of 10 °C/min for 10 h under atmospheric pressure. The finished system is shown Fig. 1(a).
Figure 1(a) shows platinum electrodes as probes that were primed with a platinum paste and pressed to ensure good contact was made. The pellets with the platinum probes were placed in an in-house designed furnace. In the real experiment as shown in Fig. 1(b), the micro-SOFC employed biogas that inserted in the furnace at 800 °C for the sensing operation. Fig. 1(c) shows the plant layout for raw-biogas cleaning and upgrading. The plant has been separated into a cleaning section and an upgrading section. The cleaning section aims to migrate secondary components such as sulfur compounds (H2S) and non-methane volatile organic compounds (VOC). An estimate of bio-methane quality has been operated to assess compliance with recent National and European standard specifications (Paolini et al. 2019). The micro-SOFC sensor can be installed by connecting a pipe and using the blower to control the flow rate of the raw-biogas to the micro-SOFC sensor testing station at a temperature of 800 °C.
Analytical Procedures
The DC electrical conductivity was measured using four point probes with varied temperatures at 25, 100, 200, 300, 400, 500, 600, 700, and 800 °C (Mitsubishi Chemical Analytech, Laresta-GX, MCP-T700, Tokyo, Japan). The surface area, pore volume, and pore size were measured using BET Micromeritics/ASAP2060 (Micromeritics, Norcross, USA). Microstructures were observed using a scanning electron microscope, field emission (FE)-SEM (Scios DualBeam, Prague, Czechia), and ZEISS (ZEISS Microscopy, Jena, Germany). The thermal expansion coefficients of all the sintered materials were determined using a Thermo Mechanical Analyser (TMA) from Setaram, France. The crystalline nature and phase purity were examined using powder X-ray diffraction (XRD) techniques (PANalytical, Empyrean, United Kingdom) with Cu Kα radiation. The voltage level for detecting quantities of methane in biogas was measured by digital multimeter (V&A, VA18B version, Shanghai, China). The biogas composition (H2, CO2, CH4, N2, and H2S) was determined by using gas chromatography with a flame thermal conductivity and flame photometric detector by Agilent GC7890 (Agilent Technology, California, USA). Several ratios between 99.99% methane (CH4) and 99.99% Nitrogen (N2) gas were used to prepare different methane gas concentrations. The pressure was kept constant at 60 psi or around 0.5 L/min (Chea et al. 2020) and gases were mixed using metering valves from Swagelok (Cleveland, OH, USA). The biogas was collected from a palm oil factory (Chumphon) and rubber cooperative fund in the (Songkhla) south of Thailand.
RESULTS AND DISCUSSION
The composition of the 40:60 NiO + GDC20 anode exhibited high porosity GDC20 and was connected as a scaffold to enhance NiO dispersion due to its high surface area and porosity that can support the adsorption of the CH4 gas. However, it is not easy to distinguish the separate particles of the NiO and GDC20 phases due to lower GDC20 amounts. Therefore, most of the morphology is produced from NiO phases. After reduction in hydrogen or reformed gas from CH4, the porosity of composites is increased, leading to a reduction in the NiO’s surface (Jadhav et al. 2016; Maling et al. 2020). The pin holes that appeared between the grain of NiO and GDC20 were around 1 µm, which resulted from the sintering at 1100 °C for 10 h and the spray pyrolysis technique, as shown in Fig. 2(a). The micrographs of the top-view of the cathode side that used the composition of the 50:50 BYCF + GDC20 cathode also revealed high porosity with pin holes approximately 10 µm.

Fig. 2. SEM micrographs of micro-SOFCs based on the surface: (a) 60:40 NiO + GDC20 anode, (b) 50:50 BYCF + GDC20 cathode, (c) GDC20 electrolyte, and (d) GDC20 electrolyte located at the space between the anode and cathode
Figure 2(b) shows that the GDC20 particles in cathode were in range of 0.1 to 0.4 µm, and Fig. 2(c) shows a dense electrolyte microstructure with minimal pores that was sintered at 1,400 °C for 10 h. The free-space was prepared between the cathode and anode surfaces. The space prevented the electrical signal short circuit from the conducting of cathode and anode, as shown in Fig. 2(d).

Fig. 3. Cross-section of micro-SOFC: (a) 40:60 NiO + GDC20 anode deposited on electrolyte and (b) 50:50 BYCF+GDC20 cathode deposited on GDC20 electrolyte
Figure 3(a) shows a cross-sectional view of the 40:60 NiO + GDC20 anode deposited on electrolyte at around 18.87 µm, and Fig. 3(b) shows the cross-sectional view of the 50:50 BYCF + GDC20 cathode deposited on GDC20 electrolyte at approximately 24.77 µm. These thicknesses were measured by the SEM machine (Table 1). The rough surface of the GDC20 electrolyte may result from the compaction and the spray pyrolysis technique.
GDC20 electrolyte is regarded as one of the more promising materials for low-intermediate temperate SOFCs. Because SOFCs need to have high density, the properties of Gd3+ and Ce4+ show a higher ionic radius that can react with excess oxygen vacancies, leading to higher ionic conductivity than pure ceria (Medisetti et al. 2017). The CeO2 is a compound in GDC20 that is based on ionic conductivity; the migration energy (EM) is the energy required at the saddle point for O2- to diffuse to the adjacent site; the migration energy is the activation energy for conductivity. EM can be generated from the relationship shown in Eq. 1,
(fmax)h α exp (-EM/kBT), (1)
where (fmax)h is temperature for the high-frequency, EM is migration energy (eV), kB is the Boltzman’s constant, and T is the absolute temperature (K).
At operating temperatures above 800 °C, involving high-temperature SOFCs, the migration energy is the activation energy for conductivity. Additionally, at the intermediated-temperature (IT) SOFCs around 500 °C, the oxygen vacancies must be acquired from the trapping centers. EO can be obtained from the relationship, T[(tanδ)max]h = exp (-EO/kBT). The isolation energy is the energy required for the captured O2 vacancy to move freely (Lee et al.2017). Equation 2 are as follows,
T[(tanδ)max]h = exp (-EO/kBT) (2)
where tanδ is the loss tangent proportional to the loss factor, and EO is dissociation energy (eV).
Table 1. Thickness of 50:50 BYCF + GDC20 Cathode and 60:40 NiO + GDC20 Anode Layers Deposited on GDC20 Electrolyte

Figure 4 depicts the XRD patterns of 50:50 BYCF + GDC20 cathode powder obtained upon calcination at 1100 °C for 10 h. These peaks represented the BYCF and GDC20 components that were combined at a high temperature. The phase of Ce3.568Gd0.792Y0.012 composition contributed GDC20 doped with Y (Yttrium) from the BYCF compound. This composition when formed in solid solution will be helpful for increasing the sintering temperature of the composite cathode (Rehman et al. 2016, 2017). The phases of the BaFeO2.9 and Ba3CoFe24O41 compositions were represented from BYCF with a majority of Co3O4 leading to high conductivity and ionic transfer (Suklueng et al. 2014).

Fig. 4. XRD patterns of calcined 50:50 BYCF + GDC20 cathode powder
Figure 5 shows the XRD patterns of GDC20 electrolyte power obtained through calcination at 1400 °C for 10 h. The major peak was formed with CeO2O3 and Gd2O3, which generated some Ce4+ in the CeO2 structure by Gd3+; this is a promising candidate for low operational temperatures, producing relatively high ionic conductivities and well known among ceria-based on materials solid electrolyte (Choolaei et al. 2018). The GDC10 electrolyte was operated in a micro-SOFC methane sensor that showed high ionic conductivity for generating an electric signal (Phaijit et al. 2019). The GDC20 compound was formed in nanofibers that can be activated for high electrical conductivity at more than 0.01 S/cm above 600 °C (Thiabdokmai et al. 2014). The nanocrystalline thin film CeO2 sensor was operated to monitor oxygen. Temperature was used in a range from 700 to 750 oC. These conditions appeared to be excellent for sensor operation, leading to a fast reaction to the exchange of O2 concentration that can be represented in the resistance range (Jasinski et al. 2003). Figure 6 depicts the XRD patterns of 60:40 NiO + GDC20 anode powder obtained by calcination at 1100 °C for 10 h. These peaks revealed NiO, Ce0.8Gd0.2O2, and CeO2, whose phases separated using high temperatures under calcination. NiO made up most of the phase leading to the high quantity while the minority of the phase was Ce0.8Gd0.2O2 and CeO2. NiO acts as an excellent catalyst for oxygen activation, while producing high electrical conductivity with GDC20 and mainly reacting as a matrix to support the catalyst and prohibit the Ni element from agglomeration with operating conditions (Ding et al. 2009; Hajakbari et al. 2020).

Fig. 5. XRD patterns of calcined GDC20 electrolyte powder

Fig. 6. XRD patterns of calcined 60:40 NiO + GDC20 anode powder
Table 2 shows the thermal expansion comparison between the 50 wt% BYCF + 50 wt% GDC20 cathode, GDC20 electrolyte, and 60 wt% NiO + 40wt% GDC20 anode in the temperature ranges of 40 to 200 °C, 40 to 400 °C, 40 to 600 °C, and 40 to 800 °C. Generally, the total expansion values obtained for GDC20 were 12 x 10-6/ °C (Setevich et al. 2012) and for the BYCF composition 12.79 x 10⁻⁶/ °C (Suklueng et al. 2014). Optimization of thermal expansion was achieved with a mixture of GDC20 to BYCF and NiO as the cathode and anode components. The best results were obtained at 12.95 x 10⁻⁶/ °C at 40 to 800 °C. Therefore, these TECs can be used for micro-SOFC.
Table 2. Thermal Expansion Coefficients for 50 wt% BYCF + 50 wt% GDC20 Cathode, GDC20 Electrolyte, and 60 wt% NiO + 40 wt% GDC20 Anode

Table 3 shows the properties (surface area, pore volume, and pore size) of the generated micro-SOFC cathode, electrolyte, and anode. The properties of the GDC20 electrolyte required the lowest surface area, pore volume, and pore size, because the GDC20 is the electrolyte that needs high density for ionic conductivity. The nano-particle of GDC20 was sintered at 500 °C, which fabricated surface area of 13.2 m2/g (Muñoz et al. 2015). The GDC20 sintered at high temperature can generate high density and low surface area. In addition, the properties of the cathode and anode require a high surface area, pore volume, and pore size because it increases the possibility for the gas to the chemical reaction (Araujo et al. 2018). However, the surface area, pore volume, and pore size were related in the SEM micrographs in Fig. 2(a) to (c).
Table 3. Comparison of the Properties of Micro-SOFC Components Using the BET Machine

Figure 7(a) shows the resistivity of the 60 wt% NiO + 40 wt %GDC20 anode in temperatures ranging from 40 to 800 °C. At high temperatures (500 to 800 °C), 60 wt% NiO + 40 wt% GDC20 clearly show low resistivity. The 60 wt% NiO composition was predominantly electronic (typical of metals), while the 40 wt% composition was rare earth GDC20 with a major component of CeO2, providing high ionic conductivity. Therefore, the cermet conductivity occurs through two mechanisms: ionic (through the GDC phase) and electronic (through the metallic nickel phase) (Santos et al. 2018). This anode composition generated an average Ea of 0.13 eV. The lower activation energy (less than 1 eV) indicated that NiO contributed greatly to the electronic conductivity. Figure 7(b) shows the resistivity of the 50 wt% BYCF + 50 wt%GDC20 cathode in various temperatures ranging from 40 to 800 °C. Suklueng reported that BYCF indicated high electrical conductivity of 588.55 S cm-1 at 800 °C (Suklueng et al. 2014). Therefore, 50 wt% BYCF + 50 wt% GDC20 composites can decrease conductivity with the properties of GDC20 but improve ionic transfer and thermal expansion (Table 2).

Fig. 7. Variations of the resistivity with temperature for the (a) 60 wt% NiO + 40 wt% GDC20 anode, (b) 50 wt% BYCF + 50 wt% GDC20 cathode, and (c) GDC20 electrolyte composite in the range 40 ≤ T ≤ 800 °C, under atmospheric air conditions
While BYCF exhibited an Ea of around 3.23 eV, 50 wt% BYCF + 50 wt% GDC20 can generate 0.26 eV at 800 °C, which indicates the addition of 50 wt% GDC20 to develop for best cathode materials. Figure 7(c) shows the resistivity of the GDC20 electrolyte at starting temperature of 40 °C up to 800 °C. This resistivity was higher than values for the 60 wt% NiO + 40 wt% GDC20 anode and the 50 wt%BYCF +50 wt%GDC20 cathode. The high resistivity material prevents the short circuits in the micro-SOFC and the Ea of GDC20 measuring 0.20 eV at 800 °C. Kulkarni et al. (2014) and Sui et al. (Liu et al. 2013) reported conductivities of 0.97 x 10⁻² and 1.40 x 10⁻² S cm-1 at 700 °C, respectively. Based on GDC20, this compound exhibited mixed ionic and electronic cathode and anode, which can be attributed to the promotion of electron conductivity (N-type) in a reducing atmosphere and electron hole conductivity (P-type) in an oxidizing atmosphere (Niaz et al. 2019).
Table 4. Biogas Compositions Collected from the Oil Palm Industry at Chumphon, Thailand

This biogas contained N2, CH4, CO2, and H2S with values averaging (%Volume) 5 ± 0.256, 60 ± 1.461, 35 ± 0.293, and 944.437 ± 17.847 (ppm), respectively. The methane (CH4) was most of the biogas, while nitrogen (N2), and carbon dioxide (CO2) were the minority as shown in Table 4. Typical biogas compositions from the palm oil mill have also contained N2, CH4, CO2, and H2S with values between 0 to 1%, 55 to 75%, 30 to 45%, and 1 to 2%, respectively (Ohimain et al. 2017).
Table 5. Biogas Composition Collected from the Rubber Cooperative Fund at Songkhla, Thailand

This biogas contained N2, CH4, CO2, and without H2S, with values averaging (%Volume) 6.296 ± 2.429, 58.334 ± 0.403, and 35.641 ± 2.872, respectively. The CH4 was the majority of the biogas again, while N2, and CO2 were the minority, as shown in Table 5. Typical biogas compositions from the Rubber Cooperative Fund (rubber latex) have contained CH4 and H2S with values of 79.8 ± 2.5% and 6395 ± 2309 ppm, respectively (Charnnok et al. 2013). However, the processes of biogas productivity in the rubber latex industry are highly sensitive depending on the hydraulic retention time and organic loading rate (Chaiprapat et al. 2015).

Fig. 8. The voltage level with varied percentages of methane (mixture gas) measured by the micro-sensor SOFC
Figure 8 shows the mixture gas containing methane gas (CH4) and nitrogen gas (N2), mixed at ratio from 10% to 99.99%. The micro-SOFC sensor was used for detection at voltage level of 33.980 mV (99.99% methane) with low error bar. The voltage level continuously decreased depending on the percentage of methane. The voltage level affected the intensity of the methane gas with high accuracy until 30 to 40% methane gas indicated a high error, while 10 to 20% methane showed that the voltage level did not affect the quantity of methane. Therefore, 50 to 99.99% methane was highly efficient for detecting due to generating numerous electrons. The quantity of 10 to 40% methane was insufficient to generate electrons in the micro-SOFC sensor, which can be explained by coking resistance catalyst for CO2 dry reforming of CH4. The anode side contained NiO that performed the high catalytic activity and resistance to carbon deposition following Equation 3 (Wei et al. 2018), which changed the CH4 to H2 based on the low methane affecting to NiO that could not act upon the endothermic nature of the CH4 decomposition reaction for generating electrons in the micro-SOFC sensor. The related equations are as follows:
CH4 + CO2 → 2CO + 2H2 (3)
Co + H2S → CoS +H2 (4)
H2 + O2- → H2O + 2e– (5)
CO + O2- → CO2 + 2e– (6)
Generally, the biogas contained approximately 60% CH4, depending upon materials and time duration (Chen et al. 2020). The biogas from the oil palm industry revealed a higher voltage level average of 20.90 mV, while biogas from the Rubber Cooperative Fund showed an average of 20.35 mV; and the mixture gas showed an average of 18.93 mV, as shown in Fig 9.

Fig. 9. Comparison of voltage levels between mixture gas (60%CH4:40%N2), biogas from the Rubber Cooperative Fund at Songkhla, and biogas from the oil palm industry at Chumphon, (Thailand) as measured by a micro-SOFC sensor
For the comparison of the quantity of biogas between Tables 4 and 5, the CH4 from the oil palm industry was a little higher than for the Rubber Cooperative Fund; however, the CO2 in both places had almost the same value. Meanwhile the biogas from the oil palm industry contained reduced amounts of H2S. The micro-SOFC sensor can generate higher electron form the biogas from the oil palm industry affected by the CO2 dry reforming of CH4. The quantity of electrons for the signal in the micro- SOFC sensor was dependent on the quantity of CH4 reacting with CO2 that provided an enthalpy change of 247 kJmol-1 at 298 K (Wei et al. 2018). The low voltage level of the mixture gas may be affected by the low CO2 level when the mixture gas injected for measurement in the micro-SOFC sensor was only combined with the air in the alumina chamber.
Figure 10 shows the catalytic activity for reforming CH4 to be H2 gas and the generation of electrons formed in the micro-SOFC sensor. Focusing on the endothermic nature of CH4 gas for the decomposition reaction at 700 °C, CO2 is obtained by dry reforming of CH4. The active-site mechanism has been popularly accepted for CO2 reforming of CH4 using Ni catalysts (Amin et al. 2017), where the C and H2 could be decomposed from CH4 on the Ni particles. According to this decomposition, the dissociation and adsorption of CH4 on the Ni particles and of CO2 on the substrate are properly the controlling factors for the reactions in the CO2 dry reforming of CH4. The H atoms in CH4 are continuously released one-by-one, until the carbon is finally left on the surface of the Ni particles that are related to the higher surface area of 1.0783 m2/g in Table 3. For this reason, the deactivation of catalysts depends on the rate of carbon removal and formation (Pan et al. 2008).

Fig. 10. Schematic mechanism for biogas dry reforming of CH4 combined with principle of SOFC to be a micro-SOFC sensor
After the dry reforming activity, the micro-SOFC sensor produced the H2. In the cathode side, oxygen ions are the reacted form of oxygen (1/2 O2 + 2e– → O2-), and then conducted through the electrolyte layer to the anode that crossed the air gap. Cobalt was also contained in the cathode side; they can perform the toluene reforming activity, which is primarily due to the C-C bond activity by metallic cobalt species. Deactivation can cause the encapsulation of active metal species by carbon and/or oxidation of metallic cobalt by oxide or sulfide species. The deactivation trend in the presence of sulfur compound is mainly due to the procession of inert cobalt sulfide compounds. The activity of cobalt-based catalysts in the formation of sulfur-containing feed primarily depends on the invariability of the formed cobalt sulfide compounds during the dry reforming reaction environment (Ashok et al. 2019). In this work, around 944.437 ppm H2S as exhibited in Table 4 may split the H2S to be H2 for generating electrons. Even the reforming of CH4 itself occurs, and the electron flow through the external electric for the micro-SOFC sensor (Phaijit et al. 2019). Moreover, in this gas reaction, the Gibbs free energy of the overall oxidation reaction of fuel (H2 +1/2O2 🡪 H2O, CO+1/2O2 🡪CO2) is also transformed into an electric signal, and the irreversible part is liberated as heat (Bao et al. 2018).
CONCLUSIONS
- The micro-SOFC sensor was adapted from a normal SOFC power source to be a sensor for detecting CH4. The novel design used a cathode and anode that were deposited on the electrolyte pellet. This micro-SOFC sensor operated at a high temperatures of 800 °C. The electrical signal of the micro-SOFC sensor is dependent on the quantity of CH4 and can be applied as a means of detection.
- The micro-SOFC sensor was first calibrated electrical signal with known concentration of synthetic methane gas, for example, 60% synthetic methane gas is prepared from mixing 60% of pure CH4 and 40% of pure N2. The average electrical signals received from feeding the 60% synthetic methane gas, the biogas from oil palm industry and the biogas from the Rubber Cooperative Fund were 18.93 mV, 20.90 mV, and 20.35 mV, respectively. The electrical signals were similar and reflected the actual biogas concentration tested by using GC.
- The biogas generated a higher electric signal than (CH4 + N2) mixture gas, which was affected by the dry reforming reaction from CO2. The dry reforming reaction, dissociation, and adsorption act upon the CH4 while the Ni particles on anode side of the micro-SOFC sensor and the CO2 on the substrate are properly the controlling factors for the reactions to reproduce H2.
- This micro-SOFC sensor was a novel design based on the structure of the SOFC, and can be operated at a high temperature of 800 °C. The micro-SOFC sensor methane part is low cost, but the operational system is costly due to the high temperature and the need for a furnace. Therefore, this sensor is suitable for measuring raw biogas with high temperature and without degradation due to the use of ceramic materials.
ACKNOWLEDGMENTS
This research was supported financially by the Wind Energy and Energy Storage Systems Centre (WEESYC), Center of Excellence in Materials Engineering (CEME), the Energy Technology Research Centre (ETRC), and the Graduate school scholarship from the Prince of Songkla University. The authors would also like to thank the Faculty of Engineering, Faculty of Environmental Management, Prince of Songkla University and Faculty of Applied Sciences, Universiti Teknologi MARA, Malaysia, for facility support.
REFERENCES CITED
Araújo, A. J. M., Grilo, J. P.F., Loureiro, F. J. A., Campos, L. F. A., Paskocimas, C. A., Nascimento, R. M., and Macedo, D. A. (2018). “Designing experiments for the preparation of Ni-GDC cermets with controlled porosity as SOFC anode materials: Effects on the electrical properties,” Ceramics International 44 (8), 23088-23093. DOI: 10.1016/j.ceramint.2018.09.115
Ashok, J., Das, S., Dewangan, N., and Kawi, S. (2019). “H2S and NOx tolerance capability of CeO2 doped La1−xCexCo0.5Ti0.5O3−δ perovskites for steam reforming of biomass tar model reaction,” Energy Conversion and Management: X 1, 100003. DOI: 10.1016/j.ecmx.2019.100003
Amin, R., Chang, X., and Liu, B. (2017). “Synergistic effect of CeO2 in CH4/CO2 Dry reforming reaction over stable xCeO2 yNi/MCM-22 catalysts,” Industrial & Engineering Chemistry Research 56 (26), 7445-7453. DOI: 10.1021/acs.iecr.7b01375
Bao, C., Wang, Y., Feng, D., Jiang, Z., and Zhang, X. (2018). “Macroscopic modeling of solid oxide fuel cell (SOFC) and model-based control of SOFC and gas turbine hybrid system,” Progress in Energy and Combustion Science 66, 83-140. DOI: 10.1016/j.pecs.2017.12.002
Chea, S., Luengchavanon, M., Anancharoenwong, E., Techato, K., Jutidamrongphan, W., Chaiprapat, S., Niyomwas, S., and Marthosa, S. (2020). “Development of an O-ring from NR/EPDM filled silica/CB hybrid filler for use in a solid oxide fuel cell testing system,” Polymer Testing 88, article no. 106568. DOI: 10.1016/j.polymertesting.2020.106568
Chaiprapat, S., Wongchana, S., Loykulnant, S., Kongkaew, C., and Charnnok, B. (2015). “Evaluating sulfuric acid reduction, substitution, and recovery to improve environmental performance and biogas productivity in rubber latex industry,” Process Safety and Environmental Protection 94, 420-429. DOI: 10.1016/j.psep.2014.10.002
Charnnok, B., Suksaroj, T., Boonswang, P., and Chaiprapat, S. (2013). “Oxidation of hydrogen sulfide in biogas using dissolved oxygen in the extreme acidic biofiltration operation,” Bioresource Technology 131, 492-499. DOI: 10.1016/j.biortech.2012.12.114
Chen, R., Li, Z., Feng, J., Zhao, L., and Yu, J. (2020). “Effects of digestate recirculation ratios on biogas production and methane yield of continuous dry anaerobic digestion,” Bioresource Technology 316, 123963. DOI: 10.1016/j.biortech.2020.123963
Choolaei, M., Cai, Q., Slade, R.C.T., and Amini Horri, B. (2018). “Nanocrystalline gadolinium-doped ceria (GDC) for SOFCs by an environmentally-friendly single step method,” Ceramics International 44 (11), 13286-13292. DOI: 10.1016/j.ceramint.2018.04.159
Cruz, V. G. M., Costa, A. L. H., and Paredes, M. L. L. (2015). “Development and evaluation of a new DGA diagnostic method based on thermodynamics fundamentals,” IEEE Transactions on Dielectrics and Electrical Insulation 22(2), 888-894. DOI: 10.1109/TDEI.2015.7076789
Ding, C., Lin, H., Sato, K., and Hashida, T. (2009). “Synthesis of NiO–Ce0.9Gd0.1O1.95 nanocomposite powders for low-temperature solid oxide fuel cell anodes by co-precipitation,” Scripta Materialia 60(4), 254-256. DOI: 10.1016/j.scriptamat.2008.10.020
Fan, J., Wang, F., Sun, Q., Bin, F., Ding, J., and Ye, H. (2017). “SOFC detector for portable gas chromatography: High-sensitivity detection of dissolved gases in transformer oil,” IEEE Transactions on Dielectrics and Electrical Insulation 24(5), 2854-2863. DOI: 10.1109/TDEI.2017.006438
Guo, T., Zhang, L., Song, X., Dong, X., and Shirolkar, M. M., Wang, M., Li, M., and Wang, H. (2014). “Influences of Gd2Ti2O7 sintering aid on the densification, ionic conductivity and thermal expansion of Gd0.1Ce0.9O1.95 electrolyte for solid oxide fuel cells,” Journal of Power Sources 262, 239-244. DOI: 10.1016/J.JPOWSOUR.2014.03.077
Gür, T. M. (2016). “Comprehensive review of methane conversion in solid oxide fuel cells: Prospects for efficient electricity generation from natural gas,” Progress in Energy and Combustion Science 54, 1-64. DOI: 10.1016/j.pecs.2015.10.004
Hing, P., Suklueng, M., Voo N. Y., Lim L. C., and Atkinson A. (2015). “Solid oxide fuel cells using novel cathodes in the BaO-Co2O3-Fe2O 3 composited with GDC10,” ECS Transactions 68(1), 1837-1848. DOI: 10.1149/06801.1837ecst
Hajakbari, F. (2020). “Characterizationof nano crystalline nickel oxide thin films prepared at different thermal oxidation temperatures,” J. Nanostruct. Chem. 10, 97-103. DOI: 10.1007/s40097-020-00332-2
Irshad, M., Siraj, K., Raza, R., Javed, F., Ahsan, M., Shakir, I., and Rafique, M. S. (2016). “High performance of SDC and GDC core shell type composite electrolytes using methane as a fuel for low temperature SOFC,” AIP Advances 6(2), article ID 025202. DOI: 10.1063/1.4941676
Jadhav, S. T., Puri, V. R., and Jadhav, L. D. (2016). “NiO-GDC-BCY composites as an anode for SOFC,” Journal of Alloys and Compounds 685, 626-632. DOI: 10.1016/j.jallcom.2016.05.243
Jasinski, P., Suzuki, T., and Anderson, H. U. (2003). “Nanocrystalline undoped ceria oxygen sensor,” Sensors and Actuators B 95, 73-77. DOI: 10.1016/S0925-4005(03)00407-6
Kulkarni, S., Duttagupta, S., and Phatak, G. (2014). “Study of glycine nitrate precursor method for the synthesis of gadolinium doped ceria (Ce0.8Gd0.2O1.90) as an electrolyte for intermediate temperature solid oxide fuel cells,” RSC Advances 4, 46602-46612. DOI: 10.1039/C4RA06602B
Kushi, T. (2016).” Performance and durability evaluation of dry reforming in solid oxide fuel cells,” International Journal of Hydrogen Energy 41(39), 17567-17576. DOI: 10.1016/j.ijhydene.2016.07.025
Kim, H., Kwon, J., Choi, S. Y., and Ahn, Y. G. (2019). “Method development for the quantitative determination of short chain fatty acids in microbial samples by solid phase extraction and gas chromatography with flame ionization detection,” Journal of Analytical Science and Technology 10(28), 2-6. DOI: 10.1186/s40543-019-0184-2
Lee, H.-C., Lee, J.-A., Lee, J.-H., Heo, Y.-W., and Kim, J.-J. (2017). “Ionic conductivity and relaxations of In-doped GDC (gadolinium doped ceria) ceramics,” Ceramics International 43(15), 11792-11798. DOI: 10.1016/j.ceramint.2017.06.018
Lengden, M., Cunningham, R., and Johnstone, W. (2013). “Tunable diode laser based concentration measurements of water vapour and methane on a solid oxide fuel cell,” Journal of Lightwave Technology 31(9), 1354-1359. DOI: 10.1109/JLT.2013.2247378
Liu, A. Z., Wang, J. X., He, C. R., Miao, H., Zhang, Y., and Wang, W. G. (2013). “Synthesis and characterization of Gd0.1Ce0.9O1.95 nanopowder via an acetic–acrylicmethod,” Ceramics International 39(6), 6229-6235. DOI: 10.1016/j.ceramint.2013.01.044
Malinga, N. N., and Jarvis, A. L. L. (2020). “Synthesis, characterization and magnetic propertiesof Ni,Coand FeCo nanoparticles on reduced graphene oxide for removal of Cr(VI),” J. Nanostruct. Chem. 10, 55-68. DOI: 10.1007/s40097-019-00328-7
Medisetti, S., Ahn, J., Patil, S., Goel, A., Bangaru, Y., Sabhahit, G. V., Babu, G. U. B, Lee, J.-H., and Dasari, H. P. (2017). “Synthesis of GDC electrolyte material for IT-SOFCs using glucose & fructose and its characterization,” Nano-Structures & Nano-Objects 11, 7-12. DOI: 10.1016/j.nanoso.2017.05.009
Muñoz, F. F., Acuña, L. M., Albornoz, C. A., Leyva, A. G., Bakere, R. T., and Fuentes, R. O. (2015). “Redox properties of nanostructured lanthanide doped ceria spheres prepared by microwave assisted hydrothermal homogeneous co-precipitation,” Nanoscale 7, 271-281. DOI: 10.1039/c4nr05630b
Niaz, A.K., Jung, M.G., Park, J-Y., Anil V. Virkar, A.V. and Lim, H-T. (2019). “Spatial investigation of electronic properties in composite electrolytes for solid oxide fuel cells using embedded probes,” Journal of Power Sources 438 (226945) 1-8. DOI: 10.1016/j.jpowsour.2019.226945
Ohimain, E.I., Izah, S.C. (2017). “A review of biogas production from palm oil mill effluents using different configurations of bioreactors,” Renewable and Sustainable Energy Reviews 70, 242-253. DOI: 10.1016/j.rser.2016.11.221
Pan, Y.-X., Liu, C.-J., and Shi, P. (2008). “Preparation and characterization of coke resistant Ni/SiO2 catalyst for carbon dioxide reforming of methane,” Journal of Power Sources 176(1), 46-53. DOI: 10.1016/j.jpowsour.2007.10.039
Paolini, V., Torre, M., Giacopini,W., Pastori, M., Segreto, M., Tomassetti, L., Carnevale, M., Gallucci, F., Petracchini, F., and Guerriero, E. (2019). “CO2/CH4 separation by hot potassium carbonate absorption for biogas upgrading,” International Journal of Greenhouse Gas Control 83, 186-194. DOI: 10.1016/j.ijggc.2019.02.011
Phaijit, S., Suklueng, M., Marthosa, S., Niyomwas, S., Voo, N. Y., and Kumar, A. (2019). “A novel micro-solid oxide fuel cell (μ-SOFC) for detecting methane content in biogas,” Bulletin of Materials Science 42, 129. DOI: 10.1007/s12034-019-1789-1
Rehman, S.u., Song, R.-H., Lee, J.-W., Lim, T.-H., Park, S.-J. Lee, S.-B. (2017). “Fabrication and characterization of La0.65Sr0.3MnO3−δ/(Y2O3)0.08(ZrO2)0.92/ Gd0.1Ce0.9O2−δ tri-composite cathode-supported tubular direct carbon solid oxide fuel cell,” Ceramics International 43 (1 Part B), 1086-1091. DOI: 10.1016/j.ceramint.2016.10.045
Rastrello, F., Placidi, P., Scorzoni, A., Cozzani, E., Messina, M., Elmi, I., Zampolli, S., and Cardinali, G. C. (2013). “Thermal conductivity detector for gas chromatography: Very wide gain range acquisition system and experimental measurements,” IEEE Transactions on Instrumentation and Measurement 62(5), 974-981. DOI: 10.1109/TIM.2012.2236723
Rehman, S. U., Song, R.-H., Lee, J.-W., Lim, T.-H. Park, S.-J., and Lee, S.-B. (2016). “Effect of GDC addition method on the properties of LSM–YSZ composite cathode support for solid oxide fuel cells,” Ceramics International 42(10), 11772-11779. DOI: 10.1016/j.ceramint.2016.04.098
Suklueng, M., Yoong, V. N., Peter, H., and Ming, L. C. (2014). “Optimization of a novel composite cathode for intermediate temperature SOFCs applications,” Walailak Journal of Science and Technology (WJST) 12(4), 373-381. DOI: 10.14456/WJST.2015.29
Setevich, C. F., Mogni, L. V., Caneiro, A., and Prado, F. D. (2012). “Optimum cathode configuration for IT-SOFC using La0.4Ba0.6CoO3−δ and Ce0.9Gd0.1O1.95, ” International Journal of Hydrogen Energy 37(19), 14895-14901. DOI: 10.1016/j.ijhydene.2012.01.155
Serret, P., Colominas, S., Reyes, G., and Abellà, J. (2011). “Characterization of ceramic materials for electrochemical hydrogen sensors,” Fusion Engineering and Design 86(9-11), 2446-2449. DOI: 10.1016/j.fusengdes.2011.01.029
Santos, H. A, J. A. F., and Matencio, R. Z. T. (2011). “Ceramic materials for solid oxide fuel cells, advances in ceramics – Synthesis and characterization,” Processing and Specific Applications-IntechOpen 424-446. DOI: 10.5772/18297
Thiabdokmai, C., Tangtrakarn, A., Promsuy, S., Ngiewlay, P., and Mongkolkachit, C. (2014). “Templateless synthesis and characterization of hollow gadolinium doped cerium oxide nanofibers by electrospinning,” Advances in Materials Science and Engineering article no. 127531, 1-10. DOI: 10.1155/2014/127531
Tian, W., Ho, Y., and Chou, C. (2013). “Photoactivated TiO2 Gas chromatograph detector for diverse chemical compounds sensing at room temperature,” IEEE Sensors Journal 13 (5), 1725-1729. DOI: 10.1109/JSEN.2013.2242259
Wei, T., Jia, L., Zheng, H., Chi, B., Pu, J., and Li, J. (2018). “LaMnO3-based perovskite with in-situ exsolved Ni nanoparticles: A highly active, performance stable and coking resistant catalyst for CO2 dry reforming of CH4,” Applied Catalysis A: General 564, 199-207. DOI: 10.1016/j.apcata.2018.07.031
Xia, C., Chen, F., and Liu, M. (2001). “Reduced-temperature solid oxide fuel cells fabricated by screen printing,” Electrochemical and Solid-State Letters 4(5), A52-A54. DOI: 10.1149/1.1361158
Article submitted: June 24, 2021; Peer review completed: October 30, 2021; Revised version received and accepted: November 11, 2021; Published: November 17, 2021.
DOI: 10.15376/biores.17.1.281-298