
Abstract
Wood-consuming furniture manufacturers (WCFM) are major users of forest products in the United States. Between 2000 and 2009, the real value of domestic WCFM shipments (production) declined by 51%. After 2009, WCFM shipments fluctuated, but by 2019 shipments were 48% below 2000 levels. A major contributor to this decline was furniture imports. In 1997, imports accounted for 6% and 23% of the value of upholstered household furniture (UHF) and wood household furniture (WHF), available to U.S. consumers, respectively. In 2019, imports accounted for 35% and 78% of domestically available UHF and WHF, respectively. The primary source of imported UHF in 2019 was China, while Vietnam was the most important source of WHF. Domestic consumption also influences WCFM shipments. Between 1997 and 2019, consumption of UHF by U.S. end-users increased; since 2002, this increase was primarily supplied through increased imports. Since 2005, domestic consumption of WHF declined by 45%, which contributed to the 75% decline in domestic shipments since that year. Wood office furniture and related products also have experienced a 40% decline in consumption since 2000, which coincided with a 41% decline in shipments. More research is needed to determine the impact of decreased WCFM shipments on U.S. forest product production and prices.
Download PDF
Full Article
Analyzing Changes in the U.S. Wood Furniture Industry from 1997 to 2019: Production, Net Imports, and Consumption
William G. Luppold a,* and Matthew S. Bumgardner b
Wood-consuming furniture manufacturers (WCFM) are major users of forest products in the United States. Between 2000 and 2009, the real value of domestic WCFM shipments (production) declined by 51%. After 2009, WCFM shipments fluctuated, but by 2019 shipments were 48% below 2000 levels. A major contributor to this decline was furniture imports. In 1997, imports accounted for 6% and 23% of the value of upholstered household furniture (UHF) and wood household furniture (WHF), available to U.S. consumers, respectively. In 2019, imports accounted for 35% and 78% of domestically available UHF and WHF, respectively. The primary source of imported UHF in 2019 was China, while Vietnam was the most important source of WHF. Domestic consumption also influences WCFM shipments. Between 1997 and 2019, consumption of UHF by U.S. end-users increased; since 2002, this increase was primarily supplied through increased imports. Since 2005, domestic consumption of WHF declined by 45%, which contributed to the 75% decline in domestic shipments since that year. Wood office furniture and related products also have experienced a 40% decline in consumption since 2000, which coincided with a 41% decline in shipments. More research is needed to determine the impact of decreased WCFM shipments on U.S. forest product production and prices.
DOI: 10.15376/biores.17.1.939-951
Keywords: Wood household furniture; Globalization; Supply chain; Wood product consumption; Upholstered household furniture; Wood office furniture; Furniture production; Furniture consumption; Furniture imports
Contact information: a: Northern Research Station, USDA Forest Service, 301 Hardwood Lane, Princeton, WV 24740 USA; b: Northern Research Station, USDA Forest Service, 359 Main Road, Delaware, OH 43015 USA; *Corresponding author: william.luppold@usda.gov
INTRODUCTION
Wood-consuming furniture manufacturers (WCFM) in the United States historically have been major users of hardwood and softwood lumber, veneer, plywood, and composite products (Spelter et al. 1978; Forbes et al. 1993). These industries were the largest users of hardwood lumber in the 1960s and 70s (Luppold and Bumgardner 2008). These manufacturers include upholstered household furniture (UHF), wood household furniture (WHF), and wood office furniture and related products (WORP). Manufacturers included within these subindustries and their corresponding North American Industrial Classification System (NAICS) codes are listed in Table 1.
Between 1997 and 2000, the value of U.S. WCFM shipments (a proxy for production) increased by 12% to 61 billion in constant (2020) dollars (Fig. 1). During the first 5 years of this century, WCFM shipments declined by $10 billion. Between 2005 and 2009, shipments declined by an additional $21 billion. After 2009, WCFM shipments fluctuated, but in 2019 they were 48 percent below 2000 levels.
Of the three WCFM subindustries, the decline in WHF manufacturing has been the most closely examined because of its apparent size and economic importance to the hardwood products industry (Luppold and Bumgardner 2009; Luppold and Bumgardner 2016). A widely studied factor contributing to reduced domestic production of WHF has been increased imports (e.g., Bullard and West 2002; Schuler and Buehlmann 2003; Quesada and Gazo 2006; Buehlmann and Schuler 2009; Luppold and Bumgardner 2011). However, imports also have been a factor influencing the value of UHF (Wan and Bullard 2009) and WORP shipments. The relevant question is: To what degree have imports substituted for domestic production by these subindustries? Furthermore, if imports are found to be important sources of domestically consumed UHF and WORP, from what regions or countries are these imports originating?

Fig. 1. Value of shipments of U.S. wood-consuming furniture manufacturers (WCFM) by year (USDC various years; USDL 2021)
Much of the decline in WCFM shipments occurred between 2005 and 2009, with the steepest decline occurring during the 2008 and 2009 worldwide Great Recession (Fig. 1). Since 2009, WCFM shipments have remained at relatively low levels. These changes suggest that reduced domestic demand has been another potential factor affecting the value of domestic WCFM shipments. Has domestic consumption of UHF, WHF, and WORP declined since the early 2000s, and if so, how do these declines contrast to changes in domestic shipments and imports?
The objectives of this paper were first to examine changes in the value of shipments (value of products manufactured in U.S. furniture plants) for the three WCFM subindustries. Then changes in domestic shipments were compared to changes in net imports (imports minus exports) of similar products defined under the Harmonized Trade Classification System (Table 2). Finally, sources of imports were examined for the subindustries where imports were determined to be an important source of product for domestic consumption. Changes in apparent domestic consumption were estimated and compared for two supply sources of wood furniture: domestic shipments and net imports.
Table 1. Wood Consuming Furniture Manufacturing Subindustries and Related North American Industrial Classification System (NAICS) Products and Product Codes (USDC 2004)

EXPERIMENTAL
For this paper, estimates of WCFM value of shipments were developed from U.S. Department of Commerce, Bureau of the Census (USDC) data. There are two separate measures reported by USDC on the value of products shipped: value of shipments and value of product shipments. Value of shipments includes all merchandise shipped including products purchased from other domestic or international manufactures. Value of product shipments are products manufactured and subsequently shipped. While the value of product shipments would be preferable for the current analysis, these estimates were not available for many of the years examined, including 2017 through 2019. Therefore, the real (2020) value of shipments was used as a proxy for production for these years in this analysis.
Value of shipments for 2002, 2007, 2012, and 2017 were reported by the USDC in the Census of Manufacturing for the respective years (USDC 2004, 2019, 2020, 2021a). In off-census years, the value of shipments were reported by USDC in the Annual Survey of Manufactures (USDC 2004, 2006, 2012, 2017, 2021b). All values of shipment data were accessed using the internet and are based on the most updated USDC estimates available. Estimates for 2006 for value of shipments or value of product shipments could not be determined after repeated internet searches. Therefore, value of shipments were developed for 2006 by averaging the 2005 and 2007 estimates.
Imports and exports of WCFM were developed using the U.S. Department of Commerce, International Trade Administration (USDC, ITA) Trade Policy Information System. Imports and exports of WCFM products are reported under the Harmonized System (HS) classification, which has similar but not identical product definitions developed for the North American NAICS system. Table 2 presents the cross walk between the NAICS and HS codes. A product excluded from the current analysis, classified under the furniture designation in the harmonized system, is kitchen cabinets for permanent installation. Imports of this products were subtracted from the HS “wooden kitchen furniture” group. Because of the connection of this product with the home construction industry, it is not being examined in the context of the domestic furniture industry.
Table 2. Wood Consuming Furniture Manufacturing Subindustries and Associated Harmonized Trade System Product Categories and Codes (Harmonized Tariff Schedule accessed through USDC, ITA 2021)

The specific import value analyzed in this study was landed cost. Landed cost includes the free on-board product cost plus costs of customs, freight, insurance, tariffs, and services associated with the importation of products. Landed costs are comparable to domestic value of shipments as it reflects all costs prior to domestic distribution. Landed costs were not available for furniture products from 1997 to 2002. All landed costs for these years were estimated based on the customs cost for products for a region or country using the proportional differences between the landed and customs cost estimates in 2002.
Net imports are defined in this study as the value of landed imports less the value of exports for the subindustry or groups of subindustries being examined. The term “imports” in the remainder of this paper will refer to net imports unless otherwise specified. Imports will be compared to domestic shipments in actual and relative terms. The relative measure used in this paper is the import market share (IMS), which is the proportion of imports to domestic shipments plus imports is shown in Eq. 1
Import market share (IMS) = value imports / (value of imports + value of domestic shipments) (1)
Value of apparent domestic consumption will be estimated as the sum of domestic value of shipments and imports as shown in Eq. 2.
Value of apparent consumption (consumption) = value of domestic shipments + value of imports (2)
Implicit in the “demand equals supply” assumption of Eq. 2 is that there were no large changes in furniture inventories from year to year. In the remainder of this paper, the term consumption will refer to the value of apparent consumption. Changes in value of shipments, imports, and consumption will be examined in percentage change between time intervals and with the compound rate of growth or decline between time intervals. The reported value of shipments is adjusted to real 2020 dollars by indexing the wholesale price index for furniture and related product manufacturing (NAICS 337), PCU 337, to 2020 = 100 (USDL 2021). All mentions of the dollar value of shipments, imports, and consumption in the remainder of this paper are in real 2020 terms.
RESULTS AND DISCUSSION
Changes in Value of Shipments
The value of shipments of all WCFM subindustries generally increased between 1997 and 2000. However, there were considerable differences between subindustries in the patterns and rates of change after 2000 (Fig. 2). An examination of Figs. 1 and 2 indicates there also were differences in the relative contribution of the three subindustries to the overall decline in furniture shipments between 2000 and 2019. UHF shipments increased between 1997 and 2002 at an annual rate of 3.9%. Between 2002 and 2009, UHF shipments declined by 38% at an annual rate of 6.7% (Fig. 2). Still, the decline in upholstered furniture shipments between 2000 and 2009 only accounted for 16% of the overall decline in WCFM shipments during that period. After 2009, shipments of UHF started to increase at an annual rate of 2.6 percent through 2019. Overall, UHF shipments declined by 21% between 2002 (the high point) and 2019, but only accounted for 8% of the overall decline in WCFM shipments since 2000 (Fig. 1).

Fig. 2. Value of shipments of upholstered household furniture (UHF), wood household furniture (WHF), and wood office furniture and related products (WORP) by year (USDC various years; USDL 2021)
WHF shipments reached an all-time high in 1999 and remained at a relatively high level in 2000 (Fig. 2). Between 2000 and 2004, shipments of WHF declined by 28% at an annual rate of 7.5%. After remaining relatively constant in 2004 and 2005, WHF shipments plummeted 65% between 2005 and 2009 at an annual rate of 23.1%. The decline in WHF shipments between 2000 and 2009 accounted for 46% of the overall decline in WCFM shipments during this period. Since 2009, WHF shipments continued to decline but at a considerable slower annual rate of 3.1%. The 82% decline in WHF between 2000 and 2019 represents over 54% of the total decline of WCFM shipments during that period (Fig. 1).
In 2000, the value of WORP shipments approached $27 billion (Fig. 2). Between 2000 and 2007, shipments of WORP decreased at an annual rate of 3.1% but remained above $20 billion. The largest decline in WORP shipments occurred between 2007 and 2009, when shipments declined at an annual rate of 11.4%. The total decline in WORP shipments between 2000 and 2009 accounted for 44% of the decline in WCFM shipments during that period. Since 2009, shipments of WORP have fluctuated. The decline in shipments between 2000 and 2009 and the lack of growth in WORP shipments since 2009 explains why this industry contributed to the overall decline by 38% in WCFM shipments between 2000 and 2019 (Fig. 1).
Changes in Imports Relative to Domestic Shipments
In 1997, imports of UHF represented 14% of WCFM imports (Fig. 3) and these imports accounted for only 6% of the upholstered furniture available in the U.S. market (Fig. 4). Wood household furniture accounted for 79% of total WCFM imports, and WCFM imports had a 23% U.S. market share. Wood office and related products accounted for 8% of the value of imports and had a IMS of 2%.

Fig. 3. Net U.S. imports of upholstered household furniture (UHF), wood household furniture (WHF), and wood office furniture and related products (WORP) by year (USDC various years; USDC, ITA 2021; USDL 2021)
Between 1997 and the early 2000s, imports of all WCFM products increased, but the rates and patterns of these increases differed among subindustries (Fig. 3). During this period, imports of UHF increased by 336% at an annual rate of 15.9%. By 2007, the IMS for UHF had increased to 20%. Imports of WHF increased between 1997 and 2005 at annual rate of 14.4%. In 2005, WHF imports were slightly greater than domestic production with a IMS of 52% (Fig. 4). Imports of WORP reached its historic high point in 2006 but remained a minor portion of total domestic availability of these products, with an IMS of 5%.
Between 2005 and 2009, total WCFM shipments declined at an annual rate 12.9% (Fig. 1), while imports declined at an annual rate of 11.5% (USDC ITA 2021). Individually, UHF, WHF, and WORP shipments declined 33, 65 and 34%, respectively (Fig. 2), while imports declined by 23, 42, and 39%, respectively. In 2009, the import market share for WHF and UHF were 64 and 22%, respectively, while the IMS for WORP was 4%.
After large declines associated with the worldwide Great Recession, imports of UHF and WHF increased by 156 and 43% (annual rates of 9.9% and 3.6%), respectively, between 2009 and 2019 (Fig. 3). The IMS for UHF and WHF in 2019 were 35% and 78%, respectively (Fig. 4). While WORP imports also increased after 2009, the IMS associated with these imports since 2009 averaged 5% and never exceeded 7%.

Fig. 4. Market share of net imports as a proportion of domestic shipments plus net imports (USDC various years; USDC, ITA 2021; USDL 2021).
Of the three subindustries examined, UHF had the most consistent trend in imports, increasing at an annual rate of 9.8% between 1997 and 2019. WHF was the most important imported product group accounting for 63% to 80% of total WCFM imports during the study period. Imports of WORP have been relatively flat since 1997 and continue to be minor relative to domestic shipments, making an examination of the sources of these imports less important.
Sources of Furniture Imports
In 1997, Europe accounted for 68% of UHF imports (Fig. 5) with Italy accounting for 91% of imports from this region (UDDC ITA 2021). Asia accounted for an additional 21% with China, Malaysia, and Taiwan being the primary suppliers. Between 1997 and 2003, UHF imports from all regions presented in Fig. 5 increased, but Asian imports increased at an annual rate of 83% a year versus an annual rate of 14% per year for Europe. As a result of these dissimilar rates of growth, Asia and Europe each accounted for 40% of U.S. imports in 2003 with Italy and China individually accounting for 31% and 28%, respectively.

Fig. 5. Source regions for net upholstered household furniture (UHF) imports (USDC various years; USDC, ITA 2021; USDL 2021)
After 2003, U.S. imports of European UHF declined, while imports from Asia increased. In 2007, Asia accounted for 84% of UHF imports with China accounting for 90% of the Asian total (Fig. 5, Table 3). Since 2007, Asia has remained the dominant source of UHF imports, with China being the most important source in this region. However, since 2015, growth in Asian imports has primarily been the result of increased shipments from Vietnam (Table 3). In 2019, combined shipments from China and Vietnam accounted for 94% of U.S. worldwide UHF imports. When combined with the IMS for that year (Fig. 4), it appears that a third of this product available to U.S. consumers (on a value basis) originates from China and Vietnam.
In 1997, the U.S. imported $5.3 billion of WHF. Imports from Asian sources accounted for 56% of these imports with North America (Canada and Mexico) and Europe accounting for 24% and 19%, respectively (Fig. 6). Within Asia, China was the most important source, but relatively large volumes also originated from Taiwan, Malaysia, Indonesia, and Thailand (USDC ITA 2021). Between 1997 and 2002, WHF imports more than doubled as imports increased from all regions depicted in Fig. 7. However, imports from Asia accounted for 72% of the total increase. Of the $11.8 billion of WHF imported in 2002, 65% was sourced from Asia, and China accounted for 65% of Asian imports.
Imports of WHF reached an all-time high in 2005 (Fig. 6). Seventy-four percent of the furniture imported in that year originated from Asia and two-thirds of Asian shipments originated from China. By 2005, imports from Vietnam also were increasing, in part the result of a trade dispute between the United States and China that shifted manufacturing of bedroom furniture to Vietnam (Luppold and Bumgardner 2011). Between 2005 and 2009, WHF imports declined by 42% but the Asian share of this market increased to 85%.

Fig. 6. Source regions for net wood household furniture (WHF) imports (USDC various years; USDC, ITA 2021; USDL 2021)
Between 2009 and 2019, Asia remained the dominant source region of WHF imports to the United States, accounting for 79% to 85% of these imports (Fig. 6). During this period, Vietnam became an increasingly important source of WHF while imports from China declined. In 2019, Vietnam displaced China as the leading source of WHF imports (Table 3). The combined U.S. imports from Vietnam and China in 2019 were 81% of all WHF imported. When this proportion of imports is multiplied by the IMS value in Fig. 4, imports from Vietnam and China represented 63% of the WHF available to domestic consumers in 2019 based on value.
Changes in Apparent Consumption
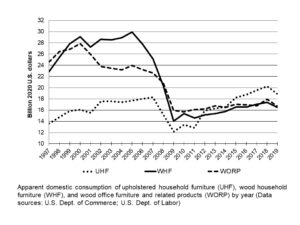
In 1997, domestic consumption of UHF approached $14 billion (Fig. 7). Between 1997 and 2002, the trend of UHF consumption increased at an annual rate of 5.3% to reach over $17 billion in value and remained stable through 2007. With the onset of the Great Recession, UHF consumption declined between 2007 and 2009 at an annual rate of 6.4% reaching a low of $12 billion in 2009. Since 2009, UHF consumption has trended upward at 3.9%, surpassing consumption of WHF in 2012 and exceeding WORP consumption in 2014. In 2016, UHF consumption exceeded its previous high set in 2007 and continued at relatively high levels through 2019. However, much of this growth in UHF consumption was supplied by imports as domestic shipments only increased by 2.5% annually since 2009 and remained well below the historic high levels of 2002 (Fig. 2). The role of imports in supplying UHF to U.S. consumers also is evident in the continuation of the upward trending IMS since 2009 (Fig. 4).
Table 3. Net Imports of Upholstered and Wood Household Furniture from China, Vietnam, and other Asian Sources in Selected Years (USDC various years; USDC, ITA 2021; USDL 2021)


Fig. 7. Apparent domestic consumption of upholstered household furniture (UHF), wood household furniture (WHF), and wood office furniture and related products (WORP) by year (USDC various years; USDC, ITA 2021; USDL 2021)
In 1997, WHF consumption approached $23 billion in value and increased at an annual rate of 8.4% until reaching a plateau between 2000 and 2005 (Fig. 7). Between 2005 and 2009, WHF consumption declined at an annal rate of 17.2% and was more than 50% below its historic high in 2009. Since 2009, the trend of WHF consumption has increased with all of this increase supplied through imports resulting in a continual increase in IMS (Fig. 4).
After reaching historical highs in 2000, WORP consumption decreased through 2004 (Fig. 7). Consumption of WORP remained relatively constant between 2002 and 2007, then declined at an annual rate of 17% between 2007 and 2009. While the 0.8% annual growth of WORP consumption since 2010 is more attributable to imports than domestic shipments, the IMS for this product group has never exceeded 7% since that year (Fig. 4).
A major factor contributing to the decline in WHF consumption during the study period was the relatively low levels of single-family home construction and associated home purchases between 2009 and 2019. The post-COVID pandemic surge in home construction and home purchases will most likely result in increased WHF and UHF consumption in the coming years. Still, the increased demand for these products will most likely be supplied by imports, primarily from Vietnam and China. By contrast, the increased work at home trends resulting from the COVID pandemic will most likely reduce traditional consumption of WORP but increase the demand for home office or dual purpose (office and home) furnishings.
CONCLUSIONS
- The 50% decline in wood-consuming furniture manufacturers (WCFM) shipments between 2000 and 2009 was primarily caused by reduced shipments of wood household furniture (WHF) and wood office furniture and related products (WORP). Since 2009, shipments of WHF have continued to decrease, WORP shipments have remained relatively constant, and UHF shipments have increased. However, in 2019 the combined value of shipments of all WCFM subindustries remained nearly 50% below 2000 levels.
- UHF has had the most consistent increase in imports, rising at an annual rate of 9.8% between 1997 and 2019. Imports of WHF increased at an annual rate of 14.4% between 1997 and 2005, declined sharply between 2005 and 2009, then trended upward following the Great Recession of 2009. By contrast, imports of WORP remained relatively constant through the study period.
- Imports of WHF and UHF have become an increasingly important source of products available to U.S. consumers, as indicated by market share. The import market share (IMS) for WHF increased from 23% to 78% between 1997 and 2019. Similarly, the IMS for UHF increased from 6% to 35% during this same period. This means that over three-quarters of the WHF and over one-third of the UHF available to U.S. consumers in 2019 was imported (on a value basis).
- In 1997, UHF imports originated primarily from Europe, with Italy as the largest supplier. By 2003, Asian imports equaled European imports with China becoming a major UHF supplier to the United States. After 2009, Asia was the dominant supplier of UHF with China the most important supplier in Asia. Since 2015, growth in Asian imports have been products originating from Vietnam. In 2019, it is estimated that one-third of all UHF available to the U.S. consumer originated from China or Vietnam.
- Asia was the most important source of WHF imports in 1997, with China being one of several suppliers within this region. By 2002, China became the dominant Asian supplier, and Vietnam became a secondary supplier in 2005. After 2009, WHF imports from China trended downward while shipments from Vietnam increased. In 2019, Vietnam exceeded China as the most important source of WHF imports. The combined shipments from China and Vietnam accounted for over 60% all WHF available to U.S. consumers in 2019.
- U.S. consumption of UHF has increased over the study period, but since 2009, this increase was accompanied by increased imports. Increased imports have been a major contributor to the decline in U.S. shipments of WHF. However, the 50% decline in apparent consumption between 2005 and 2009, and a continued level of low level of consumption since the Great Recession, also have contributed to reduced WHF shipments. The decline in WORP shipments primarily has been the result of reduced domestic consumption.
REFERENCES CITED
Buehlmann, U., and Schuler, A. (2009). “The U.S. household furniture manufacturing industry in 2008 – Status and opportunities,” Forest Products Journal 59(9), 20-28.
Bullard, S. H., and West, C. D. (2002). Furniture Manufacturing and Marketing: Eight Strategic Issues for the 21st Century (Bulletin FP 227), Forest and Wildlife Research Center, Mississippi State University, Starkville, MS.
Forbes, C. L., Sinclair, S. A., and Luppold, W. G. (1993). “Wood material use in the furniture industry: 1990‑1992,” Forest Products Journal 43(7/8), 59‑65.
Luppold, W., and Bumgardner, M. (2008). “Forty years of hardwood lumber consumption: 1963 to 2002,” Forest Products Journal 58(5), 6-12.
Luppold, W. G., and Bumgardner, M. S. (2009). “The wood household furniture and kitchen cabinet industries: a contrast in fortune,” Forest Products Journal 59(11/12), 93-99.
Luppold, W. G., and Bumgardner, M. S. (2011). “Thirty–nine years of U.S. wood furniture importing: Sources and products,” BioResources 6(4), 4895-4908. DOI: 10.15376/biores.6.4.4895-4908
Luppold, W. G., and Bumgardner, M. S. (2016). “U.S. hardwood lumber consumption and international trade from 1991 to 2014,” Wood and Fiber Science 48(3), 162-170.
Quesada, H. J., and Gazo, R. (2006). “Mass layoffs and plant closures in the U.S. wood products and furniture manufacturing industries,” Forest Products Journal 56(10), 101-106.
Schuler, A., and Buehlmann, U. (2003). Identifying Future Competitive Business Strategies for the U.S. Furniture Industry: Benchmarking and Paradigm Shifts (General Technical Report NE-304), USDA Forest Service, Northeastern Research Station, Newtown Square, PA.
Spelter, H., Stone, R. N., and McKeever, D. B. (1978). Wood Usage Trends in the Furniture and Fixtures Industry (Research Note FPL-0239), USDA Forest Service, Forest Products Laboratory, Madison, WI.
U.S. Department of Commerce, International Trade Administration (USDC, ITA). (2021). “Trade policy information system,” (https://tpis1.trade.gov/cgi-bin/wtpis/prod/tpis.cgi), accessed 25 June 2021.
U.S. Department of Commerce, Bureau of the Census (USDC). (2004). “2002 Census of manufacturing (NAICS sectors 31-33),” (https://www.census.gov/library/publications/2002/econ/census/manufacturing-reports.html), accessed 25 June 2021.
USDC. (2006). “Annual survey of manufactures, statistics for industry groups and industries 2005,” (https://www.census.gov/prod/2006pubs/am0531gs1.pdf), accessed 25 June 2021.
USDC. (2012). “2008 – 2011 Annual survey of manufactures (ASM): tables,” (https://www.census.gov/data/tables/time-series/econ/asm/2008-2011-asm.html), accessed 25 June 2021.
USDC. (2017). “2013 – 2016 Annual survey of manufactures (ASM): tables,” (https://www.census.gov/data/tables/time-series/econ/asm/2013-2016-asm.html), accessed 25 June 2021.
USDC. (2019). “2007 Census of manufacturing (NAICS sectors 31-33),” (https://www.census.gov/data/tables/2007/econ/census/manufacturing-reports.html), file name: ENC_2007_US_31SG3_with_ann., accessed 25 June 2021.
USDC. (2020). “2012 Census of manufacturing (NAICS sectors 31-33),” (https://data.census.gov/cedsci/table?q=EC1231a1&g=0100000US&tid=ECNBASIC2012.EC1231A1&hidePreview=true), accessed 25 June 2021.
USDC. (2021a). “2017 Census of manufacturing (NAICS sectors 31-33),” (https://data.census.gov/cedsci/table?q=ECNBASIC2017.EC1731BASIC&g=0100000US&tid=ECNBASIC2017.EC1731BASIC&hidePreview=true), accessed 25 June 2021.
USDC. (2021b). “2018 to 2019 Annual survey of manufactures (ASM): tables,” (https://www.census.gov/data/tables/time-series/econ/asm/2018-2019-asm.html), accessed 25 June 2021.
U.S. Department of Labor, Bureau of Labor Statistics (USDL). (2021). “Databases, tables & calculators by subject, PPI commodity data,” (https://data.bls.gov/PDQWeb/wp), accessed 11 Jan 2021.
Wan, Z., and Bullard, S. H. (2009). “Competitive strategy and business performance in the U.S. upholstered, wood household furniture industry,” Forest Products Journal 59(9), 15-19.
Article submitted: October 26, 2021; Peer review completed: December 5, 2021; Revised version received and accepted: December 8, 2021; Published: December 13, 2021.
DOI: 10.15376/biores.17.1.939-951