
Abstract
Anatomical characteristics of the plantation tree, Cunninghamia lanceolata were studied. Clonal variability and intra-tree variation, as well as its possibilities of application to the wood industry were analyzed for four clones. Tracheid length from the first to 17th annual ring within clones increased rapidly at first, and then plateaued. The maximum value appeared at the 14th annual ring of clone IV (3795 μm), and the minimum value appeared at the 1st annual ring of clone I (849 μm). Tracheid width and tracheid double wall thickness increased first and then tended to be flat or slightly decreased; tracheid length to width ratio showed an overall increasing trend; the variation of tracheid double wall thickness was not significant. Between clones, the variation coefficient of tracheid width, double wall thickness, and wall to cavity ratio were large. The tissue proportion within clones from large to small was the following: tracheid proportion > wood ray proportion > parenchyma proportion, and there was no significant difference between clones. The basic density within clones showed a gradual increase but a certain fluctuation; the difference between clones was not significant. The maximum crystallinity appeared in clone II (sapwood 55.1%, heartwood 51.2%), and the difference between clones was not significant.
Download PDF
Full Article
Anatomical, Physical, and Mechanical Parameters of Clone Plantation Tree, Cunninghamia lanceolata
Yuanhe Li, Chao Li, Yi Song, Yu Guo, and Lihong Yao *
Anatomical characteristics of the plantation tree, Cunninghamia lanceolata were studied. Clonal variability and intra-tree variation, as well as its possibilities of application to the wood industry were analyzed for four clones. Tracheid length from the first to 17th annual ring within clones increased rapidly at first, and then plateaued. The maximum value appeared at the 14th annual ring of clone IV (3795 μm), and the minimum value appeared at the 1st annual ring of clone I (849 μm). Tracheid width and tracheid double wall thickness increased first and then tended to be flat or slightly decreased; tracheid length to width ratio showed an overall increasing trend; the variation of tracheid double wall thickness was not significant. Between clones, the variation coefficient of tracheid width, double wall thickness, and wall to cavity ratio were large. The tissue proportion within clones from large to small was the following: tracheid proportion > wood ray proportion > parenchyma proportion, and there was no significant difference between clones. The basic density within clones showed a gradual increase but a certain fluctuation; the difference between clones was not significant. The maximum crystallinity appeared in clone II (sapwood 55.1%, heartwood 51.2%), and the difference between clones was not significant.
Keywords: Cunninghamia lanceolata; Tracheid morphological characteristics; Tissue proportion; Basic density; Crystallinity; MOR; MOE; Tensile test of wood veneer; Timber-variability
Contact information: College of Material Science and Art Design, Inner Mongolia Agricultural University, Hohhot 010018, P.R. China; *Corresponding author: yaolihong82@163.com
Yuanhe Li and Chao Li contributed equally to this work.
GRAPHICAL ABSTRACT
INTRODUCTION
Cunninghamia lanceolata is a subtropical tree species, mainly distributed in China and a small part in Vietnam. Within the territory of China, C. lanceolata is most widely distributed in the Yangtze River Basin and the south of Qinling Mountains, mainly in Zhejiang, Guangxi, Fujian, Hunan, Guizhou, Jiangxi, Guangdong, Anhui, Sichuan, and Hubei provinces; Jiangsu, Henan, Shanxi, and Yunnan also have a small distribution. C. lanceolata has wide distribution, fast growth, and high economic value in China. The cultivation of its plantation has made great contributions to alleviate the shortage of wood resources in China. The new individuals produced by clonal C. lanceolata breeding can maintain the inherent characteristics of excellent varieties, and the traits of the offspring are highly consistent. The growth period and growth are relatively uniform, which is convenient for directional cultivation. It is also beneficial to improve wood quality, to save labor, and to increase yield by clonal breeding of C. lanceolata. There are significant differences among different clones of C. lanceolata. The excellent characteristics of clonal C. lanceolata with fast growth and strong resistance are increasingly prominent. The production process of C. lanceolata in clonal plantation has been relatively mature. The typical practice is to cultivate small and medium diameter timber and modify the material to compensate for the lack of large diameter timber and high-quality timber in current forest resources.
The diseases endangering C. lanceolata plantation mainly include the sudden fall of seedlings and anthracnose. The former can be prevented by spraying 0.1% sodium p(dimethylamino)benzenediazo sulfonate or 0.5~1% ferrous sulfate solution, and the latter can be prevented by ditching and soil cultivation, clearing diseased branches, deep turning and tending, and interplanting green manure. Semanotus bifasciatus is the main pest of C. lanceolata plantations. It can be sprayed with 40% omethoate EC 100 ~ 200 times, and injected with dichlorvos 300 times into the wormhole, and then sealed with yellow mud to poison the larvae entering the xylem. The wood of plantation C. lanceolata can be used for construction, bridges, shipbuilding, pillars, stakes, poles, furniture, and wood fiber industry raw materials, and its market demand is huge. In the wood-based panel industry, plantation C. lanceolata wood can be used to manufacture Glulam, Cross-laminated timber (CLT), Block board, Laminated Veneer Lumber (LVL), Oriented Strand Board (OSB), and Oriented Strand Lumber (OSL). The timber of C. lanceolata plantation is of great significance to make up for the serious shortage of large diameter timber of forest resources, and it has great potential in the application of wood-based panel industry.
With the reduction of natural forest resources in the world, plantation timber as an important raw material has become the focus of many researchers. In addition to the plantation of C. lanceolata, other tree species of plantation wood research work have certain enlightenment to this study. In one study, sawn boards from a fiber-managed plantation Eucalyptus globulus resource in Australia were tested to investigate the recovery rate, visual characteristics, and flexural properties to the extent of utilizing the resource effectively in structural applications and establishing the relevant allowable stress values. Recovery rate of the boards (%) equals the volume of the boards before the final planning stage calculated by measuring the cross-sectional area and length of the boards (m3) divided by the volume of the harvested logs (m3) (Derikvand et al. 2018). Moreover, fiber-managed plantation Eucalyptus nitens resource that was managed to produce woodchips was analyzed to develop higher-value structural products from plantation eucalypt timber that could create new markets for such plantation resources (Derikvand et al. 2019). Both unthinned and unpruned plantation Eucalyptus nitens and Eucalyptus globulus were used in the evaluation of three-ply cross-laminated timber (CLT) floor panels; research has found the flexural performance of CLT panels from E. globulus is higher than that of E. nitens (Pangh et al. 2019).
The nature of plantation trees is affected by the initial planting density, thinning intensity, soil type, cultivation method, and fertilization treatment. Moreover, variability also affects plantation trees, causing great inconvenience to wood quality management and its processing and utilization. Variability is a key issue in the drying of hardwood timber, the mechanical properties, and the correlations with basic density and diffusion coefficient (Watt and Trincado 2019). The initial moisture content that are measurements of variability have been reported by analyzing Eucalyptus pilularis within-tree and between-trees from northern New South Wales in Australia (Cabardo et al. 2006, 2007). The variability of the properties, such as density, modulus of elasticity, and bending strength, is normally analyzed in a linear mixed model with relative tree size and log type as fixed effects, and with site and tree as random variables (Vestøl et al. 2012). Also, modelling the distribution of the variability of timber’s mechanical properties will improve its value and lead to more reliable designs (Pommier et al. 2014). As a natural unidirectional fiber composite, the considerable variability in mechanical properties of timber is both random and spatial and is usually referred to as “random spatial variability”, which is most likely to influence the response of structural elements made of clear timber (Moshtaghin et al. 2016). To analyze the spatial variability of above-ground biomass (AGB), stocks of managed forests, linear (LM), generalized additive (GAM), and Random Forest (RF) empirical models, with variables related to forest management, stand structure, topography, and climate, are developed to derive spatially explicit estimates and their uncertainty, and compared (Soriano-Luna et al. 2018). The variability of C. lanceolata mixed with other hardwood forest in southeastern China, which was observed over a period of 15 years (1996 to 2011), has been studied for guiding timber harvesting at different intensities (Wu et al. 2018).
The characteristics and variations in the size, shape, and arrangement of various cell types in wood directly affect its properties. In coniferous trees, the total number of tracheids is approximately 90% of the trunk, and tracheids are responsible for the mechanical support and material transport of the tree. Therefore, tracheids largely determine the overall structure and performance of coniferous wood. The morphological characteristics, such as tracheid radial diameter, tangential diameter, and wall thickness, are not only different from each other in different provenances, clones and tree species, but also different from each other in different individuals and parts of the same tree species. Fundamental tracheid morphological characteristics, such as wall thickness (Schimleck and Evans 2004) and length (Hauksson et al. 2001; Schimleck et al. 2004), are determined by secondary measurement of NIR spectroscopy. Research suggests that NIR spectra correlated with tracheid properties is accurate to develop calibrations for the estimation of density related properties (Jones et al. 2005).
Wood tissue proportion is the percentage of all types of cells in cross-section that compose an area, and coniferous wood tissue includes the following: tracheid, longitudinal parenchyma, wood ray, and resin canal. The study of wood tissue proportion is helpful to understand the correlation between wood element and wood properties, which can provide a reliable scientific basis for evaluation of wood quality and rational utilization of wood. Conventional methods of tissue proportion measurement are primarily weighing and grid-counting, and these have the deficiencies of less accuracy, time-consuming, and heavy load for the operators (Yu et al. 2009). Technology development allows for digital transverse microstructure images to be photographed through the microscope and video camera; these images are then analyzed using computer image processing techniques to measure wood tissue proportion (Yu et al. 2009).
The mechanical and physical properties of wood are important factors used to determine the suitability and application of wood material (Babiak et al. 2018). Wood basic density is defined as the ratio of dry matter content to green volume of a sample and is the most widely used indicator of wood quality (Schimleck et al. 2018). The wood basic density is easy to measure and has an important influence on the evaluation of wood properties, not only on the mechanical strength of wood, but also on the genetic improvement of wood. Wood basic density is an important indicator of wood physical properties, pulp properties, and pulpwood productivity (Ona et al. 1998; Raymond and Muneri 2001; Zhang et al. 2011). Basic density is especially appropriate for degraded waterlogged wood that is prone to excessive shrinkage during drying (Passialis 1998). The genetic variation of basic density includes radial and longitudinal variation within-clone, between-clones, different provenances, and different species, of which within-clone variation in basic density is low (Lima et al. 2000). Generally, there is some association between basic density and percentage heartwood at the species level, but no association at the provenance within species level (Searle and Owen 2005). In a test of wood basic density related to nutrient concentration, fertilizer decreased basic wood density 7% at ground level and 5% over the entire stem (Crous et al. 2009). Obviously, the measurement of wood basic density is a requirement in many wood-product markets (Deng et al. 2014), especially the plantation wood market. Wood basic density can be measured using diverse direct and indirect methods, of which the most common direct method for determination of wood basic density consists of a gravimetric procedure (Vikberg and Elustondo 2015) sampling with a Pressler borer, which results in wood cores that are easy to weigh. The indirect methods include densitometric methods that are based on high-resolution imaging of differences in attenuation of non-visible radiation by the samples investigated (Diesel et al. 2014). In addition to these traditional methods, near-infrared spectroscopy (NIRS) has the potential of predicting wood basic density rapidly and nondestructively (Liang et al. 2019). In several tests, British Standards and ASTM (American Society for Testing and Materials) standard wood testing procedures are referred by researchers to analyze wood basic density (Sseremba et al. 2020).
Wood behaves like an elastic solid when force is applied to it, and therefore modulus of elasticity (MOE) is used to describe the stiffness of wood; in general a high value of MOE implies a high resistance of wood to deformation (Olaoye and Okon-Akan 2020). Scientists conventionally use universal testing machine (UTM) to determine elasticity of wood, and UTM tests are considered expensive, demanding high maintenance cost, and are destructive to samples (Amera et al. 2005). Hence, the use of non-destructive acoustic methods (NDAT) is needed. There exist several non-destructive acoustic methods for estimating elasticity of wood based on ultrasound (Wang et al. 2003), stress waves, infrared spectroscopy (Bailleres et al. 2005), and vibration method (Barrett and Hong 2010; Almeida et al. 2014; Guan et al. 2019; Olaoye and Okon-Akan 2020). After analyzing anatomical, physical, and mechanical properties of plantation wood, this study considers four strains of clone plantation C. lanceolata timber in Kaihua County, Zhejiang Province as the research object. The general rule of plantation C. lanceolata properties was analyzed between anatomical, physical, and mechanical characteristics and timber-variability, for guiding plantation wood production, improving the level of management of forestry production and the comprehensive utilization of plantation C. lanceolata resource and expanding the application range of plantation C. lanceolata, which has practical significance. The objective is also for the plantation C. lanceolata wood to simultaneously meet a series of property requirements and to list each of the important properties that likely would be regarded as important for decision-making in wood industry.
EXPERIMENTAL
Materials
Specimens of Cunninghamia lanceolata were obtained from Kaihua County tree farm in Zhejiang Province, located at latitude 28° 54` N and longitude 118° 01` E. The region belongs to the subtropical monsoon climate zone with distinct seasons and warm and humid. The average annual temperature is 16.4 °C, sunshine duration is 1712.5 h, frost free period is 252 days, and the year average rainfall is 1814 mm. The four clones, fostered in 1998 and cut down in 2017, were close to each other and grew on the same soil and climate conditions, and the same planting density and cultivation treatments. Each sample tree, one tree per clone, was sawn into segments of 2 m length and the height ranged from 3.5 m to 5.5 m. The basic information of each sample tree is shown in Table 1.

Methods
The method of tracheid morphological characteristic measurement is as follows: a 3-cm-thick disk was sampled at the bottom of each sample tree segment. Then, from these sample disks, 3 to 5 match-stub-like samples were obtained from earlywood of each annual ring from the southern part of each sample disk. Each match-stub-like sample was placed into a test tube, and distilled water was added; test tubes were then heated in 90 °C water baths for 40 min until the samples moved to the bottom of the test tubes. When the sample sank to the bottom of the test tube, it began to discharge hot air in the test tube. After discharging the air, the sample was put into a mixed solution of the ratio of 30% hydrogen peroxide to glacial acetic acid was 1: 1. The test tube was sealed with the preservative film, and then it was perforated on the preservative film to ventilate. The water bath continued to heat for 2 h until the samples turned white. Then, the samples were rinsed thoroughly with distilled water, and then, using forceps, a small amount of the sample was placed on the microscope slide with a drop of distilled water. The samples were slapped gently with an anatomical needle until the samples were completely dispersed.
After air-drying the samples, an optical microscope was used to observe and measure the intact tracheid in the prepared microscope slide. Tracheid radial diameter was measured at 40× magnification; tracheid tangential diameter and double wall thickness were measured at 400× magnification (light microscope model: SWN-800; Beijing PDV Instrument Co., Ltd., Beijing, China). Tracheid radial diameter and tangential diameter were measured at three positions near the middle of tracheid, and the average value of measured values at the three positions was taken as final tracheid radial diameter and tangential diameter value. For each clone, 80 samples per annual ring were randomly measured, and the average value of tracheid morphological characteristics were taken as final radial diameter value, tangential diameter value, and double wall thickness value of each sample. After the measurement, data was input to Excel software (Microsoft Corp., Excel 2019, Redmond, WA, USA) to calculate the tracheid double wall thickness, length-width ratio, and wall-cavity ratio. Tracheid length to width ratio is equal to tracheid length value divided by tracheid width value; tracheid wall to cavity ratio is equal to the obtained tracheid double wall thickness value divided by tracheid width value.
The test method for determination of tissue proportion consisted of five steps. First, materials were selected by taking a 3-cm-thick disk at the same height of each clone C. lanceolata; a small wooden block was obtained from heartwood and sapwood in the 3-cm-thick disk. Second, the wooden blocks were placed in a beaker and heated in a water bath until samples reached the slicing requirements. Approximately 2 to 3 slices each from cross and tangential sections of the sample were cut by LeiCa sliding (LEICA ULTRACUT R; LEICA, Weztlar, Germany) for later use. The thickness of slices was 18 μm. Third, the slices were stained for 4 h by placing slices in 4% safranine staining solution. Then, the stained slices were gradually dehydrated for 10 min at different ethanol concentrations of 25%, 50%, 75%, 95%, and 100%, respectively. Finally, xylene was used to treat the samples transparently and seal them with gum. Image analyzer with digital image processing hardware (Model: Quantimet 720; IMANCO, Cambridge, U.K.) was used in conjunction with an optical microscope (Model: SWN-800; Beijing PDV Instrument Co., Ltd., Beijing, China) to measure tissue proportion, and each sample was measured 30 times.
In terms of wood basic density test, the method is adopted as a drainage method according to GB/T 1933 (2009). The specific operation is as follows. First, 2 cm width of small sticks were cut through the pith heart center along the north-south direction at the same height of four clones, and irregular samples were made within each annual ring. Secondly, 17 samples were obtained for each clone; they were numbered and placed in beakers. Distilled water was added to the beaker, soaking the sample more than 1 to 2 cm until it reached a saturated state. The volume of each sample was measured by saturated water method, and then the sample was placed in an oven at 103 ± 2 °C until it was completely dried; the weight of each sample was subsequently measured. The wood basic density is calculated using Eq. 1,
ρ0 = m0 / V0 (1)
where m0 is the dry mass of each sample (g), V0 is the volume of moist wood (cm3), and ρ0 is wood basic density (g/ cm3).
The crystallinity was measured using an X-ray diffractometer (Model: Smart Lab SE, Rigaku, Tokyo, Japan). The different clones were sampled according to heartwood and sapwood, and ground into wood powder by a wood powder machine. The powders above 100-mesh were screened and placed in the constant temperature and humidity box to balance the moisture content for two weeks. During the test, the CuK radiation wavelength in the X-ray was 1.54059 Å, the 2θ sweep angle ranged from 3 to 50°, and the scanning speed and step length were 0.02°. Referring to the Segal method, the maximum of diffraction peak near 22° and diffraction peak minima near 18° are mainly obtained during the test, which are calculated according to the relative crystallinity calculation Eq. 2,
Crl = (I002 – Iam)/I002 ×100% (2)
where Crl is relative crystallinity (%), I002 represents the maximum intensity of lattice diffraction angle, which generally occurs near 2θ = 22.5º, and Iam is the scattering intensity of amorphous background diffraction near 18°.
According to the maximum peak width value at the crystal surface 002, the Dhkl microcrystalline width was obtained by the Scherer formula, Eq. 3,
Dhkl = kλ / (β cosθ) (3)
where Dhkl is the grain diameter (nm) perpendicular to the direction of the crystal surface (HKL), λ is the wavelength (0.154 nm), β is the widest peak width of the diffraction 2θ, θ is the diffraction angle, and k is Scherer constant (0.9).
Modulus of rupture (MOR) values of different clones were tested according to GB/T 1936.1 (2009). The specimen dimension was 20 mm × 20 mm × 300 mm (radial × tangential × longitudinal). In the mechanical test, the specimens were evenly placed on two supports of the mechanical testing machine, with a distance of 240 mm between the supports. The loading method was adopted in the center of the specimen, and the loading speed was evenly added with the radial of the specimen in the middle at a speed of 10 mm/min. The MOR is calculated using Eq. 4,
σbw= (3Pmax I)/ (2bh2) (4)
where σbw is the bending strength when the moisture content of the sample is W (65﹪) (MPa), Pmax is the failure load (N), I is the distance between the two supports (mm), b is sample width (mm), and h is the sample height (mm).
Modulus of elasticity (MOE) of specimens was tested according to GB/T 1936.1 (2009). The MOE was calculated using Eq. 5,
EW = (23Pl3)/ (108bh3 f) (5)
where EW is the flexural elastic modulus when the moisture content of the sample is W (65﹪) (MPa), P is the difference between upper and lower loads (N), l is the distance between the two supports (mm), b is sample width (mm), h is the sample height (mm), and f is the deformation value of the upper and lower load samples (mm).
Tensile test of wood veneer is achieved by using a micromechanical testing machine (Model: 5948; Instron, Norwood, MA, USA). Different clones of plantation tree were prepared at the same height cut a 5-cm-thick disc, through the pith center according to the north-south sawing width of 3 cm center strip, soaked in water for softening, slide cutting in each annual ring’s early wood section, each annual ring took 3 pieces of 80-μm-thick micro-slice samples, placed between two slides. Specimens were placed between two slides and clamped with a rubber band. Specimens were placed in a constant temperature and humidity box with ambient temperature of 20 °C and moisture content of 65%. Specimens were tested after 2 weeks when the equilibrium moisture content was adjusted. In the tensile test, specimens were placed in the fixture of the micro-mechanics testing machine; the width and thickness of the measured wood chip sample were inputted, and the maximum tensile stress value after fracture was tested. The tensile strength of the wood chip was calculated automatically by the computer.
Stepwise regression analysis method was used to analyze the effects of 10 anatomical characteristics on modulus of rupture (MOR), modulus of elasticity (MOE) and wood veneer tensile strength of clone plantation C. lanceolata. The regression model was calculated by SPSS 13.0 (IBM, SPSS 13.0, New York, USA).
RESULTS AND DISCUSSION
Analysis of Tracheid Morphological Characteristic Value of Each Clone Plantation Cunninghamia lanceolata
The secondary xylem of Cunninghamia lanceolata is mainly composed of tracheid cells, whose anatomy plays a fundamental role in the physical and mechanical properties of the tissue (Liu and Zhao 2012). From the microscopic level, the representative anatomical characteristics of C. lanceolata mainly include tracheid length, tracheid width, tracheid double wall thickness, tracheid length to width ratio and tracheid wall to cavity ratio (Locosselli and Ceccantini 2012). These special parameters determine the morphology of tracheid at the cellular level (Adey-Johnson et al. 2020).
In the paper industry, the longer the tracheid length, the greater the tear resistance, tensile strength, and folding resistance of paper (Liu and Zhao 2012). According to the research, tracheid width is also an important factor affecting the properties of wood pulp, papermaking, and paper. Fibers with large cavity and thin wall are conducive to the formation of paper and the interweaving of fibers (Abdel-Aal et al. 2015). Fibers with thick wall and small cavity have high tear strength. Tracheid double wall thickness affects the strength of paper, and it is also the material basis for affecting wood density and strength-weight ratio. Tracheid length to width ratio is an important factor affecting the performance of wood fiber materials. The larger it is, the more favorable the fiber combination is. It is generally believed that the tracheid length to width ratio greater than 80 can meet the requirements of fiber industry raw materials. Tracheid wall to cavity ratio is the ratio of tracheid wall thickness to lumen diameter (Zhu et al. 2006), which is called the Runkel coefficient in the paper industry. According to the Runkel theory, when the ratio is less than 1, the fiber contact area can be increased in the wood processing, thereby increasing the utilization rate of wood, which is helpful for the processing of wood materials belongs to excellent fiber raw materials. On the contrary, when the ratio is greater than 1, it is inferior.
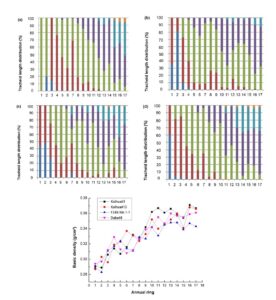
It should be noted that, due to the directional cultivation of clonal plantation cultivation conditions in sufficient water and soil fertility, the formation of earlywood within every annual ring accounted for the majority of the material and thus can be regarded as being more representative (Vaganov et al. 2009). Accordingly, its properties can be used to summarize the characteristics of C. lanceolata from a relatively macro level on the variability of 1 to 17 annual rings, thus ignoring the variability of earlywood and latewood (Havimo 2010) within annual rings. Among all the anatomical characteristics, tracheid length is the most direct parameter to reflect the tracheid morphological characteristics (Watt et al. 2008). Therefore, the tracheid length distribution figure of four clones from 1 to 17 annual rings was specially presented, in order to observe the distribution and variability (Fig. 1).
The experimental data showed that the tracheid length showed an overall trend of gradual increase from 1 to 17 annual rings. Only the 1st and 2nd annual ring of clone I showed a longer tracheid length, and then from the 3rd annual ring it began to show the same rule as other clones. This particular tracheid length in the 1st and 2nd annual ring of clone I was due to its rapid maturation in the growth environment during the first and second years. It has been shown that a longer average tracheid length can be associated with more productive ecosites that supported faster growth (Townshend et al. 2015). The distribution of tracheid length of clones II, III, and IV showed high similarity from 1 to 17 annual rings, while clone I had certain difference compared with other clones, but the difference was not significant.
Overall, almost all four clones had tracheid length longer than 2000 μm in length from the 3rd annual ring, and more than 3000 μm in length from the 8th annual ring. In addition, the common law reflected by the four clones was the annual ring width gradually decreased while the tracheid length gradually increased from 1 to 17 annual rings, so it can be speculated that there was a significant negative correlation between the tracheid length and the annual ring width.
Pashin and Zeeuw (1980) divide wood fiber and tracheid radial variability-law into three types: type Ⅰ, tracheid length rises rapidly from pith heart center to bark at first, and then remains horizontal when tracheid length reaches a certain age; type Ⅱ, tracheid length rises gradually from pith heart center to bark; type Ⅲ, the tracheid length increases to a maximum and then decreases. In Fig. 2(a)(b)(c) reflected the radial variability of tracheid in clone I. From Fig. 2(a), it can be found that the tracheid length of clone I changed significantly with the increase of annual ring age, showing an overall increasing trend, belonging to type I (Pashin and Zeeuw 1980). The reason for this may be due to the vertical division of primitive cells in the cambium and the intergrowth of daughter cells. The tracheid length of the 1st annual ring was the minimum (849 μm), and the tracheid length increased rapidly from the 1st to the 6th annual ring. From the 7th to the 17th annual ring, tracheid length showed an increasing trend, but the fluctuation was large and the increasing trend was relatively flat. The maximum value was 3367 μm at the 16th annual ring. This may be due to the growth of trees to a certain time; the primordial cells in the cambium began to mature and became longer, and the primitive cells in the shorter cambium gradually disappeared and produced daughter cells (Yarnan 2007).


Fig. 1. The distribution of tracheid length in each annual ring: (a): clone I; (b): clone II; (c): clone III; (d): clone IV
According to Fig. 2(b)(c), there was no significant change law in the tracheid width and tracheid double wall thickness from 1 to 17 annual rings. The minimum tracheid width of clone I was 29.96 μm at the 9th annual ring, and the maximum width was 47.22 m at the 15th annual ring, while the maximum tracheid double wall thickness was 4.98 μm. The values of tracheid length to width ratio and tracheid wall to cavity ratio increased and fluctuated greatly from 1 to 17 annual rings. The minimum value of tracheid length to width ratio was 22.35 at the 1st annual ring, and the maximum value was 117.1 at the 17th annual ring. Interestingly, the mean value of tracheid length to width ratio between the 5th and 17th annual ring was greater than 50.

Fig. 2. (parts a-f): Tracheid radial variability of four clones: (a): Tracheid length- clone I; (b): Tracheid width, tracheid double wall thickness- clone I; (c): Tracheid length to width ratio, tracheid wall to cavity ratio- clone I; (d): Tracheid length- clone II; (e): Tracheid width, tracheid double wall thickness- clone II; (f): Tracheid length to width ratio; tracheid wall to cavity ratio- clone II


Fig. 2. Tracheid radial variability of four clones: (a): Tracheid length- clone I; (b): Tracheid width and tracheid double wall thickness- clone I; (c): Tracheid length to width ratio and tracheid wall to cavity ratio- clone I; (d): Tracheid length- clone II; (e): Tracheid width and tracheid double wall thickness- clone II; (f): Tracheid length to width ratio and tracheid wall to cavity ratio- clone II; (g): Tracheid length- clone III; (h): Tracheid width and tracheid double wall thickness- clone III; (i): Tracheid length to width ratio and tracheid wall to cavity ratio- clone III; (j): Tracheid length- clone IV; (k): Tracheid width and tracheid double wall thickness- clone IV; (l): Tracheid length to width ratio and tracheid wall to cavity ratio- clone IV
In Fig. 2, parts (d) (e) (f) reflected the radial variability of tracheid in clone II. According to Fig. 2(d), it indicated that the tracheid length of clone II changed significantly with the increase of annual ring age and showed an increasing trend in general. The tracheid length was shorter in the early annual ring age, and the minimum was 1031 μm at the 2nd annual ring. The tracheid length increased rapidly from the 1st to 10th annual ring, and from the 10th to 17th annual ring. The tracheid length increased generally but fluctuated to a certain extent and reached the maximum at the 17th (3758 μm). According to Fig. 2(e), there was no obvious change law of tracheid width with the minimum value (30.1 μm) at the 6th annual ring and the maximum value (50.9 μm) at the 13th annual ring. Tracheid double wall thickness showed an overall increasing trend in the 1 to 11 annual rings. From the 12th annual ring, tracheid double wall thickness started to decrease and then remained stable with the maximum value (6.05 μm) at the 11th annual ring. According to Fig. 2(f), tracheid length to width ratio increased with the increase of annual ring age and reached the maximum value (93.3) at the 16th annual ring. Tracheid wall to cavity ratio from 1 to 17 annual rings showed a trend of first increase and then decrease and fluctuated greatly, the maximum value was 0.243 at the 6th annual ring.
Parts (g), (h), and (i) of Fig. 2 reflected the radial variability of tracheid in clone III. According to Fig. 2(g) the tracheid length changed significantly with the increase of annual ring age and the minimum value was 1155 m. The tracheid length increased rapidly from 1 to 13 annual rings, and slowed down from 13 to 17 annual rings, reaching the maximum value of 3614 μm at the 17th annual ring. According to Fig. 2(h), the radial variation of tracheid width was first increased and then decreased. The minimum value was at the 3rd annual ring (32.3 μm), and the maximum value was at the 9th annual ring (40.4 μm). Tracheid double wall thickness generally showed a trend of first increase and then decrease, and the maximum value (6.61 μm) appeared at the 8th annual ring. According to Fig. 2(i), tracheid length to width ratio gradually increased and reached the maximum at the 16th annual ring (106.6). There was no obvious variation in tracheid wall to cavity ratio, and the maximum value was 0.282 at the 11th annual ring.
In Fig. 2, parts (j), (k), and (l) reflected the radial variability of tracheid in clone IV. Tracheid length changed significantly with the increase of annual ring age, showing an overall increasing trend and a slight fluctuation with minimum value (977 μm) at the 1st annual ring. Tracheid length increased rapidly from 1 to 14 annual rings, and the increasing trend slowed down from 14 to 17 annual rings, reaching the maximum at 14th annual ring (3795 μm). The radial variation laws of tracheid width and tracheid double wall thickness were similar. With the increase of annual ring age, they generally increased first and then tended to be flat, and the variation coefficient of tracheid double wall thickness was large. The minimum value of tracheid width was at the 3rd annual ring (30.4 μm), and the maximum value was at the 10th annual ring (47.7 μm). The maximum value of tracheid double wall thickness was 6.07 μm at the 11th annual ring. Tracheid length to width ratio gradually increased and reached the maximum value of 93.3 at the 13th annual ring. There was no obvious variation in tracheid wall to cavity ratio, and the maximum value was 0.192 at the 2nd annual ring. Among the four strains of C. lanceolata, the average tracheid length ranged from 2369 μm to 2568 μm (Fig. 1). Among the four different clones, the coefficient of variation was greater than 28%, indicating that the value of tracheid length varies greatly in radial direction (Fig. 2).
Under the 0.01 level, the clone of C. lanceolata tracheid double wall thickness was influenced noticeably. The value of tracheid double wall thickness from large to small was respectively Ⅳ (4.95 μm), Ⅲ (4.83 μm), Ⅱ (4.59 μm), Ⅰ (4.03 μm). The largest value was 22.9% higher than that of the smallest. Tracheid width and tracheid wall to cavity ratio exhibited a remarkable difference between clones (0.01 < P < 0.05). Tracheid width value from large to small was: Ⅲ (38.12 μm), Ⅰ (36.34 μm), Ⅱ (35.95 μm), and Ⅳ (33.79 μm). The average tracheid width of clone Ⅲ was 12.81% higher than the minimum value. The variation coefficient of different clones was relatively small and the morphological value of tracheid width is stable.
Average tracheid wall cavity from large to small was: Ⅲ (0.18) > Ⅱ (0.15) > Ⅳ (0.14) > Ⅰ (0.12). The variation coefficient of clone Ⅰ, Ⅱ, and Ⅲ were more than 20%, and showed large variations in stability. The range of variations was large and unstable.
Repeatability is an important genetic parameter in tree clone breeding, and it is the proportion of the sum of environmental variance and genotype variance in the expression variance (Ivkovic and Rozenberg 2004). The repeatability was calculated using Eq. 6,
h2 = 1 – 1⁄F (6)
where F is the variance test value.
Because there was no noticeable difference in the tracheid length and the tracheid length to width ratio between clones, one can conclude that the index was less affected by genetic factors, so the estimation of its repeatability was not considered. The repetition force of the tracheid width, the tracheid double wall thickness, and the tracheid wall to cavity ratio were 0.739, 0.774, and 0.618, respectively, all of which were above the medium level. This indicates that these indicators are controlled by genetics above the medium level and could provide a theoretical basis for genetic improvement.
Analysis of Tissue Proportion of Each Clone Plantation Cunninghamia lanceolata
Tissue proportion values from large to small represent tracheid proportion, wood ray proportion, and parenchyma proportion, respectively. Based on Fig. 3, the tracheid proportion and parenchyma proportion of heartwood were lower than that of sapwood. This may be due to the relatively small tracheid width and high mean tracheid density at primary growth of plantation. When the plantation becomes mature, primitive cell division in the cambium is stable, and the tracheid proportion and parenchyma proportion increased, which reflects that the moisture and inorganic salt transport capacity of sapwood is relatively strong. Wood ray proportion is affected by tracheid proportion and parenchyma proportion. With the increase of the growth ring age, tracheid proportion increased and wood ray proportion decreased. Moreover, there was no noticeable difference between sapwood and heartwood at the level of α = 0.05. According to analysis of variance, there is no noticeable difference in tracheid proportion, parenchyma proportion, and wood ray proportion between the four clones.
Analysis of Basic Density Leading to Radial Variability for Each Clone Plantation Cunninghamia lanceolate
According to Fig. 4, the basic density of radial variability for each plantation tree gradually increased and fluctuated to a certain extent above and below the trend line from pith heart center to bark. The minimum value appeared near the 2th annual ring, which is approximately 0.29 g/cm3. The mean basic density of “F24X-NA-1-1 (Ⅲ)” was lower than the other three plantations with a value of 0.326 g/cm3, while others is approximately 0.335 g/cm3. There was no noticeable difference in the basic density for each plantation tree between clones at the level of α = 0.1.

Fig. 3. Discrepancy of tracheid proportion (a), wood ray proportion (b), and parenchyma proportion (c) between heartwood and sapwood

Fig. 4. Radial variation of basic density of each clone plantation trees
Analysis of Crystallinity for Each Clone Plantation Cunninghamia lanceolata
According to Tables 2 and 3, the crystallinity of four plantations in sapwood was greater than that of heartwood, and the variation within clone and between clones was not noticeable at the level of α = 0.1. The crystallinity is the percentage of crystal area in the whole cellulose. Crystallinity affects the mechanical properties of wood. Relevant studies have shown that crystallinity is positively correlated with wood density, bending strength, hardness, and other indicators, while negatively correlated with impact toughness, moisture absorption, and other properties. Therefore, the variability between clones should not be considered when breeding for the plantation.

Establishment of Multivariable Regression Equation Among Anatomical, Physical and Mechanical Parameters for Clone Plantation Cunninghamia lanceolata
Stepwise regression is a regression function that introduces and removes independent variables step-by-step and reflects the influence degree of multiple independent variables on dependent variables. Stepwise regression analysis of each parameter is made by multivariate regression,
y = b0 + b1 × x1 + b2 × x2 +… + bm × xm
where independent variables are basic density (x1), tracheid length (x2), tracheid width (x3), tracheid double wall thickness (x4), tracheid length-width ratio (x5), tracheid wall-cavity ratio (x6), tracheid proportion (x7), parenchyma proportion (x8), wood ray proportion (x9), crystallinity (x10), and dependent variables are MOR (y1), MOE (y2), wood veneer tensile strength (y3).


According to the regression model (Table 4, 56), it can be concluded that the most effective anatomical parameters to MOR (y1) include basic density (x1), tracheid width (x3), tracheid wall-cavity ratio (x6), tracheid proportion (x7), and crystallinity (x10). Mathematical model concluded is given as Eq. 7:
y1 = 17.001x1 + 2.433x3 + 7.92x6 + 14.237x7 + 7.457x10 – 47.824 (7)

According to Tables 7, 8, and 9, it can be concluded that the most affectable anatomical parameters to MOE (y2) include basic density (x1), tracheid length (x2), tracheid proportion (x7), and parenchyma proportion (x8). The mathematical model concluded is given as Eq. 8:
y2 = 4006.679 – 13.52x1 + 8.44x2 + 0.504x7 – 0.17x8 (8)


According to Tables 10, 11, and 12, it can be concluded that the most effective anatomical parameters to wood veneer tensile strength (y3) include basic density (x1), tracheid length (x2), tracheid proportion (x7), and crystallinity (x10). The mathematical model concluded is given as Eq. 9:
y3 = 212.83x1 + 3.84x2 + 0.46x7 + 4.13x10 – 63.06 (9)
CONCLUSIONS
In this study, several mathematical regression equations were established to reveal the general rule of each anatomical, physical, and mechanical properties.
- From 1 to 17 annual rings, tracheid length increased rapidly at first, and then it increased slowly, belonging to type I (Pashin); tracheid length to width ratio also showed an overall increasing trend with the increase of annual ring age, and there was a certain fluctuation. Tracheid width and tracheid double wall thickness showed a slight increasing trend with the increase of annual ring age, and slightly decreased or tended to be flat after the 13th annual ring. The other tracheid morphological indexes had no obvious radial variation. Among clones, the difference of tracheid double wall thickness was significant at the α = 0.1 level. There were significant differences in tracheid width and tracheid wall to cavity ratio. There was no significant difference in tracheid length and tracheid length to width ratio.
- The basic density of plantation tree Cunninghamia lanceolata increased from pith heart center to bark within-clone. At the level of α = 0.1, basic density was not significant between-clones. Crystallinity, MOR, and MOE in sapwood was larger than that of heartwood, and the variation was not significant within-clone and between-clones. Wood veneer tensile strength increased with increasing of growth ring age.
- The multiple regression equations between MOR (y1), MOE (y2), Wood veneer tensile strength (y3), and each anatomical factor established by variance analysis method were: y1 = 17.001x1 + 2.433x3 + 7.92x6 + 14.237x7 + 7.457x10 – 47.824; y2 = 4006.679 – 13.52x1 + 8.44x2 + 0.504x7 – 0.17x8; y3 = 212.83x1 + 3.84x2 + 0.46x7 + 4.13x10 – 63.06. Considering that the four clones were cultivated under specific conditions in Kaihua County Tree Farm, Zhejiang Province, the current formula has guiding significance for the four clones, and the promotion of the formula needs further research.
- Since the four clones mainly contain tracheids having lengths greater than 3000 m from the 8th annual ring, and then the length increases gradually, it can be inferred that the 8th to the 17th annual rings of wood in the experiment can be used as indicators of high-quality raw materials in the paper industry.
ACKNOWLEDGMENTS
Special thanks to following for their research support: The National Key Research and Development Program of China (2017YFD0600202); National Natural Science Foundation of China (31860184); Young Talents of Science and Technology in Universities of Inner Mongolia Autonomous Region NJYT-20-A15; Inner Mongolia science and technology major projects (CGZH2018135); and Inner Mongolia grassland talent team, innovative talent team (TC2019071720712).
REFERENCES CITED
Almeida, D. H., Cavalheiro, R. S., Ferro, F. S., Almeida, T. H., Christoforo, A. L., Junior, C. C., and Lahr, F. A. R. (2014). “Modulus of elasticity of Schizolobium amazonicum wood evaluated by transversal vibration technique,” Wood Science and Technology 912-914, 247-250. DOI: 10.4028/www.scientific.net/amr.912-914.247
Amera, M., Kabouchia, B., Rahoutib, M., Famiric, A., Fidahc, A., and Alamia, S. (2005). “Influence of moisture content on the axial resistance and modulus of elasticity of clonal eucalyptus wood,” in: The Scientific Committee of the International Conference on Materials and Environmental Science, Amsterdam, Netherlands, pp. 562-568.
Adey-Johnson, R., Mclean, J. P., Bulcke, J. V. D., Acker, J. V., and McDonald, P. J. (2020). “Micro-CT measurements of within-ring variability in longitudinal hydraulic pathways in Norway spruce,” International Association of Wood Anatomists 41 (1), 12-29. DOI: 10.1163/22941932-00002104
Abdel-Aal, M. A., Nasser, R. A., Khan, P. R., and Al-Mefarrej, H. A. (2015). “Anatomical and physical characterisations of some lignocellulosic residues and their suitability for fibre production,” Journal of environmental biology 36, 543-549.
Bailleres, H., Vitrac, O., and Ramananantoandro, T. (2005). “Assessment of continuous distribution of wood properties from a low number of samples: Application to the variability of modulus of elasticity between trees and within a tree,” Holzforschung 59, 524-530. DOI: 10.1515/HF.2005.0
Babiak, M., Gaff, M., Sikora, A., and Hysek, Š. (2018). “Modulus of elasticity in three- and four-point bending of wood,” Composite Structures 204, 454-465. DOI: 10.1016/j.compstruct.2018.07.113
Barrett, J. D., and Hong, J. (2010). “Moisture content adjustments for dynamic modulus of elasticity of wood members,” Wood Science and Technology 44, 485-495. DOI: 10.1007/s00226-009-0292-z
Cabardo, S. J., Langrish, T. A. G., Dickson, R., and Joe, B. (2006). “Variability in transport properties regarding drying behavior for blackbutt timber in New South Wales,” Drying Technology 24(2), 211-224. DOI: 10.1080/07373930600559167
Cabardo, S. J., Langrish, T. A. G., Dickson, R., and Joe, B. (2007). “Variability in mechanical and drying properties for blackbutt timber in New South Wales,” Journal of the Institute of Wood Science 17(6), 311-326. DOI: 10.1179/wsc.2007.17.6.311
Crous, J. W., Morris, A. R., and Scholes, M. C. (2009). “Effect of phosphorus and potassium fertiliser on stem form, basic wood density and stem nutrient content of Pinus patula at various stem heights,” Australian Forestry 72(2), 99-111. DOI: 10.1080/00049158.2009.10676295
Deng, X., Zhang, L., Lei, P., Xiang, W., and Yan, W. (2014). “Variations of wood basic density with tree age and social classes in the axial direction within Pinus massoniana stems in Southern China,” Annals of Forest Science 71(4), 505-516. DOI: 10.1007/s13595-013-0356-y
Diesel, K. M. F., Costa, F. S. L., Pimenta, A. S., and Lima, K. M. G. (2014). “Near-infrared spectroscopy and wavelength selection for estimating basic density in Mimosa tenuiflora [Willd.] Poiret wood,” Wood Science and Technology 48, 949-959. DOI: 10.1007/s00226-014-0652-1
Derikvand, M., Kotlarewski, N., Lee, M., Hui, J., Chan, A., and Nolan, G. (2019). “Short-term and long-term bending properties of nail-laminated timber constructed of fast-grown plantation eucalypt,” Construction and Building Materials 211, 952-964. DOI: 10.1016/j.conbuildmat.2019.03.305
Derikvand, M., Kotlarewski, N., Lee, M., Hui, J., and Nolan, G. (2018). “Flexural and visual characteristics of fibre-managed plantation Eucalyptus globulus timber,” Wood Material Science & Engineering 15(3), 172-181. DOI: 10.1080/17480272.2018.1542618
GB/T 1933 (2009). “Method for determination of the density of wood,” Standardization Administration of China, Beijing, China.
GB/T 1936.1 (2009). “Method of testing in bending strength of wood,” Standardization Administration of China, Beijing, China.
Guan, C., Liu, J., Zhang, H., Wang, X., and Zhou, L. (2019). “Evaluation of modulus of elasticity and modulus of rupture of full-size wood composite panels supported on two nodal-lines using a vibration technique,” Construction and Building Materials 218, 64-72. DOI:10.1016/j.conbuildmat.2019.05.086
Hauksson, J. B., Bergqvist, G., Bergsten, U., Sjöström, M., and Edlund, U. (2001). “Prediction of basic wood properties for Norway spruce. Interpretation of near infrared spectroscopy data using partial least squares regression,” Wood Science and Technology 35, 475-485. DOI: 10.1007/s00226-001-0123-3
Havimo, M. (2010). “Control of tracheid cross-sectional dimensions in Norway spruce and Scots pine wood raw material,” Scandinavian Journal of Forest Research 25, 462-469. DOI: 10.1080/02827581.2010.509327
Ivkovic, M., and Rozenberg, P. (2004). “A method for describing and modelling of within-ring wood density distribution in clones of three coniferous species,” Annals of Forest Science 61, 759-769. DOI: 10.1051/forest:2004072
Jones, P. D., Schimleck, L. R., Peter, G. F., Daniels, R. F., and Clark, III, A. (2005). “Non-destructive estimation of Pinus taeda L. tracheid morphological characteristics for samples from a wide range of sites in Georgia,” Wood Science and Technology 39, 529-545. DOI: 10.1007/s00226-005-0021-1
Liang, L., Fang, G., Deng, Y., Xiong, Z., and Wu, T. (2019). “Determination of moisture content and basic density of poplar wood chips under various moisture conditions by near-infrared spectroscopy,” Forest Science 65(5), 548-555. DOI: 10.1093/forsci/fxz007
Lima, J. T., Breese, M. C., and Cahalan, C. M. (2000). “Genotype-environment interaction in wood basic density of Eucalyptus clones,” Wood Science and Technology 34, 197-206. DOI: 10.1007/s002260000041
Liu, Y., and Zhao, G. (2012). Wood Science, Vol. 1, 2nd Ed., China Forestry Publishing House, Beijing, China.
Locosselli, G. M., and Ceccantini, G. (2012). “Plasticity of stomatal distribution pattern and stem tracheid dimensions in Podocarpus lambertii: an ecological study,” Annals of Botany 110, 1057-1066. DOI: 10.1093/aob/mcs179
Moshtaghin, A. F., Franke, S., Keller, T., and Vassilopoulos, A. P. (2016). “Experimental characterization of longitudinal mechanical properties of clear timber: Random spatial variability and size effects,” Construction and Building Materials 120, 432-441. DOI: 10.1016/j.conbuildmat.2016.05.109
Olaoye, K., and Okon-Akan, O. A. (2020). “Estimation of modulus of elasticity of Boscia angustifolia wood using longitudinal vibration acoustic method,” International Wood Products Journal 11(3), 122-128. DOI: 10.1080/20426445.2020.1738118
Ona, T., Sonoda, T., Shibata, K. I. M., Kato, T., and Ootake, Y. (1998). “Determination of wood basic density by Fourier transform raman spectroscopy,” Journal of Wood Chemistry and Technology 18(3), 367-379. DOI: 10.1080/02773819809349586
Pangh, H., Hosseinabadi, H. Z., Kotlarewski, N., Moradpour, P., Lee, M., and Nolan, G. (2019). “Flexural performance of cross-laminated timber constructed from fibre-managed plantation eucalyptus,” Construction and Building Materials 208, 535-542. DOI: 10.1016/j.conbuildmat.2019.03.010
Pommier, R., Breysse, D., and Garbay, G. (2014). “Modelling the distribution of the variability of Maritime Pine for wooden sawn timber and finger jointing,” European Journal of Environmental and Civil Engineering 18(6), 669-682. DOI: 10.1080/19648189.2014.908652
Passialis, C. N. (1998). “A comparison of two methods for determining the basic density of small irregular samples of old waterlogged wood,” European Journal of Wood and Wood Products 56(1), 91-92. DOI: 10.1007/s001070050273
Pashin, A. J., and Zeeuw, C. (1980). Textbook of Wood Technology, Vol. 1, 3rd Ed., McGraw Hill, New York, USA.
Raymond, C. A., and Muneri, A. (2001). “Nondestructive sampling of Eucalyptus globulus and E. nitens for wood properties. Ⅰ. Basic density,” Wood Science and Technology 35, 27-39. DOI: 10.1007/s002260000078
Soriano-Luna, M. Á., Ángeles-Pérez, G., Guevara, M., Birdsey, R., Pan, Y., Vaquera-Huerta, H., Valdez-Lazalde, J. R., Johnson, K. D., and Vargas, R. (2018). “Determinants of above-ground biomass and its spatial variability in a temperate forest managed for timber production,” Forests 9(8), Article Number 490. DOI: 10.3390/f9080490
Schimleck, L. R., and Evans, R. (2004). “Estimation of Pinus radiata D. Don tracheid morphological characteristics by near infrared spectroscopy,” Holzforschung 58, 66–73. DOI: 10.1515/HF.2004.009
Schimleck, L. R., Jones, P. D., Peter, G. F., Daniels, R. F., and Clark, III, A. (2004). “Nondestructive estimation of tracheid length from sections of radial wood strips by near infrared spectroscopy,” Holzforschung 58, 375–381. DOI: 10.1515/HF.2004.057
Schimleck, L. R., Mora, C., and Daniels, R. F. (2006). “Characterization of the cellulosic cell wall,” in: Rapid Estimation of Tracheid Morphological Characteristics of Green and Dry Wood by Near Infrared Spectroscopy, Douglas D., Leslie H. (ed.), Wiley-Blackwell, Hoboken, NJ, USA, pp. 95-109.
Schimleck, L., Antony, F., Dahlen, J., and Moore, J., (2018). “Wood and fiber quality of plantation-grown conifers: A summary of research with an emphasis on loblolly and radiata pine,” Forests 9, 298. DOI: 10.3390/f9060298
Searle, S. D., and Owen, J. V. (2005). “Variation in basic wood density and percentage heartwood in temperate Australian Acacia species,” Australian Forestry 68(2), 126-136. DOI: 10.1080/00049158.2005.10674956
Sseremba, O. E., Mugabi, P., Banana, A. Y., Wessels, B. C., and Plessis, M. (2020). “Variation of basic density, calorific value and volumetric shrinkage within tree height and tree age of Ugandan grown Eucalyptus grandis wood,” Journal of Forestry Research 32, 503-512. DOI: 10.1007/s11676-020-01141-7
Townshend, E., Pokharel, B., Groot, A., Pitt, D., and Dech, J. P. (2015). “Modeling wood fibre length in black spruce (Picea mariana (Mill.) BSP) based on ecological land classification,” Forests 6, 3369-3394. DOI: 10.3390/f6103369
Vestøl, G. I., Høibø, O., Langsethagen, K. G., Skaug, E., and Skyrud, R. E. A. (2012). “Variability of density and bending properties of Picea abies structural timber,” Wood Material Science & Engineering 7(2), 76-86. DOI: 10.1080/17480272.2012.662698
Vikberg, T., and Elustondo, D. (2015). “Basic density determination for Swedish softwoods and its influence on average moisture content of wood packages estimated by measuring their mass,” Wood Material Science & Engineering 11(4), 248-253. DOI: 10.1080/17480272.2015.1090481
Vaganov, E. A., Schulze, E., Skomarkova, M. V., Knohl, A., Brand, W. A., and Roscher, C. (2009). “Intra-annual variability of anatomical structure and δ13C values within tree rings of spruce and pine in alpine, temperate and boreal Europe,” Oecologia 161, 729-745. DOI: 10.1007/s00442-009-1421-y
Wang, S., Lin, C., and Chiu, C. (2003). “The adjusted dynamic modulus of elasticity above the fiber saturation point in Taiwania plantation wood by ultrasonic-wave measurement,” Holzforschung 57, 547-552. DOI: 10.1515/HF.2003.081
Watt, M. S., D’Ath, R., Leckie, A. C., Clinton, P. W., Coker, G., Davis, M. R., Simcock, R., Parfitt, R. L., Dando, J., and Mason, E. G. (2008). “Modelling the influence of stand structural, edaphic and climatic influences on juvenile Pinus radiata fibre length,” Forest Ecology and Management 254, 166-177. DOI: 10.1016/j.foreco.2007.07.036
Watt, M. S., and Trincado, G. (2019). “Modelling the influence of environment on basic density of the juvenile wood for Pinus radiata grown in Chile,” Forest Ecology and Management 448, 112-118. DOI: 10.1016/j.foreco.2019.06.001
Wu, Z., Zhou, C., Zhou, X., Hu, X., and Gan, J. (2018). “Variability after 15 years of vegetation recovery in natural secondary forest with timber harvesting at different intensities in southeastern China: Community diversity and stability,” Forests 9(1), article no. 40. DOI: 10.3390/f9010040
Yu, H., Liu, Y., Han, G., and Cui, Y. (2009). “Comparison of image analysis and conventional methods for cellular tissue proportion measurement of wood,” in: Proceedings of the 2009 IEEE: International Conference on Information and Automation, Zhuhai/Macau, China.
Yarnan, B. (2007). “Comparative wood anatomy of Pinus sylvestris and its var. compacta in the West Black Sea Region of Turkey,” International Association of Wood Anatomists 28(1), 75-82. DOI: 10.1163/22941932-90001620
Zhang, P., Wu, F., and Kang, X. (2011). “Differences in fiber properties and basic wood density in triploid hybrids of Populus tomentosa,” Advanced Materials Research 236-238, 1442-1452. DOI: 10.4028/www.scientific.net/AMR.236-238.1442
Zhu, J.Y., Scott, C. T., Scallon, K. L.; and Myers, G. C. (2006). “Using ring width correlations to study the effects of plantation density on wood density and anatomical properties of red pine (Pinus resinosa Ait.),” in: 3rd International Symposium on Emerging Technologies of Pulping and Papermaking, Guangzhou, China, pp. 63-71.
Article submitted: January 23, 2021; Peer review completed: March 14, 2021; Revised version received and accepted: March 21, 2021; Published: March 25, 2021.
DOI: 10.15376/biores.16.2.3494-3519