
Abstract
Displacement meter synthesis (DMS), as a traditional method, is widely used to capture the local deformation of a specimen. However, for axis-symmetrical circular columns, the axial compression instability cannot be accurately evaluated using the DMS method due to the uncertain bending direction. To address this problem, a 360° full-surface digital image correlation (DIC) system composed of eight cameras is proposed to capture the full-field deformation information of the column surfaces under axial compression. The objective of this study was to experimentally validate the efficiency of the proposed novel measurement in tracking the full-filled compressive deformation of a long wooden column with the circular cross-section. The test results showed that the columns experience instable failure. The multi-camera DIC system can completely reconstruct the three-dimensional shape of the circular column and obtain the whole process deformation state at any position on the surface of the timber column. The DIC method also can capture the uncertain lateral deformation direction and obtain the data of lateral deflection at the mid-span of timber columns. The multi-camera DIC provides an intuitive and comprehensive new test method for the test and analysis of the stability of axisymmetric long timber columns.
Download PDF
Full Article
Application of Multi-camera Digital Image Correlation in the Stability Study of the Long Timber Column with the Circular Cross-section under Axial Compression
Hongmin Li,a,* Yuntong Dai,b Hongxing Qiu,c and Xiaoyuan He c
Displacement meter synthesis (DMS), as a traditional method, is widely used to capture the local deformation of a specimen. However, for axis-symmetrical circular columns, the axial compression instability cannot be accurately evaluated using the DMS method due to the uncertain bending direction. To address this problem, a 360° full-surface digital image correlation (DIC) system composed of eight cameras is proposed to capture the full-field deformation information of the column surfaces under axial compression. The objective of this study was to experimentally validate the efficiency of the proposed novel measurement in tracking the full-filled compressive deformation of a long wooden column with the circular cross-section. The test results showed that the columns experience instable failure. The multi-camera DIC system can completely reconstruct the three-dimensional shape of the circular column and obtain the whole process deformation state at any position on the surface of the timber column. The DIC method also can capture the uncertain lateral deformation direction and obtain the data of lateral deflection at the mid-span of timber columns. The multi-camera DIC provides an intuitive and comprehensive new test method for the test and analysis of the stability of axisymmetric long timber columns.
DOI: 10.15376/biores.17.1.1717-1728
Keywords: Long timber column; Axial compression; Stability; Multi-camera digital image correlation; Deformation measurement
Contact information: a: Co-Innovation Center of Efficient Processing and Utilization of Forest Resources, College of Materials Science and Engineering, Nanjing Forestry University, Nanjing, 210037, China; b: Department of Engineering Mechanics, College of Civil Engineering, Anhui Jianzhu University, Hefei 230601, China; c: Key Laboratory of Concrete and Prestressed Concrete Structure of China Ministry of Education, Southeast University, Nanjing 210096, China; *Corresponding author: lihongmin@njfu.edu.cn
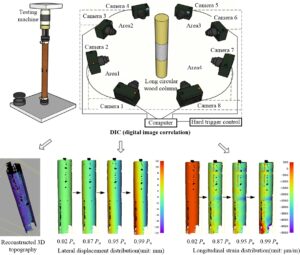
GRAPHICAL ABSTRACT
INTRODUCTION
Timber columns are the most important vertical component in the Chinese ancient timber structures. Many scholars have studied the load-carrying capacity of timber columns before and after reinforcement (Zahn and Rammer 1995; Najm et al. 2007; Song et al. 2015; Guo et al. 2017). However, the stability capacity is the vital factor for the security of the long timber columns in the ancient timber structures (Li et al. 2018) due to the common slenderness ratio of circular timber columns.
Unlike the square timber column, the circular timber column is axis-symmetrical. This increases the uncertainty of the instability direction of the circular timber column. At the same time, due to the limited sticking position of the strain gauge, the maximum strain measurement at the mid-span of the column becomes insufficiently accurate. Additionally, conventional methods in measuring lateral deformation have limitations. Resistance displacement meters or pull-wire displacement meters can only be set in a few specific directions in the test; however, the direction of the lateral deformation is often different from the preset direction. Therefore, a one-way hinge support or two-way hinge support is often used in the current tests measuring the bearing capacity and stability of timber columns (Tang et al. 2008; Dominik 2013; Zhu 2015). The lateral deflection direction of the timber column is artificially set, and then this preset direction is directly measured. This causes certain limitations in the test results.
For the aforementioned reasons, some researchers have begun to introduce the digital image correlation (DIC) measurement method into the structural test measurement. The DIC method (Chen et al. 2013; Pan et al. 2013; Chen et al. 2014) has achieved better test results with its advantages of non-contact, non-destructive, and full-field measurement in experimental mechanics and engineering applications. Yoneyama et al. (2007) used the DIC method to measure bridge deflection in load tests. Bornert et al. (2009) used DIC to study the deformation and failure of clayey rocks under different humidity. Corr et al. (2007) obtained the surface deformation field of the interface between the fiber composite material and concrete using the DIC method. Fedele et al. (2009) used DIC to study the material parameters of the ‘‘GLAss-REinforced’’ (GLARE) laminate interlayer bonding layer. Desai et al. (2012) obtained the stress intensity factor near the crack in the bi-material interface using the displacement field measured by the DIC method. Samadian et al. (2019) used 3D-DIC to measure the full-field 3D profile of the notch surface of the specimen. Sabaté et al. (2006) measured the residual stress of micromechanical structures. Degenhardt et al. (2010) studied the sensitivity of carbon fiber reinforced polymer (CFRP) cylindrical shells. Chen et al. (2015) conducted surface strain measurement on basalt fiber reinforced polymer (BFRP) concrete short columns. Mbarek et al. (2011) studied the tensile behavior of wood-plastic composite (WPC) with or without additive. However, there is a lack of information regarding the application of 3D-DIC in the stability study of the long timber column with the circular cross-section and the challenges such as limited field of view and reduced resolution of the measurement in the long column have not been investigated.
This paper presents an experimental investigation into the stability study of the long circle wood column under axial compression using 3D-DIC. First, 8 cameras arranged in a circumferential direction were used to form a multi-camera digital image correlation system. The hardware trigger device was adopted to realize the synchronous measurement of eight cameras. Then the whole field deformation of the axially symmetrical long timber column was tracked and measured, and the stable performance of the timber column was studied. Finally, the reliability of the test method and data processing method in this paper was verified by the comparison with the data directly measured by conventional means (strain gauges, displacement gauges, etc.).
EXPERIMENTAL PROGRAM
In this work, the multi-camera DIC method was used to measure five circular timber columns. The lateral deflection and strain at the mid-span of timber columns under the axial compression are measured by the two methods of conventional methods and DIC detection.
Column Specimen Configurations and Test Method
The slenderness ratio selected for the specimens was 72, which is a common slenderness ratio in Chinese traditional timber buildings (Li et al. 2018). Five circular timber column specimens (C1-C5) of the same size were fabricated. All timber column specimens had a length of 1800 mm and a nominal diameter of 100 mm. The column specimens were tested under axial compression loading by an MTS testing machine (MTS Company, Eden Prairie, USA) in the Structural Laboratory of Southeast University (Nanjing, China). The columns were supported at both ends by a spherical hinge bearing, which was connected with the loading device, as shown in Fig. 1. The hose clamps were used near the column ends to prevent the end splitting due to the local pressure in the test. Loading was controlled by an electro-hydraulic servo machine (MTS Company, Eden Prairie, America) with a movement speed of 0.3 mm/min. The measuring instrumentation includes a force sensor measuring vertical axial load, displacement transducers measuring longitudinal and lateral deformation, and strain gauges measuring strain. Four longitudinal strain gauges were arranged symmetrically around the middle circumference of the test piece. The geometric alignment of the test piece at the setup stage can be well achieved. The measured strains by the gauges are used to verify the accuracy of the DIC methods. The strain was measured by a static strain collector with a sampling frequency of 25 Hz. The layout of the strain gauges in the middle section of the column is shown in Fig. 2.

Material Properties
Chinese fir (Cunninghamia lanceolata, Xingda Timber Sales Co., Xuancheng, China), one of the most noticeable timber species used widely in Chinese ancient buildings, was used in this study. The moisture content and density of the timber were 10.8% and 380 kg/m3, respectively. A total of 50 compressive tests and 6 bending tests of timber material were performed. The sample specimens were designed according to GB/T 1935 (2009) and GB/T 1936.1 (2009) to test the compressive strength and flexural strength of the sample under the curing environment, respectively (Fig. 3). Strain gauges were used in these tests to measure the compressive elastic modulus along the grain (Chen 2011). The experimentally determined properties of the timber materials are shown in Table 1, in which the value in parenthesis is the corresponding coefficient of variation.

Fig. 3. Test setup and instrumentation: (a) Compressive strength parallel to the grain; (b) Compressive Modulus of Elasticity parallel to the grain; (c) Bending strength
Table 1. Material Properties of Columns Parallel to Wood Grain

DIC Method
The single-camera 2D-DIC cannot meet the measurement needs due to the large surface curvature of the circular timber column. Therefore, the 3D-DIC based on the principle of binocular stereo vision needs to be used to achieve large curvature measurement. However, when the dual-camera 3D-DIC system measures objects with large curvature, it is limited by object occlusion, camera angles, resolution, etc. Moreover, the accuracy of the measurement is limited (Chandramohan and Christensen 2002). To solve this problem, the DIC method and the multi-camera synchronization acquisition system were combined to form a multi-camera digital image correlation measurement method. A 360° continuous multi-camera measurement system was used to ensure the integrity of the measurement area and the clarity of the photos.
In this test, the PointGrey industrial camera GRAS-50S5M-C (Point Grey Research Inc., Richmond, Canada) with a resolution of 2448 pixels × 2048 pixels was selected. The camera has two IEEE-1394b interfaces to ensure data transmission bandwidth while being able to meet the needs of multiple cameras in series (Liu et al. 2014). At first, eight cameras arranged continuously in the circumferential direction were installed on the carbon fiber tube with scale through the adapter. The scale is used to accurately calibrate the connection position of the eight cameras. The position of the camera was adjusted to use multiple cameras to synchronously shoot different local sub-regions of the measured surface. Each local sub-region kept an AOI (area of interest) of 100 × 600 mm2. There was a certain size overlap in the field of view between adjacent sub-regions. Meanwhile, all cameras were calibrated and all the data points of multiple cameras were mapped to the same global coordinate system through software Q-400 DIC from Dantec Dynamics. This was for obtaining the complete three-dimensional shape and deformation information of the measured surface. Then, LED lights were placed between each camera or subsystem according to the on-site lighting conditions. The test schematic diagram and on-site photos are shown in Fig. 4. During the DIC calculation, the subset size was set to 29 × 29 pixels, the subset step was set to 7 pixels and the size of the strain calculation window was set to 15 × 15 points. To verify the accuracy of the DIC test method, the resistance strain gauges were pasted on the surface of the column, and displacement meters perpendicular to each other were arranged in the column to synthesize the lateral deformation in the column (Fig. 2).

Fig. 4. Photo and scheme of DIC measurement: (a) Photo of DIC measurement; (b) Scheme of DIC measurement
To ensure higher test accuracy, the mid-span segment of the 60-cm length of the column with larger deformation during the entire loading process was selected for 360° DIC observation, as shown in Fig. 4. The computer collects test images per 1 s and numbers then automatically. To obtain a suitable digital image for the calculation of deformation data, the following issues must be paid attention during the test: (i) Black and white matte paint must be uniformly sprayed on the test surface at the setup stage to obtain an ideal and easy-to-identify digital image; (ii) Because the timber is absorbent for the matte paint on its surface, the timber surface would be rough after a long time. Therefore, the paint spraying and the start time of the test must be strictly controlled.
RESULTS AND DISCUSSION
The following sections focus on the C4 specimen as an example to introduce the test results and the analysis of the lateral deformation process of the timber column. The DIC calculation results are compared with the test results measured by the displacement transducers and strain gauges.
Failure Modes and the Direction of Lateral Deflection
The failure mode of all the specimens was compression-bending failure and the specimens experienced instable failure. All the column specimens exhibited typical axial compression response in loading at the early stage of loading. When the loading reached about 80% to 90% of the peak load, there was an audible sound from the compressed wood fibers in the mid-span of the timber columns, and the lateral deformation in mid-span became pronounced, showing a marked bending effect. After the peak load, the vertical wood fibers on the concave side showed clear compressed marks, and the upper and lower spherical hinge exhibited apparent rotations in the bending direction. The bending deformation increased rapidly, and eventually the wood fibers of the convex (tension) side fractured. The fracture models were similar among the specimens and has a character of compression-bending failure.
Figure 5 is the top view of the mid-section of the C4 three-dimensional profile reconstructed by DIC. It clearly shows a change of the original position contour and the new position contour of the circular timber column during the test. When the loading was 0.87 times of the peak load Pu, the section of the mid-span in the column happened a small horizontal displacement to the left. The leftward displacement slowly increased until the loading reached 0.95 Pu. When the load reached 0.99 Pu, the direction of the horizontal displacement abruptly changed to the lower left, and the contour comparison showed that the speed of displacement increased at this time. This indicated the specimens experienced instable failure and corresponded to the obvious directional rotation of the upper and lower spherical hinge bearings in the test observation. The contour comparison showed that the speed of displacement growth became faster at this time. This showed that the multi-camera DIC could restore the flexure process of the axisymmetric timber columns with spherical hinge bearings. The changes in the direction of buckling during the loading process are related to factors such as the heterogeneous characteristics of the timber column, boundary conditions, and initial eccentricity. It is difficult for traditional test methods to capture the real buckling direction of the circular timber column under axial loading with the spherical hinge bearing.

Fig. 5. Top view of the mid-section of the C4 three-dimensional profile under different axial loads levels reconstructed by DIC: (a) 0.02 Pu; (b) 0.87 Pu; (c) 0.95 Pu; (d) 0.99 Pu
Lateral Displacement Analysis
Figure 6 shows the lateral horizontal displacement distribution of the C4 under different axial load levels. The viewing angle is perpendicular to the initial lateral horizontal displacement direction of the timber column. The origin of each section coordinate is the original central axis of the timber column. The distribution diagram shows that the concave side of the timber column moved closer to the original axis of the timber column, and the convex side moved away from the original axis when the load reached 0.87 Pu. Each of the approaching displacement and away displacement accounted for half of the side view of the column. When the loading reached 0.99 Pu, the area away from the center of the column exceeded half of the side view of the column due to the change in the direction of buckling of the timber column. The irregular cavities in the picture were caused by the cover of strain gauges, displacement gauges, wire, and the borders appear to be unusually colored due to loud noise.
Figure 7 shows the load versus lateral deflection curves at the mid-span of timber columns calculated by the displacement meter and DIC. The comparison shows that the trends of the two curves were similar. The displacement in the early stage increased slowly with the load. It gradually became faster. When the peak load was reached, the load did not increase, while the displacement increased quickly. Because the lateral deformation of the timber column was small in the early stage, there was an acceptable relative error between the lateral horizontal displacements calculated by the two methods. The relative error gradually decreased near the peak load. Under the same load, the displacement calculated by the displacement meter was less than the DIC calculation result.
Excluding the accuracy of the DIC algorithm, other reasons for the error can be explained as follows. The experimental environment limits the eight cameras to form a stable loop in the test, which has a large noise impact. The wood absorbs water and causes the spots to bloom after spraying speckles on the wood surface. Thus, the surface would be blurred and become rough, which affects the results. The shielding of the strain gauges and displacement transducers and the wires is also one reason for the error. The slender shape of the specimen loses part of the horizontal resolution.

Fig. 6. Lateral displacement distribution of the C4 under different axial loads levels (unit: mm): (a) 0.02 Pu; (b) 0.87 Pu; (c) 0.95 Pu; (d) 0.99 Pu

Fig. 7. Comparison of load versus lateral deflection curves
Strain Analysis
Figure 8 shows the longitudinal strain distribution on the surface of the column under different axial loads levels with the same viewing angle as the displacement analysis. The strain distribution shows that when the load was 0.87 Pu, the cross-section compression was uneven, and the compressive strain on the concave side of the column was significantly larger than that on the convex side, especially the maximum cross-sectional strain in the column, which was close to 4500 μm/m. As the loading increased, the uneven compressive strain became more obvious. It is notable that the middle surface strain of the timber column exhibited only compressive strain before 0.99 Pu, which was consistent with the test results of the strain gauge.
The location of the strain area calculated by DIC was located next to the strain gauge, and the size was consistent with the size of the strain gauge. The longitudinal resistance strain gauge (W1, W2 in Fig. 2) at the mid-span of the column was selected and compared with the calculation result of DIC. The strain versus loading time curve of the two methods is shown in Fig. 9. The DIC calculated the average strain in the region. At the initial loading stage (330 s, 42 kN), the strain obtained by the two methods was the same. Before 500 s (71 kN, the strain was 1105 μm/m), the relative errors of W1 and W2 using two methods were calculated according to Eq. 1 as 2.9% and 4.6%, respectively. This shows that the strain accuracy of DIC calculation for timber components in the early loading stage met the test requirements. The strain error of W1, the later loading stage, increased. This may have been because the surface sprayed speckles became rough with the loading time, resulting in a decrease in the accuracy of the collected data. Reasonable improvement of this method (such as instant testing after spray spot, shortening the loading time, etc.) can be used to determine the strain of the timber column and maintain good accuracy. The results can be expressed as follows,
 (1)
(1)
where, er is the relative error between the DIC calculation result and the resistance strain gauge test result; DIC and gauge represent the DIC calculation strain and the test strain of resistance strain gauge, respectively.

Fig. 8. Longitudinal strain distribution on the surface of the column under different axial loads levels (unit: μm/m): (a) 0.02 Pu; (b) 0.87 Pu; (c) 0.95 Pu; (d) 0.99 Pu

Fig. 9. Comparison of the strain versus loading time curve of the two methods: (a) W1; (b) W2
The above experimental analysis indicates that the columns experienced instable failure. To evaluate the prediction of the axial load capacity of the specimens, the measured bearing capacity (Pu) is listed in Table 2. It is shown that the experimental results were higher than the Euler results by 28.7%, whereas they are lower than compression strength results by 24.8%. The CRG formula generally covers columns of all slenderness ratios and agrees with various test data (Neubauer and Tekinel 1966; Neubauer 1969, 1970; Henson et al. 1972). A corrected formula based on cubic Rankine–Gordon formula (CRG) (Neubauer 1969, 1970; Henson et al. 1972) was adopted to calculate the column
 (1)
(1)
where P is ultimate load, A is the cross-sectional area of the column, C is allowable compressive stress, E is the modulus of elasticity parallel to the grain, L is the effective length of the column, d is the least dimension of the cross-section, and a is a numerical coefficient. Since this formula was proposed for square section columns, the value of a was set at 65 by fitting to the circular columns in this study. The average relative error and the maximum relative error between the predicted results and the test results are 4.2% and 7.8%, respectively. Thus, the accuracy of the CRG formula is acceptable for the prediction of the axial load capacity of circular timber columns.
Table 2. Ultimate Axial Load Capacity of Specimens against CRG Predictions

CONCLUSIONS
Aiming at the uncertainty of flexural direction and large curvature measurement in the stability test of long timber columns, this paper used a 360° full-circumferential deformation digital image correlation (DIC) system to measure the full-field deformation of the long timber column specimens and achieve full-circumference strain measurement. This system can effectively monitor the lateral deformation of the timber column and the damage at any surface position. The test results of displacement transducers and strain gauges verify the reliability of the DIC. The main conclusions obtained are as follows:
- When the load reached 0.99 Pu, the contour comparison showed that the speed of displacement growth became faster abruptly. This indicated the specimens experienced instable failure and the calculated result of DIC is more intuitive than that of the traditional displacement meter synthetic method.
- The continuous and full-field strain data of DIC method indicated the uneven strain distribution of cross-section compression mainly happened at 0.87 Pu and facilitated capturing the buckling section of the circular timber column.
- The measurement methods described in this paper provide a new way for the study of the stability of long circular columns with spherical hinges. The work provides a reference for the study of the stability of timber columns under complex conditions.
- The CRG formula is recommended for the prediction of the axial load capacity of circular timber columns with high accuracy.
ACKNOWLEDGMENTS
This research was funded by the Thirteenth Five-Year National Science and Technology Support Program (2017YFC0703503) of China, National Natural Science Foundation of China No. 51908291, Nanjing Forestry University Youth Science and Technology Innovation Fund No. CX2019002 and Natural Science Foundation of Anhui Province (Grant No. 2008085QA23)
REFERENCES CITED
Bornert, M., Brémand, F., Doumalin, P., Dupré, J.-C., Fazzini, M., Grédiac, M., Hild, F., Mistou, S., Molimard, J., and Orteu, J.-J., et al. (2009). “Assessment of digital image correlation measurement errors: Methodology and results,” Exp. Mech. 49(3), 353-370. DOI: 10.1007/s11340-008-9204-7
Chandramohan, V., and Christensen, K. (2002). “A first look at wired sensor networks for video surveillance systems,” in: Proceedings of 27th Annual IEEE Conference on Local Computer Networks, Tampa, FL, USA, pp. 728-729. DOI: 10.1109/LCN.2002.1181851
Chen, F., Chen, X., Xie, X., Feng, X., and Yang, L. (2013). “Full-field 3D measurement using multi-camera digital image correlation system,” Opt. Lasers Eng. 51(9), 1044-1052. DOI: 10.1016/j.optlaseng.2013.03.001
Chen, X., Yang, L., Xu, N., Xie, X., Sia, B., and Xu, R. (2014). “Cluster approach based multi-camera digital image correlation: Methodology and its application in large area high temperature measurement,” Opt. Laser Technol. 57, 318-326. DOI: 10.1016/j.optlastec.2013.08.005
Chen, Z., Liu, C., Dai, Y., Ding, Li., and He, X. (2015). “Fullcircle monitoring and stability study of BFRP concrete columns,” Eng. Mech. 32 (12), 147-153. (in Chinese)
Chen, Z.Y. (2011). Behaviour of Typical Joints and the Structure of Yingxian Wood Pagoda, Ph. D. Dissertation, Harbin Institutive of Technology, China.
Corr, D., Accardi, M., Graham-Brady, L., and Shah, S. (2007). “Digital image correlation analysis of interfacial debonding properties and fracture behavior in concrete,” Eng. Fract. Mech. 74(1-2), 109-121. DOI: 10.1016/j.engfracmech.2006.01.035
Degenhardt, R., Kling, A., Bethge, A., Orf, J., Karger, L., Zimmermann, R., Rohwer, K., and Calvi, A. (2010). “Investigations on imperfection sensitivity and deduction of improved knock-down factors for unstiffened CFRP cylindrical shells,” Compos. Struct. 92(8), 1939-1946. DOI: 10.1016/j.compstruct.2009.12.014
Desai, C. K., Basu, S., and Parameswaran, V. (2012). “Determination of complex stress intensity factor for a crack in a bimaterial interface using digital image correlation,” Opt. Lasers Eng. 50(10), 1423-1430. DOI: 10.1016/j.optlaseng.2012.05.003
Dominik, H. (2013). Stability Behaviour of Cross Laminated Timber (CLT) Columns under Compressive Axial Load, Master Thesis, University of British Columbia, Canada.
Fedele, R., Raka, B., Hild, F., and Roux, S. (2009). “Identification of adhesive properties in GLARE assemblies using digital image correlation,” J. Mech. Phys. Solids 57(7), 1003-1016. DOI: 10.1016/j.jmps.2009.04.005
GB/T 1935 (2009). “Method of testing in compressive strength parallel to grain of wood,” Standardization Administration of China, Beijing, China.
GB/T 1936.1 (2009). “Method for testing in bending strength of wood,” Standardization Administration of China, Beijing, China.
Guo, Y., Zhou, S., Cui, J., and Huang, Z. (2017). “Effect of knot on stability of glulam column under axial compressive loading,” J. Civil Archi. Environ. Eng. 39(03), 44-49. (in Chinese)
Henson, W. H., Walton, L. R., and Bunn, J. M. (1972). “Full-size stud tests confirm superior strength of square-end wood columns,” Transactions of the ASAE 15(2), 346-349.
Li, H., Qiu, H., Zhao, Z., and Lu, Y. (2018). “Axial compression behaviour of retrofitted long timber columns,” Adv. Struct. Eng. 21(3), 445-459. DOI: 10.1177/1369433217719984
Liu, C., Chen, Z., and He, X. (2014). “Application of 3D-DIC in experimental study on mechanical properties of civil structures,” J. Southeast Univ. (Natural Science Edition) 44(2), 339-344.
Mbarek, T. B., Robert, L., Hugot, F., and Orteu, J. J. (2011). “Mechanical behavior of wood–plastic composites investigated by 3D digital image correlation,” J. Compos. Mater. 45(26), 2751-2764. DOI: 10.1177/0021998311410466
Najm, H., Secaras, J., and Balaguru, P. (2007). “Compression tests of circular timber column confined with carbon fibers using inorganic matrix,” J. Mater. Civil Eng. 19(2), 198-204. DOI: 10.1061/(ASCE)0899-1561(2007)19:2(198)
Neubauer, L. W. (1969). “Proposed CRG generalized column formula for studs and poles,” Transactions of the ASAE 12(5), 624-626.
Neubauer, L. W. (1970). “A comprehensive graphic CRG diagram for wood columns,” Transactions of the ASAE 13(1), 90-92.
Neubauer, L. W., and Tekinel, O. (1966). “A more efficient column formula for the design of wooden posts and studs,” Transactions of the ASAE 9(6), 816–817.
Pan, B., Li, K., and Tong, W. (2013). “Fast, robust and accurate digital image correlation calculation without redundant computations,” Exp. Mech. 53(7), 1277-1289. DOI: 10.1007/s11340-013-9717-6
Sabaté, N., Vogel, D., Gollhardt, A., Keller, J., Michel, B., Cane, C., Gracia, I., and Morante, J. R. (2006). “Measurement of residual stresses in micromachined structures in a microregion,” Appl. Phys. Lett. 88(7), 071910,1-3. DOI: 10.1063/1.2177357
Samadian, K., Hertelé, S., and De Waele, W. (2019). “Measurement of CTOD along a surface crack by means of digital image correlation,” Eng. Fract. Mech. 205, 470-485. DOI: 10.1016/j.engfracmech.2018.11.015
Song, X.B., Wu, Y.J., and Jiang, R. (2015). “Compressive capacity of longitudinally cracked wood columns retrofitted by self-tapping screws,” J. Zhejiang Univ. Sc. A. 16(12), 964-975. DOI: 10.1631/jzus.A1500069
Tang, H., Zhang W., Gu X., and Ou, Y. (2008). “Experimental study on axial compressive behavior of longitudinal cracked wood columns,” in: Proceedings of the 9th National Conference on Building Appraisal and Reinforcement and Reconstruction. Xiamen, Fujian, China. (in Chinese)
Yoneyama, S., Kitagawa, A., Iwata, S., Tani, K., and Kikuta, H. (2007). “Bridge deflection measurement using digital image correlation,” Exp. Tech. 31(1), 34-40. DOI: 10.1111/j.1747-1567.2006.00132.x
Zahn, J. J., and Rammer, D. R. (1995). “Design of glued laminated timber columns,” J. Struct. Eng. 121(12), 1789-1794. DOI:
Zhu, Z. (2015). Experimental Research on Mechanical Properties of Timber Structural Members with Shrinkage Cracks in Historic Buildings, Master Thesis, Southeast University, China.
Article submitted: October 30, 2020; Peer review completed: February 27, 2021; Revised version received and accepted: December 17, 2021; Published: January 24, 2022.
DOI: 10.15376/biores.17.1.1717-1728