
Abstract
The durability of engineered wood products (EWPs) is a parameter yet to be fully investigated and understood. This is specifically important for mass timber structures and cross-laminated timber (CLT) panels. The effect of termites and scale of damage on radiata pine sawn boards have been previously investigated. However, the effects of glue line and the layered structure of CLT exposed to termite feeding in the field in Australia have not been studied. A total of 420 CLT specimens with different exposed faces and layer arrangements were exposed to termite attack in the field. Microcomputer tomography and vibration analysis were used to assess sample conditions before and after 20 weeks exposure. The observed changes showed damage patterns within samples where a glue line and different growth ring patterns were present. The termites created continuous damage along the longitudinal cells through the length and width of the samples. The 3D data showed that the edge gap on the face of panels could potentially act as a pathway for termites entering the core or mid-layers of the panel. The vibration frequency values were lower for samples after the termite exposure. The vibration analysis results showed significant effects of sample direction exposed to termite attack, and percentage of mass loss had significant effects on internal friction and damping values determined.
Download PDF
Full Article
Assessment of Termite Damage in Cross-laminated Timber Sections Using Micro-computed Tomography and Vibration Analysis
Maryam Shirmohammadi,* Adam Faircloth, Chan Keng-Yew Paul, and Chris Fitzgerald
The durability of engineered wood products (EWPs) is a parameter yet to be fully investigated and understood. This is specifically important for mass timber structures and cross-laminated timber (CLT) panels. The effect of termites and scale of damage on radiata pine sawn boards have been previously investigated. However, the effects of glue line and the layered structure of CLT exposed to termite feeding in the field in Australia have not been studied. A total of 420 CLT specimens with different exposed faces and layer arrangements were exposed to termite attack in the field. Microcomputer tomography and vibration analysis were used to assess sample conditions before and after 20 weeks exposure. The observed changes showed damage patterns within samples where a glue line and different growth ring patterns were present. The termites created continuous damage along the longitudinal cells through the length and width of the samples. The 3D data showed that the edge gap on the face of panels could potentially act as a pathway for termites entering the core or mid-layers of the panel. The vibration frequency values were lower for samples after the termite exposure. The vibration analysis results showed significant effects of sample direction exposed to termite attack, and percentage of mass loss had significant effects on internal friction and damping values determined.
DOI: 10.15376/biores.18.3.4430-4449
Keywords: Termite damage; Engineered wood products; Microcomputer tomography; Vibration analysis; Mass loss
Contact information: Department of Agriculture and Fisheries, Forest product innovation, 50 Evans Rd, Salisbury, Brisbane, Australia; *Corresponding author: maryam.shirmohammadi@daf.qld.gov.au
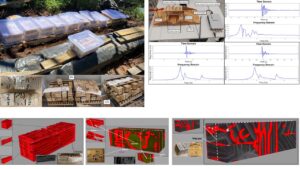
GRAPHICAL ABSTRACT
INTRODUCTION
Timber is one of the most used building materials globally. Its current use is transitioning into mass timber construction methods, with such examples displayed at 25 King St, and the Monterey apartment buildings in Kangaroo Point, Brisbane, Australia (Walsh 2018, 2021). CLT is an innovative EWP consisting of an odd number of sawn timber board layers, stacked and glued perpendicular to the adjacent layer to form structural panels; it will be the focus material of this study. These panels can be bonded by the faces only or both their faces and edge bonded; this study considered CLT with no edge bonding due to local market products. Because of the laminar structure of CLT panel, it is extremely compatible for use in construction. Its dimensions allow for its use in large wall and floor segments as well as large load-bearing structural components (Brandner 2013; Parajuli and Laleicke 2018). The CLT panels are currently manufactured and installed in the building without treatment for potential termite attack (Ayanleye et al. 2022). The panel size, scale, and location in the building further limits the potential monitoring and evaluation methods of their durability after installation and during their service life.
Termites are responsible for most of the wood degradation in the natural environment (Caulfield 2002; Peralta et al. 2003; Ahmed and French 2008; Broadbent 2011). In Australia, it was reported that in 2007 the estimated cost of termite damage in structural timber products was $910 million (Caulfield 2002; Ahmed and French 2008; Broadbent 2011). Termites have caused damage to 20% of homes in Australia, according to reports by Kalleshwaraswamy et al. (2022). In 2010, the estimated loss due to termite damage in the buildings was $32 billion globally. Many timber species are susceptible to termite attack, and the materials used within mass timber products are no exception (Cappellazzi et al. 2020; Ayanleye et al. 2022). Termite and other wood digesting insects use wood as a food source during their life cycle and can cause serious damage to the structure if they are not found and treated in time (Wang et al. 2018). To protect the house from termite damage, a common barrier is to have some method of separating the timber structure from soil. In termite-infested houses, chemical treatment is currently the most common method used to eliminate termites and stop the damage progress (Kalleshwaraswamy et al. 2022).
The physics of termite damage in timber has been previously investigated with the major focus on product mass loss during a period of exposure to termites (Ayanleye et al. 2022). Currently, the visual rating system used to assess termite damage relies on an external examination and does not provide an accurate assessment of any internal damage. Only a few studies have considered internal damage using various imaging methods. Currently published results indicate that the complexity of termite damage in CLT’s composite structure requires more advanced methods of investigation such as 2D and 3D imaging and analysis (França et al. 2018, 2019). Additionally, CLT was originally designed and used in northern Europe, where the risk of termite attack is minimal. With the increasing trend of using CLT in Australia, it is crucial to investigate the extent of termite damage and their potential gallery pattern in the composite structure of CLT and the effects of glue line (for face bonding) and edge gap (Wang et al. 2018).
Micro-computed tomography, Micro-CT (µ-CT), is a non-invasive 3D imaging method using X-rays to scan an object generating multiple 2D slice-by-slice images as small as 100 nm up to 200 mm. The images are then digitally reconstructed into a 3D model to visualise the internal structure of the material. The scan data can be further processed to object volume, cross-sectional area, density, and porosity (Brock et al. 2022). µ-CT has been used to study potential termite activities in wooden art frames and wood-boring beetles in maritime pine boards (Arbat et al. 2021; Parracha et al. 2021). The studies showed µ-CT’s capabilities as a non-invasive method of identifying damage and providing a timeframe for planned maintenance of items (França et al. 2019).
Non-destructive evaluation (NDE) systems using approaches such as vibration and acoustic analysis have been used for assessing the elastic modulus of timber in production lines as well as during research-based activities centered around timber products. The use of these NDE methods in detecting timber degradation, including termite damage, has been investigated on timber bridges (Samali et al. 2014) and decay progression in CLT panels (Zhang et al. 2021). The vibration assessment is considered a cost-effective and rapid method to perform. The NDE methods have also been used in detecting decay and termite attack on Southern pine (Pinus caribaea/ Pinus elliotti) sapwood stakes using a spring-loaded impactor and recording the impulse response signal (De Groot et al. 1998). The study showed the potential differences between damaged and non-damaged sections with echo patterns and number of pulses observed. The data collected from NDE methods was compared with the data collected from the visual assessment of decay in samples. The study showed a reduced number of waves as the damage progressed in the samples. Future work is recommended to study different types of wood products using the same NDE method to develop the correlation between the visual assessment and the NDE pulse echo analysis. Another study by Huan-Jose et al. (De La Rosa et al. 2008) used piezoelectric probe signals to detect termite damage. The study showed that the system tested could record even low-level emissions that could be used in detecting termite activities.
Little attention has been paid to investigate the effects of the exposed orientation, moisture variation, EWP composite structure, and potential patterns of termite attack on these EWPs and their relationship with mass (França et al. 2019; Stokes et al. 2019; Bagheri et al. 2022). Further research is needed to identify types of termite attack, scale, and pattern of damage on different parts of the composite CLT panels to provide future recommendations for treatment and protection of panels from termite damage. This study used µ-CT to visualise termite damage in CLT samples made from Radiata pine (Pinus radiata). The study focused on the pattern of damage, potential preferred directions of attack, and volume loss versus mass loss. The study also investigated the use of NDE methods as a possible solution to termite damage progression. The work presented here shows the capabilities that imaging and visualisation technologies, such as µ-CT, can provide in investigating timber decay and degradation in the future as well as the efficacy of a vibration based NDE technique.
EXPERIMENTAL
Materials
All specimens were extracted from CLT samples made from three layers of radiata pine (Pinus radiata) with polyurethane adhesives. The CLT boards were cut into small blocks with a nominal cross-section of 40 × 40 mm2 and a nominal length of 125 mm. As shown in Fig. 1, samples were prepared from the face (including Face 1P and Face 2P- with an edge gap), edge and end orientations (with 1P, 2P-with a glue line, and 3P with a glue line and an edge gap). Edge gaps and glue lines (as shown in Figs. 1 and 2) were monitored throughout the experiment and assessment for their role in termite damage initiation and progress.
The blocks were cut from different sections of the CLT board, resulting in 7 different configurations each with a different degree of edge, end, and face exposure (Fig. 1 (a) and (b)). A total of 420 samples were split into 20 boxes, with each box containing all 7 configurations of 3 samples per configuration (21 samples per box). An additional 24 samples were cut as control samples from each configuration. This was done purely for easy identification to be µ-CT scanned after the field trial. The control samples were then split randomly into 12 boxes after scanning to then be placed in moisture conditioning chambers. To examine the effects of initial moisture content (MC) on termite damage, the first 10 boxes were placed in an 8% moisture conditioning chamber (23 °C and 55% RH) and the remaining 10 conditioned in a 12% moisture conditioning chamber (22 °C and 60% RH). Once the samples were conditioned to the desired MC, the individual dimensions and weight were recorded.

Fig. 1. (a) Section with no edge gap or glue line (1P- one piece), (b) section with glue line (in end or edge directions) or edge gap (in face direction) (2P- 2 piece) and section with glue line and edge gap (3P- 3 piece)

Fig. 2. Sample types used for the termite exposure trial with details of edge gap and glue lines, (a) edge and end directions (E- Edge and Ed- End) and (b) face direction
Field Sample Preparation
Samples were exposed to termites in Esk, Queensland, Australia during February to May 2021. The recorded weather conditions from the closest weather station to the site are presented in the Appendix. Prior to field installation, the samples were packed and taped together with cardboard in between each other to form a block (Fig. 3 (b)). Taping the samples together into a compact block allows the cardboard to act as a runway to facilitate the movement of the termites throughout the box. Following the Australian Wood Preservation Committee (AWPC) protocols (Greaves 2015) the blocks were laid on bricks in a trench, the area wetted and then the boxes were placed on individual blocks (Fig. 3). The entire trench was then covered with a layer of shade cloth and then black plastic to provide a dark, humid environment conducive to termite activity (Fig. 3). The samples were left out in the field and two boxes (one of each MC level) were recovered in batches over a period of 20 weeks on a fortnightly basis.


Fig. 3. (A) Trench used for exposing samples to termite foraging, (B) sample boxes placed in the trench for the period of exposure to termite foraging, (C) samples packed in cardboard sections and placed in boxes to be exposed to termite attack, and (D) harvested sample box after termite exposure
The harvested samples (Fig. 2) were then placed in the freezer to halt termite activity. The termite debris and residue were then cleaned off the samples, collected in bags, and samples were placed in the respective conditioning chambers (Fig. 3). The samples were then measured and weighed after re-conditioning.

Fig. 4. Harvested and cleaned samples placed in the conditioning chamber at 12% and 8% MC before any further measurement and analysis

Fig. 5. Vibration test setup including the sample holder and impactor used


Fig. 6. Time (a) and frequency (b) response of the data process in MATLAB
Assessment
The samples were then placed on a cradle (Fig. 5) developed to produce a freely supported setup (weightless) and tap tested and measured with an accelerometer (Piezoelectric single axis) to obtain the impulse response to impact and the consequential frequency responses (Fig. 6).
The importance of the supports or boundary conditions (BCs) has been stressed by many when the material properties are of interest (Shirmohammadi et al. 2021). After obtaining all the frequency data using a data acquisition tool (DAQ, sound & vibration module; National Instruments Corporation, Austin, TX, USA), the signal processing was conducted in both LabVIEW (ver. 2018, National Instruments Corporation, Austin, TX, USA) and MATLAB (R2020a MathWorks, Santa Clara, CA, USA) to reconstruct the frequency response.
From the response noted in Fig. 6, the frequency spectrum of each tested sample was evaluated for the number of amplitudes of the natural frequencies as well as the bandwidth of said frequencies to enable the determination of the quality factor (Eq. 1). Using a similar approach as presented by (Shirmohammadi et al. 2020, 2021).
The quality factor (Q factor) is determined as the ratio of peak frequency over the bandwidth of the half power point both sides of the peak (Shirmohammadi et al. 2020, 2021; Hansen 2006; Brémaud et al. 2012; Sproßmann et al. 2017). From vibration data collected, the quality factor was determined using (Ono et al. 1983; Brancheriau et al. 2006; Aramaki et al. 2007; Sproßmann et al. 2017),
 (1)
(1)
where  are quality factor, frequency, temporal damping, internal friction, and amplitude respectively.
Mass Loss Assessment
A selection of samples were exposed to tomographic scanning to quantify the mass loss amount and movement of the termites through the various specimen orientations using a Molecubes x-Cube scanner (LabLogic, Sheffield, UK). The specimens were individually bagged, and any loose plastic was wrapped around the sample and taped in place to keep the sample intact during storage and moving. Once scanning was completed sample tomography was reconstructed and 3D modelled using various SkyScan programs (1272 CMOS edition; (Bruker, Billerica, MA, USA). The 3D reconstruction allows the visualisation of different aspects of the sample, such as early (EW) and latewood (LW), edge gaps, glue line, and termite damage.
Statistical Analysis
The data collected were statistically analysed using analysis of variance (ANOVA) (p = 0.01) to investigate the effects of different variables on moisture properties of samples tested. The differences between the means of experimental data were assessed using Tukey’s HSD (p = 0.01). The parameters that had significant effect on output values (mass loss) were reported. The Genstat (64-bit Release 22.1; General Statistics, UK) program was used for statistical analysis.
RESULTS AND DISCUSSION
Figure 7 shows the result of mass loss determined for samples with 8 and 12% initial MC after harvest. The overall summary of samples’ mass loss showed a higher mass loss percentage in samples with 12% initial MC than samples with 8% initial MC.

Fig. 7. Mass loss determined for samples at (a) 8% and (b) 12% MC after harvest. Graphs E, Ed, and F refer to Edge, End, and Face sections, respectively, and 1, 2, and 3 refer to 1-, 2-, and 3-piece sections. Bars show maximum and minimum values; the middle line shows the median and circles how the outliners.
The volume loss determined from µ-CT imaging before and after the termite trial showed a similar pattern to mass loss determined by weighing the sample. The comparison between samples’ exposed faces during the termite field trial (including face, end, and edge as shown in Fig. 8 (b)) showed higher mass loss values for samples with end grain exposed to the field conditions. Overall, face samples had a lower percentage of damage than the end and edge directions, showing the role of exposed end grain in termite damage.

Fig. 8. Mass loss (ML) values determined from experiment and volume loss determined from 3D imaging scans where (a) shows the total distribution of mass and volume losses for samples tested, and (b) shows the breakdown of loss %across the three faces of samples that were exposed to termite damage
The statistical analysis showed that the exposed sample direction (end, edge, face) had a significant effect on both mass (at p < 0.001) and volume loss (at p = 0.009) where the edge samples presented the largest percentages of both mass and volume loss.
Table 1. Mean Square Showing Effects of Sample Direction (Face, Edge, and End) on Mass and Volume Loss at p < 0.01 Levels

Termite Burrowing Pattern
The 3D images taken showed that there were patterns of preference from the end grain section of sample blocks rather than the face sections (Figs. 9 to 11). This observation correlates well with the mass and volume loss data for each exposed direction (Fig. 9). The burrowing pattern observed when looking at the cross-section width- and length-wise showed that there was more obvious termite damage in the longitudinal cells (boards parallel to the lengthwise orientation).

Fig. 9. Images of samples with glue line after exposure to termite trial
The cell wall thickness, growth rings, and chemical composition of the timber affect the termite borrowing pattern where damaged channels along the grain direction of the samples have been observed (Himmi et al. 2016; Fauziyyah et al. 2019). The selectivity and continuous search for food sources within less dense and more desirable food types, including within growth rings, has been reported for subterranean and dry wood termites (Lee and Su 2009; Himmi, Yoshimura et al. 2016). A higher damage rate was also observed in EW sections than in the LW sections, as shown in Fig. 13. To study the effects of cell wall thickness, future scanning with higher resolution on sections with earlywood and latewood is recommended. Around the glue lines in multiple samples, the damage was observed on both sides of the line (Figs. 10, 12, and 13). The glue line seemed to act as a barrier to termite damage. Further investigation is recommended to investigate the effects of species, glue line type, and thickness on delaying damage (Himmi et al. 2016; Bagheri et al. 2022). Some samples showed signs of the termites burrowing out of the glue lines, where the adhesive layer was followed in parallel direction as they burrow but then show signs of stopping a few microns after burrowing into the glue line (Fig. 9).

Fig. 10. Comparison of damage patterns in samples with edge and no edge gaps
The potential effects of glue line on preventing or reducing termite damage have been discussed previously in a study on CLT made from Douglas fir (Bagheri et al. 2022), indicating that termite damage was minimal or none around the glue line. The observed damage patterns near the two types of glued sections using emulsion polymer isocyanate (EPI) and polyurethane (PUR) showed termites avoiding the adhesive line (Bagheri et al. 2022).
Figure 10 shows samples of face sections with and without edge gaps. The edge gap created a pathway for termites to enter the sample block and develop damage patterns on both sides of the sample face, while the sample without an edge gap showed damage mainly on the exposed face to termites. Figure 11 shows damage following the growth rings with a higher tendency of damage created in earlywood bands. The damage on the side of the sample stops near the glue line, and more damage was observed on the other side of the glue line. From this observation, the glue line is acting as a barrier to further termite penetration with damaged pathways not going through it. This could be due to the adhesive type and the resistance it provides against termite (Bagheri et al. 2022)

Fig. 11. Sample damage in the growth ring and damage patterns around the glue line
Figure 12 shows a sample with a resin knot; there were damaged sections around the resin knot without any damage going into the knot. The samples also exhibited damage near the glue line but not through the glue line, as presented in Fig. 10. A similar observation was reported by Himmi et al. (2016) where dry wood termites avoided the sections with knot in timber logs in their borrowing patterns.
Figure 13 represents the 3D images from reconstructed µ-CT scans with damage shown in different parts of the sample, including the longitudinal direction, as well as areas containing a higher proportion of EW to LW. Figures 13 (A) and (B) show the damage pattern continuing in the longitudinal cell direction. The damage continued through the cells along the entire length (Fig. 13 (A)) and width (Fig. 13(B)). Study of termite (Coptotermes curvignathus) attack patterns and penetration depth in untreated light Red Meranti (Shorea spp.) by Fauziyyah et al. (Fauziyyah et al. 2019) reported that observed termite galleries were similar to long flat tunnels that followed the grain direction of the wood.

Fig. 12. Images of sample with resin knot and evidence of damage around the knot and the damages around the glue line

Fig. 13. 3D images of damaged sections with end grain exposed to termite (A) sample with end grain along the length and (B) sample with end grain along its width
Additionally, when the sample’s exposed face had a portion of end grain (Fig. 13 (B)), there were more obvious damage patterns. The patterns showed that once the termites accessed the end grain face, the damage occurred through the entire width as a continuous channel, similar to what was observed by Fauziyyah et al. (2019) in samples with the end grain face exposed. The study showed the effects of cell wall thickness and the anatomical structure of samples in relation to termite gallery development (Fauziyyah et al. 2019).
Vibration Analysis
Figure 15 summarises the density variation in the samples after exposure to termite damage and the mass loss percentage determined for the samples. The results show a reduction in density and an increase in mass loss values. A similar trend was observed when vibration analysis was used to study the decayed CLT samples as the decay progressed and the percentage of damage increased. The variation in density was defined as a factor that the vibration NDE system can detect as the strength loss in the samples (Zhang et al. 2021).

Fig. 14. Density of samples before and after termite trial, and the percentage of mass loss in samples due to termite damage
Figure 16 summarizes the natural frequency peak values for samples tested before and after exposure to termite damage. As the termite damage progressed in the sample blocks, the frequency values were reduced compared to those determined on undamaged samples. The frequency values of all five peaks decreased after samples were exposed to termite damage. The decreased values can be used as the detection indicator for termite damage in the structure. A similar study on non-destructive assessment of decayed CLT sections using vibration analysis by Zhang et al. (2021) showed that the frequency values decrease as the damage progresses in the samples.

Fig. 15. Overall frequency peak values for samples tested before and after termite damage
The internal friction and quality factor values versus mass loss percentage are presented in Fig. 17. Sample orientations (edge, end, and face) exposed to termite damage had a significant difference effect (Table 2) on quality factor and internal friction values 0.01 level (p = 0.031).
Table 2. Statistical Analysis of Sample Direction Effects on Internal Friction and Quality Factors Determined from Vibration Testing, Showing Significant Effects at p < 0.01


Fig. 16. Quality factor values versus the mass loss percentage at different levels of 0 to 5%, 5 to 10%, and 10 to 46% mass loss
The relationship between mass loss percentage (0 to 5, 5 to 10, and 10 to 46%) and vibration values (damping and internal friction) showed significant differences between mean values. The higher percentage of mass loss showed closer relationship with internal friction determined from vibration test results. Similarly, a study of modal analysis on detecting damages in timber beams showed higher damage percentages in both single and multiple damage cases (Choi et al. 2008).
Table 3. Statistical Analysis on Effects of Mass Loss on Damping and Internal Friction Determined Through Vibration Testing

There were significant effects at p < 0.01 levels.
CONCLUSIONS
The results presented in this study focused on determining termite damage patterns in cross-laminated timber (CLT) sections that had been exposed to termites in the field for a period of 20 weeks. The study used physical measurement, µ-CT imaging, and vibration analysis to determine the damage in the samples. The collected data showed that there was a good correlation between the mass loss data from physical measurement and the volume loss data determined by processing µ-CT scans.
- The overall loss percentage was higher at 12% initial MC than 8%.
- The 3D imaging showed potential higher termite damage ratios around the end grain faces exposed to the field conditions. The sections with end grain had continuous damage along the longitudinal cell in the samples’ length and width.
- There was evidence of the glue line acting as a barrier to the potential termite damage, which needs further investigation.
- When the exposed face contained an edge gap, the termites used this as a pathway to penetrate deeper inside the samples in comparison with faces having no edge gap.
- In a sample with a resin knot, patterns of termite avoidance were noted around the knot and damages only followed around the shape of the resin knot.
- There were potential preference differences in patterns of damaging early wood (EW) than late wood (LW), which needs to be further investigated.
- The comparison between vibration frequency values before and after termite damage showed that the frequency values were reduced as the damage occurred in the sample. The data on vibration analysis showed the potential capacity of non-destructive evaluation (NDE) methods in detecting termite damage in cross-laminated timber (CLT) sections, which needs to be further developed in the future.
ACKNOWLEDGMENTS
The authors are grateful for the support of the Queensland Department of Agriculture and Fisheries (QDAF) for funding this study through Agri-Science Queensland. The Authors would like to thank the technical team at the Forest Product Innovation team, in QDAF for their assistance during sample preparation and sample assessment after termite trial exposure.
REFERENCES CITED
Ahmed, B. M., and French, J. R. J. (2008). “An overview of termite control methods in Australia and their link to aspects of termite biology and ecology,” Pakistan Entomologist 30(2), 101-118.
Arbat, S., Forschler, B. T., Mondi, A. M., and Sharma, A. (2021). “The case history of an insect infestation revealed using X-ray computed tomography and implications for museum collections management decisions,” Heritage 4(3), 1016-1025. DOI: 10.3390/heritage4030056
Ayanleye, S., Udele, K., Nasir, V., Zhang, X., and Militz, H. (2022). “Durability and protection of mass timber structures: A review,” Journal of Building Engineering 46, article ID 103731. DOI: 10.1016/j.jobe.2021.103731
Bagheri, S., Alinejad, M., Ohno, K., Hasburgh, L., Arango, R., and Nejad, M. (2022). “Improving durability of cross laminated timber (CLT) with borate treatment,” Journal of Wood Science 68(1), article 34. DOI: 10.1186/s10086-022-02041-6
Brandner, R. (2013). “Production and technology of cross laminated timber (CLT): A state-of-the-art report,” in: Focus Solid Timber Solutions-European Conference, Graz, Austria.
Broadbent, S. (2011). “A stand-alone termite management technology in Australia,” in: Urban Pest Management: An Environmental Perspective, P. Dhang (ed.), CABI International, Cambridge, MA, USA, pp. 145-155.
Brock, F., Southwell, R., Hazell, Z., Wessling, R., Green, M., and Davis, D. (2022). “Using high-resolution digital photography and micro-CT scanning to investigate deathwatch beetle damage to an historic timber from HMS victory,” Environmental Archaeology 2022, 1-17. DOI: 10.1080/14614103.2021.2024689
Cappellazzi, J., Konkler, M. J., Sinha, A., and Morrell, J. J. (2020). “Potential for decay in mass timber elements: A review of the risks and identifying possible solutions,” Wood Material Science & Engineering 15(6), 351-360. DOI: 10.1080/17480272.2020.1720804
Caulfield, R. (2002). “Termite problem from an architectural perspective,” in: Smarter Design and Construction of Buildings, Proceedings of the National Termite Workshop, Melbourne, Australia.
Choi, F., Li, J., Samali, B., and Crews, K. (2008). “Application of the modified damage index method to timber beams,” Engineering Structures 30(4), 1124-1145. DOI: 10.1016/j.engstruct.2007.07.014
De Groot, R. C., Ross, R., and Nelson, W. (1998). “Non-destructive assessment of wood decay and termite attack in southern pine sapwood,” Wood Protection 3(2), 25-34.
De La Rosa, J.-J. G., Gallego, A., Piotrkowski, R., Castro, E., and Moreno-Muñoz, A. (2008). “Termites detection via spectral kurtosis and wavelet de-noising of acoustic emission signals,” Journal of Acoustics Emission 26, 142-151.
Fauziyyah, S., Karlinasari, L., and Nandika, D. (2019). “Penetration depth evaluation approach for termite-infested Shorea spp. lumber,” BioResources 14(3), 7080-7094. DOI: 10.15376/biores.14.3.7080-7094
França, T. S., Stokes, C. E., and Tang, J. D. (2018). “Evaluation of cross-laminated timber resistance to termite attack,” in: Proceedings of the American Wood Protection Association Annual Meeting, USDA Forest Products Laboratory, Madison, WI, USA, pp. 266-271.
França, T. S., Stokes, C. E., Tang, J. D., and Arango, R. A. (2019). “Utility of image software in quantification of termite damage on cross-laminated timber (CLT),” in: Proceedings: 21st International Nondestructive Testing and Evaluation of Wood Symposium, X. Wang, U. H. Sauter, and R. J. Ross (eds.), General Technical Report FPL-GTR-272, UDA Forest Service, Forest Products Laboratory, Madison, WI, USA, pp. 643-649.
Greaves, H. (2015). Protocols for Assessment of Wood Preservatives, Australian Wood Preservation Committee, Brisbane, Australia.
Himmi, S. K., Yoshimura, T., Yanase, Y., Mori, T., Torigoe, T., and Imazu, S. (2016). “Wood anatomical selectivity of drywood termite in the nest-gallery establishment revealed by X-ray tomography,” Wood Science and Technology 50(3), 631-643. DOI: DOI: 10.1007/s00226-016-0800-x
Kalleshwaraswamy, C., Shanbhag, R. R., and Sundararaj, R. (2022). “Wood degradation by termites: Ecology, economics and protection,” in: Science of Wood Degradation and its Protection, R. Sundararaj (ed.), Springer, Singapore, pp. 147-170. DOI: 10.1007/978-981-16-8797-6
Lee, S.-H., and Su, N.-Y. (2009). “The influence of branching tunnels on subterranean termites’ foraging efficiency: Considerations for simulations,” Ecological Informatics 4(3), 152-155. DOI: 10.1016/j.ecoinf.2009.04.003
Parajuli, R., and Laleicke, F. (2018). “Mass timber products: Innovative wood-based building materials,” NC State University Extension, (https://content.ces.ncsu.edu/mass-timber-products-innovative-wood-based-building-materials), Accessed 01 January 2023.
Parracha, J., Pereira, M., Maurício, A., Faria, P., Lima, D. F., Tenório, M., and Nunes, L. (2021). “Assessment of the density loss in anobiid infested pine using X-ray micro-computed tomography,” Buildings 11(4), article 173.
Peralta, R. C. G., Menezes, E. B., Geraldo de Carvalho, A., and Aguiar-Menezes, E. d. L. (2003). “Feeding preference of subterranean termites for forest species associated or not a wood-decaying fungi,” Floresta e Ambiente 10(2), article 6.
Samali, B., Li, J., Dackermann, U., and Choi, F. (2014). “Vibration-based damage detection for timber structures in Australia,” in: Structural Health Monitoring in Australia, School of Civil and Environmental Engineering, Australia, pp. 117-144.
Shirmohammadi, M., A. Faircloth and A. Redman (2021). “Assessment of sound quality: Australian native hardwood species for guitar fretboard production,” European Jour-nal of Wood and Wood Products 79, 487-497. DOI: 10.1007/s00107-020-01631-9
Stokes, T., França, S. F. A., and Tang, J. D. (2019). “Ongoing Termite Studies on Cross Laminated Timber (CLT) Panels,” Forest Service USDA, Madison, WI, USA.
Walsh, N. P. (2018). “The tallest timber tower in Australia opens in Brisbane,” Arch Daidy, Architecture News, (https://www.archdaily.com/906495/the-tallest-timber-tower-in-australia-opens-in-brisbane), Accessed 01 Dec 2022.
Wang, J., Stirling, R., Morris, P. I, Taylor, A., Lloyd, J., Kirker, G., Lebow, S., Mankowski, M., Barnes, H., and Morrell, J. J. (2018). “Durability of mass timber structures: A review of the biological risks,” Wood and Fiber Science 50(Special Issue), 110-127. DOI: 10.22382/wfs-2018-045
Zhang, L., Tiemann, A., Zhang, T., Gauthier, T., Hsu, K., Mahamid, M., Moniruzzaman, P., and Ozevin, D. (2021). “Nondestructive assessment of cross-laminated timber using non-contact transverse vibration and ultrasonic testing,” European Journal of Wood and Wood Products 79, 335-347. DOI: 10.1007/s00107-020-01644-4
Article submitted: February 17, 2023; Peer review completed: April 18, 2023; Revised version received and accepted: Arpil 29, 2023; Published: May 4, 2023.
DOI: 10.15376/biores.18.3.4430-4449
APPENDIX
Table A1. Weather Data for Esk, Queensland, Australia During the Termite Exposure Trial (February to May 2021)
