
Abstract
Yaupon holly is one of the most widespread woody underbrush species in the southeastern United States, and it can undermine forest health and safety due to its biofuel-like nature during catastrophic wildfires. Yaupon holly was subjected to microwave liquefaction to produce biobased polyurethane (PU) foam insulation. Liquefaction parameters were optimized and summarized as follows: 1) particle size was controlled in the range of 16- to 40- mesh; 2) both the ratios of glycerol to ethylene glycol and liquid to solid were set at 3:1; 3) the reaction process was conducted at 160 °C for 10 min and catalyzed by 1.5% sulfuric acid. The optimal liquefaction conversion yield was 94.9%. The Fourier transform infrared spectra (FTIR) indicated the successful liquefaction and dissolution of wood essential components, i.e. hemicellulose, cellulose, and lignin. The optimal liquefaction product with solid residue was used directly to produce biofoams. With an increased isocyanate index, the thermal insulation properties, mechanical properties, and thermal stability of biofoams increased. Therefore, a promising biobased PU foam was obtained at an isocyanate index of 150. The density, thermal conductivity, Young’s modulus, and compressive stress of the promising biofoam were 18.5 kg·m-3, 0.033 W·m-1·K-1, 176.7 kPa, and 15.4 kPa, respectively.
Download PDF
Full Article
Biobased Polyurethane Foam Insulation from Microwave Liquefaction of Woody Underbrush
Xing-Yan Huang,a,b Jin-Qiu Qi,a,* Cornelis F. de Hoop,b,* Jiu-Long Xie,a,b and Yu-Zhu Chen a
Yaupon holly is one of the most widespread woody underbrush species in the southeastern United States, and it can undermine forest health and safety due to its biofuel-like nature during catastrophic wildfires. Yaupon holly was subjected to microwave liquefaction to produce biobased polyurethane (PU) foam insulation. Liquefaction parameters were optimized and summarized as follows: 1) particle size was controlled in the range of 16- to 40- mesh; 2) both the ratios of glycerol to ethylene glycol and liquid to solid were set at 3:1; 3) the reaction process was conducted at 160 °C for 10 min and catalyzed by 1.5% sulfuric acid. The optimal liquefaction conversion yield was 94.9%. The Fourier transform infrared spectra (FTIR) indicated the successful liquefaction and dissolution of wood essential components, i.e. hemicellulose, cellulose, and lignin. The optimal liquefaction product with solid residue was used directly to produce biofoams. With an increased isocyanate index, the thermal insulation properties, mechanical properties, and thermal stability of biofoams increased. Therefore, a promising biobased PU foam was obtained at an isocyanate index of 150. The density, thermal conductivity, Young’s modulus, and compressive stress of the promising biofoam were 18.5 kg·m-3, 0.033 W·m-1·K-1, 176.7 kPa, and 15.4 kPa, respectively.
Keywords: Yaupon holly; Liquefaction; Polyurethane foam; Thermal conductivity
Contact information: a: College of Forestry, Sichuan Agricultural University, Chengdu, Sichuan 611130, PRC; b: School of Renewable Natural Resources, Louisiana State University Agricultural Center, Baton Rouge, Louisiana 70803, USA;
* Corresponding authors: qijinqiu2005@aliyun.com; cdehoop@lsu.edu
INTRODUCTION
Insulation plays a key role in green housing due to its ability to conserve energy associated with heating and cooling, and it is growing in popularity for residential and commercial housing. Polyurethane (PU) foam is one of the most versatile construction insulations because of its low density, low thermal conductivity, and high mechanical performance. Currently, the PU foam industry is still highly dependent on petro-based chemicals due to its two major feedstocks, i.e. polyol and isocyanate. With the growing concern of environmental protection and rapid depletion of fossil fuels, numerous efforts have been focused on the substitution of petro-based polyols with biobased polyols, such as vegetable oil (Zhang and Kessler 2015) and bio-polyol, derived from lignocellulosic biomass (Liang et al. 2006; Xie et al. 2014).
Liquefaction is one of the promising thermochemical conversion routes to convert lignocellulosic biomass into valuable chemicals (Liu et al. 2011; Huang et al. 2017). Through liquefaction, the high molecular weight components of biomass are broken down to low molecular chemical products. One major application of the liquefaction product is to produce the biobased PU foam (Xie et al. 2014). It has been demonstrated that the biofoams from the liquefaction of lignocellulosic biomass are comparable with petro-based ones (Gama et al. 2015). Until recently, a considerable amount of biomass have been liquefied to produce biobased PU foams, such as agricultural wastes, e.g., wheat straw (Chen and Lu 2009), corn bran (Lee et al. 2000), cornstalk (Yan et al. 2008), sugar-cane bagasse (Hakim et al. 2011; Xie et al. 2015b), soybean straw (Hu et al. 2012), and coffee grounds (Gama et al. 2015), as well as woody materials, e.g. waste paper (Lee et al. 2002), bamboo (Xie et al. 2014), lignin (Xue et al. 2015; Mahmood et al. 2016), cork (Gama et al. 2014; Esteves et al. 2017), wood powder (Zhang et al. 2013), and wood bark (Zhao et al. 2012). However, currently there is no research on the production of PU foam from the liquefaction of low-diameter woody underbrush.
Highly abundant woody underbrush could provide ample biofuels for catastrophic wildfires that pose a threat to forest health and safety. Therefore, the removal and utilization of woody underbrush could support the goal of reducing catastrophic wildfires by reducing forest fuel loading levels and improving overall forest health. Moreover, the rapid growth and wide distribution of woody underbrush can continue to supply lignocellulosic biomass. Yaupon holly (Ilex vomitoria) is one of the most widespread woody underbrush species in the southeastern United States (Ferreira et al. 2012) that has great potential for use as a raw material to produce biofoam insulation via liquefaction.
In this work, the microwave liquefaction parameters of Yaupon holly were optimized using a single factor method, and the liquefaction products were analyzed by Fourier transform infrared (FTIR) spectrometry. The optimal liquefaction product with solid residue would be used directly to produce biofoam. The cross-section morphology of the biofoams was imaged by scanning electron microscopy (SEM). The physico-mechanical properties, including density, thermal conductivity, thermal stability, and compressive properties of the resulting biofoams, were evaluated to obtain the most promising PU foam from a series of isocyanate index formulas.
EXPERIMENTAL
Materials
The Yaupon holly collected at the Bob R. Idlewild Research Station near Clinton, Louisiana, USA, was ground into 6- to 8-mesh, 8- to 16-mesh, 16- to 40-mesh, 40- to 60-mesh, and 60- to 80-mesh and oven-dried at 105 °C until it reached a constant weight. The chemical compositions of Yaupon holly are as follows: α-cellulose (45.26%), hemicellulose (28.10%), Klason lignin (23.46%), alcohol-toluene extracts (4.01%), 1% sodium hydroxide (NaOH) solubility (27.53%), hot-water extracts (9.20%), and ash content (0.91%). The holocellulose, α-cellulose, lignin content, hot-water extracts, alcohol-toluene extractives, 1% NaOH solubility, and ash content of the raw material were determined in accordance to ASTM D1104-56 (1971), ASTM D1103-60 (1971), ASTM D1106-96 (1996), ASTM D1110-96 (1996), ASTM D1107-96 (1996), ASTM D1109-84 (2001), and ASTM D1102-84 (2001), respectively. The hemicellulose content was established as reported by Zhang et al. (2012b).
Glycerol, ethylene glycol (EG), methanol, and 98% sulfuric acid (H2SO4) were purchased from VWR International (Radnor, PA, USA). Polymeric methylene diphenyl diisocyanate (pMDI) with 30% to 50% of 4,4’-methylenediphenyl diisocyanate and 50% to 70% of diphenylmethane diisocyanate was kindly supported by Huntsman Polyurethanes (Woodlands, TX, USA). The average functionality, isocyanate (NCO) group content, and viscosity at 25 °C of pMDI (Rubinate M) are 2.7, 31.0%, and 192 cps, respectively. Dow corning 193 (Dow Corning Corporation, Midland, MI, USA) was used as a surfactant and the combination of dimethylcyclohexylamine (Jeff cat DMCHA) (Huntsman Corporation, Woodlands, TX, USA) with dibutyltin dilaurate (Pfaltz & Bauer, Waterbury, CT, USA) was used as a co-catalyst for the preparation of PU foams. Water was used as the eco-friendly blowing agent. All of the chemicals were used without further purification.
Methods
Microwave liquefaction
Liquefaction of Yaupon holly was performed in a Milestone laboratory microwave oven (Shelton, CT, USA) equipped with an ATC-400FO automatic fiber optic temperature control system. Glycerol and EG with the ratio from 1:1 to 5:1 were used as the liquefaction solvent. Pre-weighed Yaupon holly by different liquid to solid ratios in the range of 2:1 to 6:1 and 98% sulfuric acid (percentage of solvent mass varying from 0.5% to 4.5%, wt/wt) were thoroughly premixed before cooking. The reaction temperature was elevated from room temperature to the desired temperature (120 °C to 200 °C) within 5 min, and then maintained for 2.5 min to 10 min. Four replicates were carried out for each liquefaction parameter. The ice bath was applied to quench the reaction when the reaction was done. After cooling, liquefied products were dissolved in 150 mL of methanol under constant stirring for 4 h and filtered through Whatman No. 4 filter paper (GE Healthcare, Chicago, IL, USA) to separate the liquid and solid residue. The liquid portion was evaporated at 65 °C under vacuum to remove methanol. The gaseous products were vented because the yield of gaseous products was negligible. The solid residue that remained on the filter paper was oven-dried and weighted for the calculation of liquefaction conversion yield as Eq. 1,
 (1)
(1)
Acid and hydroxyl number of bio-polyols
The procedure to determine acid number was shown as follows: A mixture of 1 g bio-polyol sample and 20 mL dioxane-water solution (4/1, v/v) was titrated with 0.1 mol/L NaOH to end-point (pH 8.3). The blank titration was conducted using the same procedure. Acid number was calculated as Eq. 2,
![]() (2)
(2)
The procedure to determine hydroxyl number was shown as follows: 1 g of bio-polyol and 10 mL of phthalic anhydride solution (dissolving 150 g phathalic anhydride in 900 mL of dioxane and 100 mL pyridine) were added into a 150 mL beaker. The beaker was sealed and put into a boiling water bath for 20 min. After cooling down, 20 mL of dioxane-water solution (4/1, v/v) and 5 mL of water were added to the beaker and then titrated with 1 mol/L NaOH to pH 8.3. Blank titration was conducted using the same procedure. Hydroxyl number was calculated as Eq. 3,
![]() (3)
(3)
where AN and HN represent acid number and hydroxyl number (mg KOH/g), B and D are the volume of NaOH standard solution consumed in blank titration (mL); C and S are the volume of NaOH standard solution consumed in sample titration (mL); W is the sample weight (g); and N stands for the equivalent concentration of NaOH standard solution (mol/L).
Preparation of PU biofoams
The liquefaction products were used directly to produce PU foam without separating the solid and liquid portions. The PU foams were prepared by a one-step method. A mixture of 3.00 g liquefaction products, 0.30 g co-catalyst (Jeff cat DMCHA:dibutyltin dilaurate = 1:1 ), 0.20 g deionized (DI) water, and 0.20 g surfactant was thoroughly premixed in a plastic beaker with a mechanical stirrer for 1 min, followed by adding an established amount of pMDI (i.e., 5.80 g, 6.63 g, 7.46 g, and 8.29 g) with stirring at 1500 rpm for 3 min. The isocyanate index was set as 105, 120, 135, and 150, and calculated in accordance to previous literature as shown in Eq. 2 (Kapps and Buschkamp 2004; Gama et al. 2015). All the foam samples were allowed to freely rise and cure at ambient condition for 2 days before characterization.
 (4)
(4)
In Eq. 2, miso is the mass of pMDI (g), %NCO is the quantity of NCO groups in pMDI (31.0%), MNCO is the molecular weight of NCO group (0.042 g/mmol), mpolyol is the mass of the polyol (g), MKOH is the molecular weight of potassium hydroxide (KOH) (56.1 mg/mmol), OHnumber and AN are the hydroxyl number and the acid number of polyol, respectively (mg KOH/g), and mH2O is the mass of water used as blowing agent, while EqH2O is the equivalent of OH groups in the water (111 mmol/g).
Characterization of liquefaction products
Fourier transform infrared spectrometry (Madison Instruments, Middleton, WI, USA) was used to study the chemical structure of the liquefaction products. The FTIR analysis was performed on a Nicolet Nexus 670 spectrometer equipped with a Thermo Nicolet Golden Gate MKⅡ Single Reflection ATR accessory. A small quantity of sample was covered flatwise on the detection window. Each sample was analyzed in the range of resolution from 400 cm-1 to 4000 cm-1 with a spectral resolution of 4 cm-1 and a total of 32 scans were collected.
Characterization of biofoams
Scanning electron microscopy (JSM-6610 LV, JEOL, Tokyo, Japan) was used to examine the morphology of the biofoams. Prior to analysis, the samples were gold coated using a EMS 550 X sputter coater (Electron Microscopy Sciences, Hatfield, PA, USA). Images of the cross-section of biofoams were obtained. The average cell diameter was calculated from 50 measurements.
The density of the PU foams was determined by dividing the weight of the specimens (30 × 30 × 30 mm3) by the calculated volume, according to ASTM D1622-08 (2008). Ten replicates were carried out for each group.
The thermal conductivity of biofoams was determined via a KD2 Pro (Decagon Devices, Pullman, WA, USA). A 10 min read time was used to minimize the contact resistance errors. Ten replicates were conducted for each group.
An eXpert 2610 universal mechanical test analyzer (ADMET, Norwood, MA, USA) was used to measure the compressive properties of the foams. Samples (10 × 10 × 10 mm3) were placed between the two parallel plates and compressed at 10 mm/min. The Young’s modulus was calculated by the slope of the tangent of the linear portion in the stress-strain profile in accordance to the method described in previous reports (Gama et al. 2014, 2015). The compressive stress was taken from the stress-strain curve at a deformation of 10%. Ten replicates were measured for each group.
The thermogravimetric and differential thermogravimetric (TG/DTG) analysis of biofoams were conducted with a thermal analyzer Q50 TGA (TA Instruments, New Castle, DE, USA) to simultaneously obtain thermogravimetric data. Each sample (approximately 5 mg) was conducted at 30 °C to 800 °C with a constant heating rate of 20 °C/min under a flow of 40 mL/min of nitrogen atmosphere.
Statistical analysis
Statistical analysis was conducted using SAS (version 9.1, SAS Institute, Cary, NC, USA). An analysis of variance (ANOVA) was performed to determine the significant differences (α = 0.05) among the different levels within the a single factor.
RESULTS AND DISCUSSION
Optimization of Liquefaction Parameters
The liquefaction conversion yield of Yaupon holly with respect to particle size, glycerol to EG ratio, liquid solvent to solid ratio, sulfuric acid (H2SO4) concentration, liquefaction time, and liquefaction temperature are shown in Fig. 1.
From Fig. 1a, all conversion yields of Yaupon holly were higher than 82%, and the maximum value (89.9%) was observed from the category of 16- to 40-mesh. According to the ANOVA, no significant (p > 0.05) difference on the conversion yields was found among the different particle sizes (Fig. 1a). It is understood that smaller particle size can provide a benefit associated with a greater contact area between the biomass and solvent, which increases the conversion yield. However, if the particles are too fine (> 40-mesh in this case), they will tend to aggregate and it is hard to acquire a homogeneous mixing, resulting in a low conversion yield. Similar tendencies were reported from the liquefaction of cork and bamboo shoot shell (Ye et al. 2014; Esteves et al. 2017). Hence, the optimal particle size, in this work, was 16- to 40-mesh.
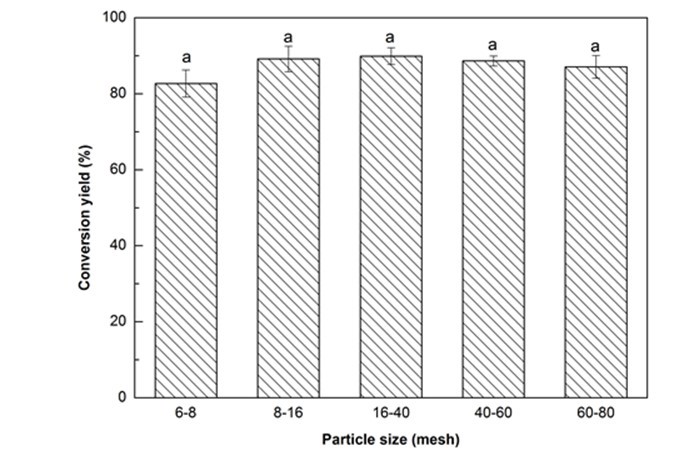
Fig. 1a. Liquefaction conversion yield with respect to particle size (Other conditions: Glycerol:EG = 4:1, liquid:solid = 3:1, H2SO4: 1.5%, reaction time: 10 min, and temperature: 140 °C)
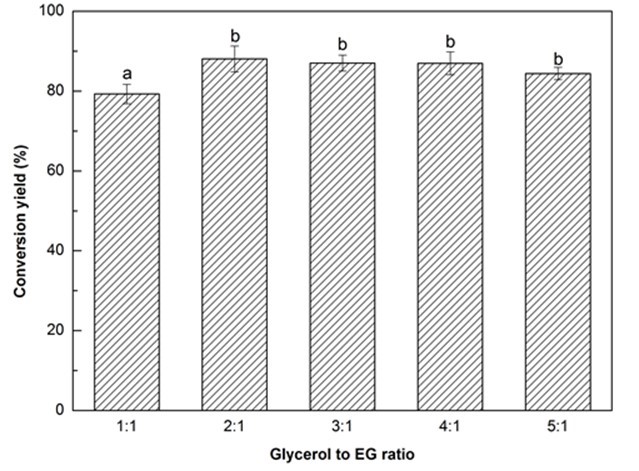
Fig. 1b. Liquefaction conversion yield with respect to glycerol to EG ratio; (other conditions: Particle size: 16- to 40-mesh, liquid:solid = 3:1, H2SO4: 1.5%, reaction time: 10 min, and temperature: 140 °C)
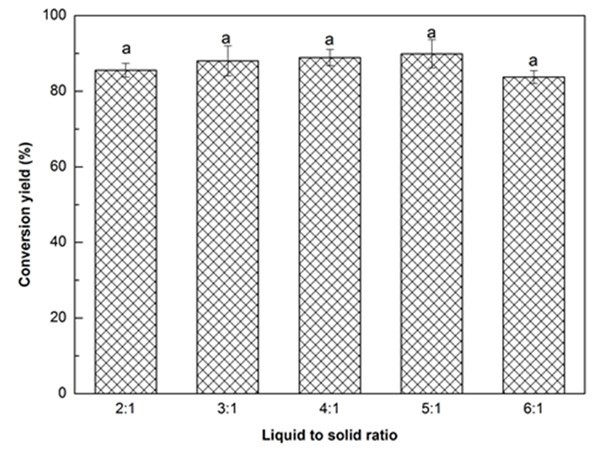
Fig. 1c. Liquefaction conversion yield with respect to liquid to solid ratio; (Other conditions: Particle size: 16- to 40-mesh, glycerol:EG = 3:1, H2SO4: 1.5%, reaction time: 10 min, and temperature: 140 °C)
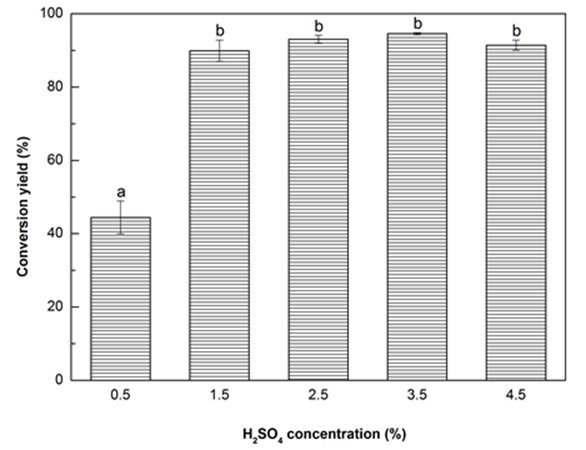
Fig. 1d. Liquefaction conversion yield with respect to H2SO4 concentration; (Other conditions: Particle size: 16- to 40-mesh, Glycerol:EG = 3:1, liquid:solid = 3:1, reaction time: 10 min, and temperature: 140 °C)
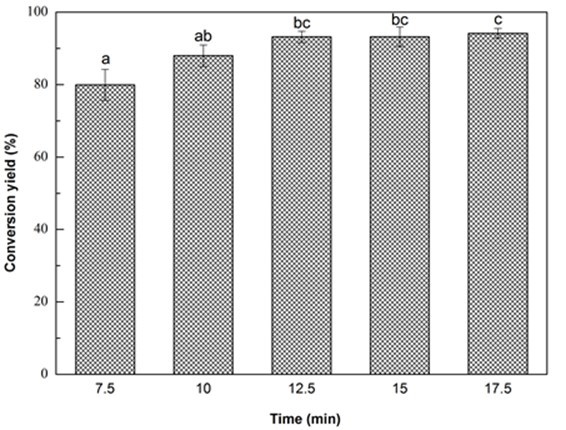
Fig. 1e. Liquefaction conversion yield with respect to reaction time; (Other conditions: Particle size: 16- to 40-mesh, glycerol:EG = 3:1, liquid:solid = 3:1, H2SO4: 1.5%, and reaction temperature: 140 °C)
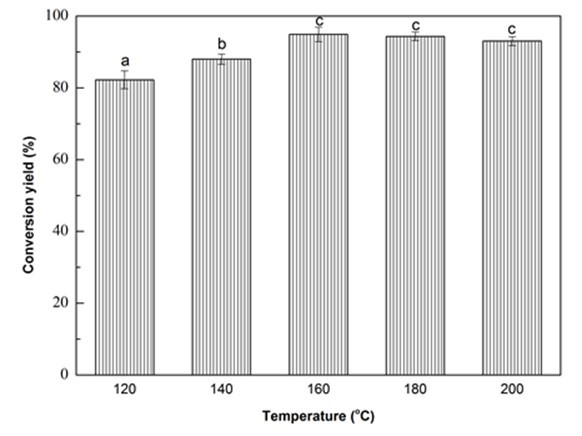
Fig. 1f. Liquefaction conversion yield with respect to reaction temperature; (Other conditions: Particle size: 16- to 40-mesh, glycerol:EG = 3:1, liquid:solid = 3:1, H2SO4: 1.5%, and reaction time: 10 min)
Fig. 1 (a-f). Variation of conversion yield with respect to particle size (a), glycerol to EG ratio (b), liquid to solid ratio (c), H2SO4 concentration (d), reaction time (e), and temperature (f);
Values with same letter in a single figure are not significantly different at p < 0.05
It has been reported that the co-solvents of glycerol and EG can effectively promote the liquefaction of biomass at atmospheric pressure (Gama et al. 2014). With an increasing glycerol to EG ratio from 1:1 to 2:1 the liquefaction conversion yield significantly (p < 0.05) increased from 79.3% to 88.1%, and then slightly declined to 84.4% as the ratio reached 5:1 (Fig. 1b). It has been demonstrated that glycerol is very effective in enhancing the decomposition of biomass (Xie et al. 2015b) because glycerol can reduce the surface tension of the liquefaction solvent and accelerate the diffusion of small molecules from liquefied biomass into the liquefaction solvent (Zhang et al. 2012b). Therefore, to a certain extent, increasing the glycerol loading could obtain a higher conversion yield. In contrast, the reduction of conversion yield with further increase in glycerol loading was probably attributed to the decrease of flowability of liquefaction solvent while adding less EG that has a lower viscosity as compared with glycerol. In that case, lower flowability could not have a great homogenous reactants mixture in the same stirring speed, thereby leading to a lower conversion yield. Even though the maximum conversion yield was observed at the glycerol to EG ratio of 2:1, considering the glycerol will be replaced by crude glycerol (i.e., a byproduct of the production of biodiesel) in the authors’ future work, a little higher glycerol loading (3:1) was deliberately selected as the optimal liquefaction solvent.
Figure 1c illustrates the influence of solvent liquid to biomass solid ratio on the liquefaction conversion yield. The conversion yield exhibited a slight increase as the liquid to solid ratio increased from 2:1 to 5:1, and thereafter decreased minimally when the ratio reached 6:1. This result was in line with the finding reported by Jo et al. (2015). The ANOVA indicated that there was no significant difference in conversion yield with the change of liquid to solid ratio. Insufficient liquefaction solvent could result in an insufficient contact between the biomass and solvent, which could lead to an incomplete liquefaction reaction. Moreover, insufficient solvent could also increase the viscosity of reaction system that will lead to recondensation reactions between the liquefied components, resulting in a lower liquefaction efficiency (Shao et al. 2016). In contrast, the viscosity of the reaction system could be decreased by increasing the liquefaction solvent loading, and the liquefaction reaction would be promoted. However, an excessive liquefaction solvent will increase the solvent-related costs for bio-polyol synthesis. Overall, the liquid to solid ratio of 3:1 with a conversion yield of 88.0% was chosen in this work.
It has been established that the liquefaction of biomass is mainly comprised of decomposition and solvolysis processes (Xu et al. 2012; Huang et al. 2017), and the presence of catalyst is crucial to increase the liquefaction process and reduce the liquefaction temperature and time (Soares et al. 2014). One of the most effective catalysts is sulfuric acid because it provides highly reactive protons (H+ ions) that are able to promote the hydrolytic reactions of glycosidic bonds, resulting in the dissolution of biomass (Xu et al. 2016). As expected, the increase of H2SO4 concentration had a positive effect on the liquefaction content of Yaupon holly (Fig. 1d). The conversion yield significantly (p < 0.05) increased 102.3% as the H2SO4 concentration increased from 0.5% to 1.5%. The maximum conversion yield (94.56%) was obtained at the H2SO4 concentration of 3.5%. Thereafter, a reduction of conversion yield was observed at 4.5% H2SO4. This result was ascribed to the occurrence of recondensation among liquefied fragments with the excessive addition of sulfuric acid, resulting in an increase of insoluble residue (Zhang et al. 2012a; Lee et al. 2016). Because no statistical difference on the conversion yield was found between the H2SO4 concentration of 1.5% and 3.5%, the optimal H2SO4 concentration was considered to be set at 1.5%.
Notably, approximately 88% of Yaupon holly was liquefied at the initial rapid increase state within 10 min. At the slow increase stage from 10 min to 17.5 min, the conversion yield gradually increased to 94.2% (Fig. 1e). The rapid increase of conversion yield within 10 min was ascribed to the decomposition of hemicellulose, lignin, and amorphous zones of cellulose because they are susceptible to liquefaction process (Zhang et al. 2012a,b). The decomposition of the crystalline regions of cellulose made a contribution to the slow increase stage of liquefaction (Jasiukaityte et al. 2009). Microwave liquefaction is a time and energy saving strategy to convert biomass into useful products (Xie et al. 2016; Huang et al. 2017). Microwaves induce heat at the molecular level by direct conversion of electromagnetic energy into heat, resulting in a fast heating rate (Sobhy and Chaouki 2010). Accordingly, 10 min was used as the optimal liquefaction time.
The effect of liquefaction temperature on conversion yield is shown in Fig. 1f. It was obvious that the conversion yield increased significantly (p < 0.05) as the temperature increased from 120 °C to 160 °C. With further increase in the reaction temperature, the conversion yield slightly dropped. In general, the liquefaction of biomass is a dynamic balance between reactions of decomposition of macromolecules and the recondensation of small liquefied fragments (Xie et al. 2015a). Thus, raising the temperature from 120 °C to 160 °C, the amount of activated macromolecules and their internal energy increased (Guo et al. 2012), which caused more and more chemical bonds to be broken. In this situation, the decomposition overweighed recondensation, which resulted in the increase of conversion yield (Zhuang et al. 2012). While, in the severe reaction temperature, the degradation gradually decreased and the recondensation played a dominant role, which attributed to the decrease of conversion yield (Shao et al. 2016). Thus, 160 °C would be the most desirable liquefaction temperature for Yaupon holly within the studied range. Hereafter, three duplicates were run using the optimized liquefaction parameters and the optimal liquefaction conversion yield was 94.90%.
FTIR Spectra of Liquefaction Products
Figure 2 presents the FTIR spectra of the raw material, solid residue, bio-polyol, and liquefied Yaupon holly (bio-polyol with solid residue). It was clear that the macromolecules in wood were broken down after liquefaction, which was evidenced from the observation of methyl and/or methylene (2935 cm-1 and 2874 cm-1) in solid residue (Chen et al. 2014). The intensified -OH characteristic peak at around 3330 cm-1 was observed on the spectrum of solid residue (Sain and Panthapulakkal 2006), which indicated that the hydroxyl groups in the raw materials were released through liquefaction. The strong hydroxyl group peaks in bio-polyol and liquefied Yaupon holly were partially attributed to liquefaction solvent, i.e. glycerol and EG. The other part of hydroxyl sources were derived from the liquefaction of Yaupon holly.
One of the hydroxyl sources is the liquefaction of hemicellulose, which can produce an abundance of C5 sugars with a multi-hydroxyl structure (Xu et al. 2016; Huang et al. 2017). The prominent peaks appeared on the spectra of bio-polyol and liquefied Yaupon holly at 1730 cm-1 corresponding to acetyl and uronic ester groups in hemicellulose (Li et al. 2015), which suggested that the hemicellulose in the raw material was successfully liquefied and dissolved into bio-polyol. The liquefaction of cellulose is another hydroxyl source, which provides an abundance of C6 sugars that are rich in hydroxyl groups (Xu et al. 2016; Huang et al. 2017). The liquefaction of cellulose could be observed from the observation of cellulose characteristic peaks in bio-polyol and liquefied Yaupon holly at 1420 cm-1 (C-H2), 1035 cm-1 (C-O), and 899 cm-1 (C-H) (Chen et al. 2014; Li et al. 2015). The peaks at 1600 cm-1 and 1500 cm-1 (C=C in aromatic rings), 1456 cm-1 (C-H in aromatic rings), and 1235 cm-1 (guaiacyl ring) corresponded to lignin (Poletto et al. 2012; Li et al. 2015). These peaks were discovered in the spectra of bio-polyol and liquefied Yaupon holly, which indicated that the lignin in the raw material was successfully liquefied and dissolved into bio-polyol as well. Moreover, the lignin-derived hydroxyl group was also observed in the bio-polyol at a peak of 1370 cm-1 (Alriols et al. 2009), which suggested that the liquefaction of lignin was also a hydroxyl source. The hydroxyl number of bio-polyol was 347.42 ± 8.61 mg KOH/g determined using a titration method. This hydroxyl number was closed to the value (343 mg KOH/g) from the liquefaction of cork at 150 °C for 80 min heated by conventional method (Gama et al. 2014).
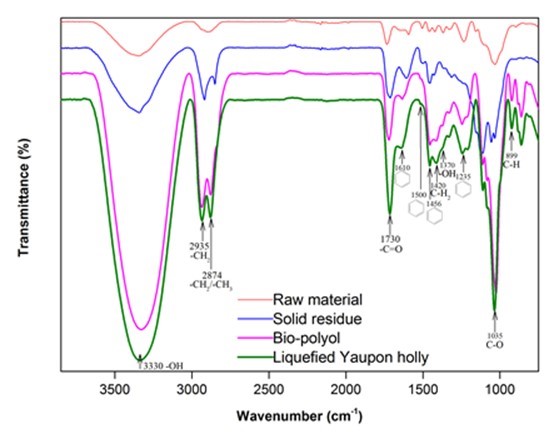
Fig. 2. FTIR spectra of raw material, solid residue, bio-polyol, and liquefied Yanpon holly using the optimal liquefaction parameters
Characterization of Biofoams
Because the cell structure and pore size of PU foams are closely related to their thermal conductivity and mechanical properties (Gama et al. 2015), it is necessary to characterize the microstructure of biofoams. The SEM images of the cross-section surfaces of the biofoams with different isocyanate indexes are depicted in Fig. 3. It was found that the foam cells became more regular and smooth with an increased isocyanate index from 105 to 150. Especially, biofoams with an isocynate index of 135 and 150 exhibited a formal honeycomb skeleton covered by a thin membrane, which was beneficial to increase the thermal insulation property. With an increased isocyanate index from 105 to 135, the pore diameter gradually increased from 161.5 µm to 242.1µm. In contrast, with further increase in the isocyanate index to 150, it decreased to 223.5µm. The increase of pore diameter was probably attributable to the increase of CO2 amount as the increase of isocyanate index. However, the decreasing pore size at PU150 was probably due to the increase of cell wall elasticity, which could contribute to restricting the CO2 blowing and expanding, resulting in a smaller pore diameter. As reported in literature, the increase of isocyanate index could increase the formation of allophanate crosslinks, which has a positive effect on the elasticity of cell wall (Kim et al. 2008). As a whole, the pore diameter was comparable to that of sugarcane bagasse-derived PU foam (Hakim et al. 2011). The SEM micrographs indicated that the variation of isocyanate index played an important role in the microstructure of the biofoams.
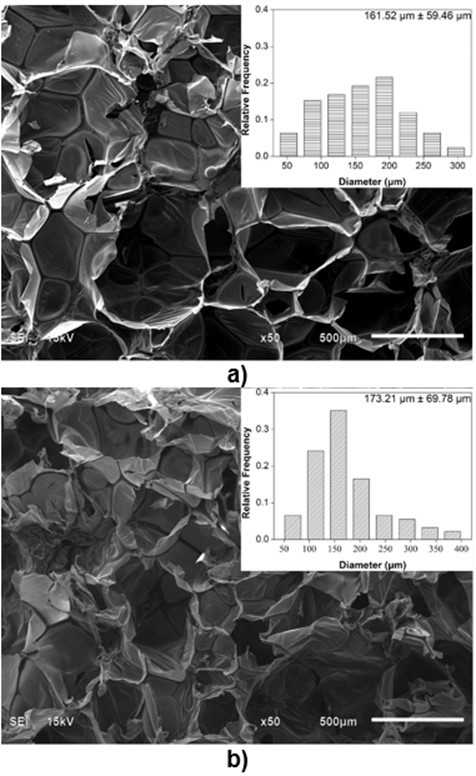
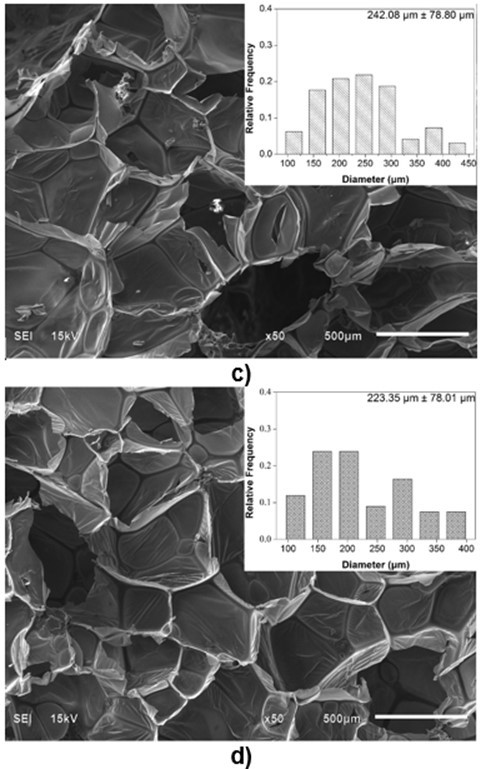
Fig. 3. SEM images of biofoams as a function of isocyanate index (a: 105; b: 120; c: 135; d: 150)
As shown in Table 1, the densities of biofoams decreased with increased isocynate index from 105 to 135, and then increased as the isocynate index increased to 150. The density was highly dependent on the foam cell size. In general, foam with larger pore diameter will have a lower density and vice versa (Ugarte et al. 2014). Besides, the density of cellular material is also related to its cell wall thickness. In this work, even though the pore diameter of PU150 was bigger than those of PU105 and PU130, its density presented a greater value as compared with PU105 and PU130. The result was probably attributable to its thick wall structure. As reported, the densities of biofoams made from liquefaction of biomass are in the range of 20.4 kg·m-3 to 119.5 kg·m-3 (Hakim et al. 2011; Gama et al. 2014; Hu and Li 2014; Gama et al. 2015; Xie et al. 2015b; Esteves et al. 2017). In comparison to these foams, the biofoams obtained in this work had a low density varying from 15.16 kg·m-3 to 18.46 kg·m-3.
Table 1. Physico-mechanical Properties of Biofoams with Respect to Isocyanate Index
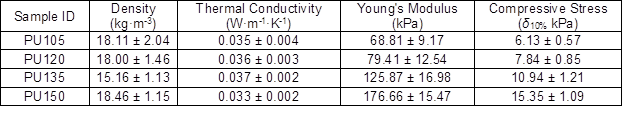
Thermal conductivity is the key thermal property that governs insulation applications of PU foams. It is closely related to the foam density, cell orientation, the ratio of open to closed cells, and the thermal conductivity of trapped gas (Ahern et al. 2005). It was observed that the thermal conductivity value of biofoams gradually increased from 0.035 W·m-1·K-1 to 0.037 W·m-1·K-1 with the increased isocyanate index from 105 to 135, and the minimum value (0.033 W·m-1·K-1) was obtained from PU150, as shown in Table 1. The result was ascribed to the variation of foam density. In general, thermal conductivity is inversely proportional to density of the PU foam, probably because of the lower radiant heat transfer rate through the gases trapped in small cells (Hakim et al. 2011). The thermal conductivity values were comparable with those of corn stover derived foam ranging from 0.032 W·m-1·K-1 to 0.039 W·m-1·K-1 (Hu and Li 2014). It should be noted that they were satisfactory to be used as insulation foam in which the thermal conductivity varies between 0.0233 W·m-1·K-1 and 0.0505 W·m-1·K-1 (Gama et al. 2015; Mahmood et al. 2016).
The compressive stress-strain curves of biofoams were composed of three regions as shown in Fig. 4. The first linear region (< 10%) corresponded to the elastic response of material with foam cell walls bending, followed by a so-called plateau-collapse region that the cell walls buckled and yielded, and finally, beyond 25% deformation, the compressive stress underwent a rapid increase process and the foams became densified because the cell walls were crushed together. Figure 4 also indicates that the isocyanate index had a dramatic effect on the mechanical properties of biofoams. With increased isocyanate index, both the compressive stress at 10% strain and the slope of the linear region increased gradually, which suggested that the compressive properties were enhanced by adding more pMDI. The result was confirmed in Table 1. The excessive isocyanate groups (NCO) could be reacting with urethane and urea to form allophanate and biuret, which could provide stronger linkages than urethane bonds (Dušek et al. 1991), resulting in rather strong mechanical properties. It was noteworthy that the maximum Young’s modulus (176.7 kPa) and compressive stress (15.4 kPa) obtained from PU150 were superior to that of the bio-based polyurethane insulation foam derived from the liquefaction of coffee grounds, in which the Young’s modulus varied from 73.2 kPa to 88.6 kPa and the compressive stress ranged from 2.5 kPa to 7.3 kPa (Gama et al. 2015), suggesting that sufficient mechanical properties of polyurethane foam could be obtained from PU150 for the application of thermal insulation.
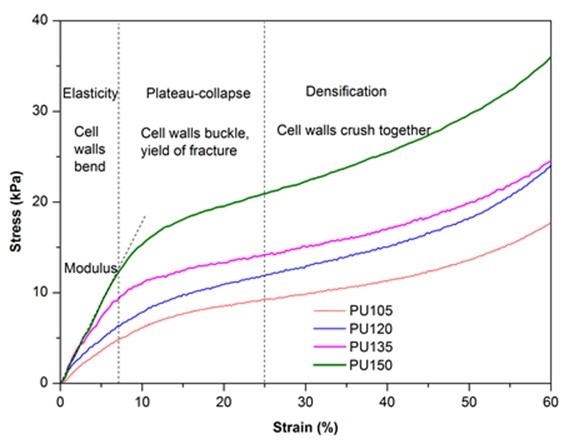
Fig. 4. Stress-strain cures of biofoams as a function of isocyanate index
Figure 5 presents the TG and DTG cures of biofoams under nitrogen. There were three distinctive regions of major weight loss for these biofoams. The weight loss up to 150 °C was considered to be due to the evaporation of the moisture content and the release of volatile components. The DTG curves exhibited a fluctuant status between 140 °C and 230 °C, which were attributed to the reversible dissociation and reassociation reaction of the unstable urethane links (Hablot et al. 2008). This decomposition became irreversible around 230 °C and reached the maximum at approximately 330 °C. The second region of the significant weight loss was at approximately 400 °C, which might have been caused by the decompositions of polyol and liquefied wood components (Zhao et al. 2012; Hu and Li 2014). Finally, the third region centered at approximately 490 °C was assigned to the degradation of lignin and other more difficult to break parts (Ertaş et al. 2014). Moreover, it also corresponded to the degradation of pMDI. It was worthy to note that increasing the isocyanate index resulted in the increase of the maximum decomposition temperature from 324.42 °C to 336.34 °C. It was probably ascribed to the higher isocyanate index that could contribute to higher crosslink density, which could enhance the thermal stability of biofoams (Zhao et al. 2012). The thermal stability and degradation behavior of biofoams produced in this work were similar to those of sugarcane bagasse-derived PU foam (Xie et al. 2015b).
Therefore, it could be said that the bio-polyol from the liquefaction of Yaupon holly can be used directly to produce PU foam. It was recommended that the resulting low-density insulation foam with low thermal conductivity can be produced using the isocyanate index 150, and it can be used as thermal insulation.
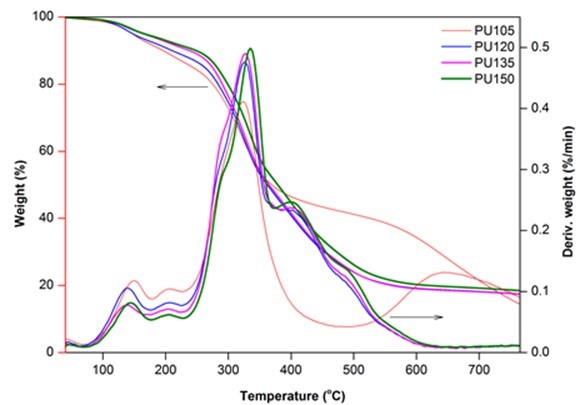
Fig. 5. TG and DTG cures of biofoams as a function of isocyanate index
CONCLUSIONS
- The optimized liquefaction parameters can be summarized as follows: 1) particle size was controlled in the range of 16- to 40-mesh; 2) both the glycerol to EG ratio and liquid to solid ratio were set at 3:1; 3) the liquefaction process was conducted at 160 °C for 10 min and catalyzed by 1.5% H2SO4. The optimal liquefaction conversion yield was 94.9%.
- The FTIR spectra of liquefaction products confirmed the successful liquefaction of hemicellulose, cellulose, and lignin that are sources of hydroxyl groups. The hydroxyl number of bio-polyol was 347.4 mg KOH/g, which was determined using a titration method.
- The desired low-density biobased PU foam was obtained by controlling the isocyanate index at 150.
- The density, thermal conductivity, Young’s modulus, and compressive stress of the resulting low-density biofoam were 18.5 kg·m-3, 0.033 W·m-1K-1, 176.7 kPa, and 15.4 kPa, respectively. It is noteworthy that this low-density biofoam is suitable to be used as construction insulation.
ACKNOWLEDGMENTS
This work was funded by the USDA Forest Service 2015 Wood Innovations Funding Opportunity program, Agreement 15-DG-11083150-054. The authors also appreciate the financial support from the China Scholarship Council.
REFERENCES CITED
Ahern, A., Verbist, G., Weaire, D., Phelan, R., and Fleurent, H. (2005). “The conductivity of foams: A generalization of the electrical to the thermal case,” Colloids Surfaces A: Physicochemical and Engineering Aspects 263(1-3), 275-279. DOI: 10.1016/j.colsurfa.2005.01.026
Alriols, M. G., Tejado, A., Blanco, M., Mondragon, I., and Labidi, J. (2009). “Agricultural palm oil tree residue as raw material for cellulose, lignin and hemicelluloses production by ethylene glycol pulping process,” Chemical Engineering Journal 148(1), 106-114. DOI: 10.1016/j.cej.2008.08.008
ASTM D1102-84 (2001). “Standard test method for ash solubility of wood,” ASTM International, West Conshohocken, USA.
ASTM D1103-60 (1971). “Standard test method for alpha-cellulose in wood,” ASTM International, West Conshohocken, USA.
ASTM D1104-56 (1971). “Standard test method for holocellulose in wood,” ASTM International, West Conshohocken, USA.
ASTM D1106-96 (1996). “Standard test method for acid-insoluble lignin in wood,” ASTM International, West Conshohocken, USA.
ASTM D1107-96 (1996). “Standard test method for ethanol-toluene solubility of wood,” ASTM International, West Conshohocken, USA.
ASTM D1109-84 (2001). “Standard test method of 1% sodium hydroxide solubility of wood,” ASTM International, West Conshohocken, USA.
ASTM D1110-96 (1996). “Standard test for water solubility of wood,” ASTM International, West Conshohocken, USA.
ASTM D1622-08 (2008). “Standard test method for apparent density of rigid cellular plastics,” ASTM International, West Conshohocken, USA.
Chen, C., Luo, J., Qin, W., and Tong, Z. (2014). “Elemental analysis, chemical composition, cellulose crystallinity, and FT-IR spectra of Toona sinensis wood,” Monatshefte für Chemie [Chemical Monthly] 145(1), 175-185. DOI: 10.1007/s00706-013-1077-5
Chen, F., and Lu, Z. (2009). “Liquefaction of wheat straw and preparation of rigid polyurethane foam from the liquefaction products,” Journal of Applied Polymer Science 111(1), 508-516. DOI: 10.1002/app.29107
Dušek, K., Špírkoá, M., and Ilavský, M. (1991). “Network formation in polyurethanes due to allophanate and biuret formation: Gel fraction and equilibrium modulus,” Macromolecular Symposia 45(1), 87-95. DOI: 10.1002/masy.19910450112
Ertaş, M., Fidan, M. S., and Alma, M. H. (2014). “Preparation and characterization of biodegradable rigid polyurethane foams from the liquefied eucalyptus and pine woods,” Wood Research 59(1), 97-108.
Esteves, B., Dulyanska, Y., Costa, C., Ferreira, J. V., Domingos, I., Pereira, H., de Lemos, L. T., and Cruz-Lopes, L. (2017). “Cork liquefaction for polyurethane foam production,” BioResources 12(2), 2339-2353. DOI: 10.15376/biores.12.2.2339-2353
Ferreira, M. P., Gendron, F., McClure, K. C., and Kindscher, K. (2012). “North American bioactive plants for human health and performance,” Global Journal of Research on Medicinal Plants & Indigenous Medicine 1(11), 568-582.
Gama, N. V., Soares, B., Freire, C. S., Silva, R., Brandão, I., Neto, C. P., Barros-Timmons, A., and Ferreira, A. (2014). “Rigid polyurethane foams derived from cork liquefaction at atmospheric pressure,” Polymer International 64(2), 250-257. DOI: 10.1002/pi.4783
Gama, N. V., Soares, B., Freire, G. S. R., Silva, R., Neto, C. P., Barros-Timmons, A., and Ferreira, A. (2015). “Bio-based polyurethane foams toward applications beyond thermal insulation,” Materials & Design 76, 77-85. DOI: 10.1016/j.matdes.2015.03.032
Guo, J., Zhuang, Y., Chen, L., Liu, J., Li, D., and Ye, N. (2012). “Process optimization for microwave-assisted direct liquefaction of Sargassum polycystum C. Agardh using response surface methodology,” Bioresource Technology 120, 19-25. DOI: 10.1016/j.biortech.2012.06.013
Hablot, E., Zheng, D., Bouquey, M., and Avérous, L. (2008). “Polyurethanes based on castor oil: Kinetics, chemical, mechanical and thermal properties,” Macromolecular Materials and Engineering 293(11), 922-929. DOI: 10.1002/mame.200800185
Hakim, A. A. A., Nassar, M., Emam, A., and Sultan, M. (2011). “Preparation and characterization of rigid polyurethane foam prepared from sugar-cane bagasse polyol,” Materials Chemistry and Physics 129(1-2), 301-307. DOI: 10.1016/j.matchemphys.2011.04.008
Huang, X. Y., Li, F., Xie, J. L., de Hoop, C. F., Hse, C. Y., Qi, J. Q., and Xiao, H. (2017). “Microwave-assisted liquefaction of rape straw for the production of bio-oils,” BioResources 12(1), 1968-1981. DOI: 10.15376/biores.12.1.1968-1981
Hu, S., and Li, Y. (2014). “Two-step sequential liquefaction of lignocellulosic biomass by crude glycerol for the production of polyols and polyurethane foams,” Bioresource Technology 161, 410-415. DOI: 10.1016/j.biortech.2014.03.072
Hu, S., Wan, C., and Li, Y. (2012). “Production and characterization of biopolyols and polyurethane foams from crude glycerol based liquefaction of soybean straw,” Bioresource Technology 103(1), 227-233. DOI: 10.1016/j.biortech.2011.09.125
Jasiukaitytė, E., Kunaver, M., and Strlič, M. (2009). “Cellulose liquefaction in acidified ethylene glycol,” Cellulose 16(3), 393-405. DOI: 10.1007/s10570-009-9288-y
Jo, Y. J., Ly, H. V., Kim, J., Kim, S. S., and Lee, E. (2015). “Preparation of biopolyol by liquefaction of palm kernel cake using PEG#400 blended glycerol,” Journal of Industrial and Engineering Chemistry 29, 304-313. DOI: 10.1016/j.jiec.2015.04.010
Kapps, M., and Buschkamp, S. (2004). The Production of Rigid Polyurethane Foam (PU21012-0406 en), Bayer Material Science, New Martinsville, WV, USA.
Kim, S. H., Kim, B. K., and Lim, H. (2008). “Effect of isocyanate index on the properties of rigid polyurethane foams blown by HFC 365mfc,” Macromolecular Research 16(5), 467-472. DOI: 10.1007/BF03218546
Lee, J. H., Lee, J. H., Kim, D. K., Park, C. H., Yu, J. H., and Lee, E. Y. (2016). “Crude glycerol-mediated liquefaction of empty fruit bunches saccharification residues for preparation of biopolyurethane,” Journal of Industrial and Engineering Chemistry 34, 157-164. DOI: 10.1016/j.jiec.2016.04.019
Lee, S. H., Teramoto, Y., and Shiraishi, N. (2002). “Biodegradable polyurethane foam liquefied waste paper and its thermal stability, biodegradability, and genotoxicity,” Journal of Applied Polymer Science 83(7), 1482-1489. DOI: 10.1002/app.10039
Lee, S. H., Yoshioka, M., and Shiraishi, N. (2000). “Liquefaction of corn bran (CB) in the presence of alcohols and preparation of polyurethane foam from its liquefied polyol,” Journal of Applied Polymer Science 78(2), 319-325. DOI: 10.1002/1097-4628 (20001010)78:2<319::AID-APP120>3.3.CO;2-Q
Liang, L., Mao, Z., Li, Y., Wan, C., Wang, T., Zhang, L., and Zhang, L. (2006). “Liquefaction of crop residues for polyol production,” BioResources 1(2), 248-256. DOI: 10.15376/biores.1.2.248-256
Li, G., Hse, C., and Qin, T. (2015). “Wood liquefaction with phenol by microwave heating and FTIR evaluation,” Journal of Forestry Research 26(4), 1043-1048. DOI: 10.1007/s11676-015-0114-0
Liu, H. M., Xie, X. A., Feng, B., and Sun, R. C. (2011). “Effect of catalysts on 5-lump distribution of cornstalk liquefaction in sub-critical ethanol,” BioResources 6(3), 2592-2604. DOI: 10.15376/biores.6.3.2592-2604
Mahmood, N., Yuan, Z., Schmidt, J., Tymchyshyn, M., and Xu, C. C. (2016). “Hydrolytic liquefaction of hydrolysis lignin for the preparation of biobased rigid polyurethane foam,” Green Chemistry 18, 2358-2398. DOI: 10.1039/C5GC02876K
Poletto, M., Zattera, A. J., and Santana, R. M. C. (2012). “Structural differences between wood species: Evidence from chemical composition, FTIR spectroscopy, and thermogravimetric analysis,” Journal of Applied Polymer Science 126(1), E337-E344. DOI: 10.1002/app.36991
Sain, M., and Panthapulakkal, S. (2006). “Bioprocess preparation of wheat straw fibers and their characterization,” Industrial Crops and Products 23(1), 1-8. DOI: 10.1016/j.indcrop.2005.01.006
Shao, Q., Li, H. Q., Huang, C. P., and Xu, J. (2016). “Biopolyol preparation from liquefaction of grape seeds,” Journal of Applied Polymer Science 133(34), 43835. DOI: 10.1002/APP.43835
Soares, B., Gama, N., Freire, C., Barros-Timmons, A., Brandão, I., Silva, R., Neto, C. P., and Ferreira, A. (2014). “Ecopolyol production from industrial cork powder via acid liquefaction using polyhydric alcohols,” ACS Sustainable Chemistry & Engineering 2(4), 846-854. DOI: 10.1021/sc400488c
Sobhy, A., and Chaouki. J. (2010). “Microwave-assisted biorefinery,” Chemical Engineering Transactions 19, 25-30. DOI: 10.3303/CET1019005
Ugarte, L., Saralegi, A., Fernández, R., Martín, L., Corcuera, M. A., and Eceiza, A. (2014). “Flexible polyurethane foams based on 100% renewably sourced polyols,” Industrial Crops and Products 62, 545-551. DOI: 10.1016/j.indcrop.2014.09.028
Xie, J., Hse, C. Y., Shupe, T. F., Pan, H., and Hu, T. (2016). “Extraction and characterization of holocellulose fibers by microwave-assisted selective liquefaction of bamboo,” Journal of Applied Polymer Science 133(18). DOI: 10.1002/app.43394
Xie, J., Qi, J., Hse, C., and Shupe, T. F. (2015a). “Optimization for microwave-assisted direct liquefaction of bamboo residue in glycerol/methanol mixtures,” Journal of Forestry Research 26(1), 261-265. DOI: 10.1007/s11676-015-0032-1
Xie, J., Zhai, X., Hse, C. Y., Shupe, T. F., and Pan, H. (2015b). “Polyols from microwave liquefied bagasse and its application to rigid polyurethane foam,” Materials 8(12), 8496-8509. DOI: 10.3390/ma8125472
Xie, J., Qi, J., Hse, C. Y., and Shupe, T. F. (2014). “Effect of lignin derivatives in the bio-polyols from microwave liquefied bamboo on the properties of polyurethane foams,” BioResources 9(1), 578-588. DOI: 10.15376/biores.9.1.578-588
Xu, J., Jiang, J., Hse, C., and Shupe, T. F. (2012). “Renewable chemical feedstocks from integrated liquefaction processing of lignocellulosic materials using microwave energy,” Green Chemistry 14(10), 2821-2830. DOI: 10.1039/c2gc35805k
Xu, J., Xie, X., Wang, J., and Jiang, J. (2016). “Directional liquefaction coupling fractionation of lignocellulosic biomass for platform chemicals,” Green Chemistry 18, 3124-3138. DOI: 10.1039/C5GC03070F
Xue, B. L., Wen, J. L., and Sun, R. C. (2015). “Producing lignin-based polyols through microwave-assisted liquefaction for rigid polyurethane foam production,” Materials 8(2), 586-599. DOI: 10.3390/ma8020586
Yan, Y., Pang, H., Yang, X., Zhang, R., and Liao, B. (2008). “Preparation and characterization of water-blown polyurethane foams from liquefied cornstalk polyol,” Journal of Applied Polymer Science 110(2), 1099-1111. DOI: 10.1002/app.28692
Ye, L., Zhang, J., Zhao, J., and Tu, S. (2014). “Liquefaction of bamboo shoot shell for the production of polyols,” Bioresource Technology 153, 147-153. DOI: 10.1016/j.biortech.2013.11.070
Zhang, C., and Kessler, M. R. (2015). “Biobased polyurethane foam made from compatible blends of vegetable-oil-based polyol and petroleum-based polyol,” ACS Sustainable Chemistry & Engineering 3(4), 743-749. DOI: 10.1021/acssuschemeng.5b00049
Zhang, H., Ding, F., Luo, C., Xiong, L., and Chen, X. (2012a). “Liquefaction and characterization of acid hydrolysis residue of corncob in polyhydric alcohols,” Industrial Crops and Products 39, 47-51. DOI: 10.1016/j.indcrop.2012.02.010
Zhang, H., Pang, H., Shi, J., Fu, T., and Liao, B. (2012b). “Investigation of liquefied wood residues based on cellulose, hemicellulose, and lignin,” Journal of Applied Polymer Science 123(2), 850-856. DOI: 10.1002/app.34521
Zhang, H., Pang, H., Zhang, L., Chen, X., and Liao, B. (2013). “Biodegradability of polyurethane foam from liquefied wood based polyols,” Journal of Polymers and the Environment 21(2), 329-334. DOI: 10.1007/s10924-012-0542-2
Zhao, Y., Yan, N., and Feng, M. (2012). “Polyurethane foams derived from liquefied mountain pine beetle-infested barks,” Journal of Applied Polymer Science 123(5), 2849-2858. DOI: 10.1002/app.34806
Zhuang, Y., Guo, J., Chen, L., Li, D., Liu, J., and Ye, N. (2012). “Microwave-assisted direct liquefaction of Ulva prolifera for bio-oil production by acid catalysis,” Bioresource Technology 116, 133-139. DOI: 10.1016/j.biortech.2012.04.036
Article submitted: August 8, 2017; Peer review completed: September 10, 2017; Revised version received and accepted: September 13, 2017; Published: September 19, 2017.
DOI: 10.15376/biores.12.4.8160-8179