
Abstract
Current ethanol production processes using crops such as corn and sugar cane have been well established. However, the utilization of cheaper lignocellulosic biomass could make bioethanol more competitive with fossil fuels while avoiding the ethical concerns associated with using potential food resources. In this study, Miscanthus, a lignocellulosic biomass, was pretreated using NaOH to produce bioethanol. The pretreatment and enzymatic hydrolysis conditions were evaluated by response surface methodology (RSM). The optimal conditions were found to be 145.29 °C, 28.97 min, and 1.49 M for temperature, reaction time, and NaOH concentration, respectively. Enzymatic digestibility of pretreated Miscanthus was examined at various enzyme loadings (10 to 70 FPU/g cellulose of cellulase and 30 CbU/g of β-glucosidase). Regarding enzymatic digestibility, 50 FPU/g cellulose of cellulase and 30 CbU/g of β-glucosidase were selected as the test concentrations, resulting in a total glucose conversion rate of 83.92%. Fermentation of hydrolyzed Miscanthus using Saccharomyces cerevisiae resulted in an ethanol concentration of 59.20 g/L at 20% pretreated biomass loading. The results presented here constitute a significant contribution to the production of bioethanol from Miscanthus.
Download PDF
Full Article
BIOETHANOL PRODUCTION BY MISCANTHUS AS A LIGNOCELLULOSIC BIOMASS: FOCUS ON HIGH EFFICIENCY CONVERSION TO GLUCOSE AND ETHANOL
Minhee Han,a Gi-Wook Choi,a,* Yule Kim,a and Bon-cheol Koo b
Current ethanol production processes using crops such as corn and sugar cane have been well established. However, the utilization of cheaper lignocellulosic biomass could make bioethanol more competitive with fossil fuels while avoiding the ethical concerns associated with using potential food resources. In this study, Miscanthus, a lignocellulosic biomass, was pretreated using NaOH to produce bioethanol. The pretreatment and enzymatic hydrolysis conditions were evaluated by response surface methodology (RSM). The optimal conditions were found to be 145.29 °C, 28.97 min, and 1.49 M for temperature, reaction time, and NaOH concentration, respectively. Enzymatic digestibility of pretreated Miscanthuswas examined at various enzyme loadings (10 to 70 FPU/g cellulose of cellulase and 30 CbU/g of β-glucosidase). Regarding enzymatic digestibility, 50 FPU/g cellulose of cellulase and 30 CbU/g of β-glucosidase were selected as the test concentrations, resulting in a total glucose conversion rate of 83.92%. Fermentation of hydrolyzed Miscanthus using Saccharomyces cerevisiae resulted in an ethanol concentration of 59.20 g/L at 20% pretreated biomass loading. The results presented here constitute a significant contribution to the production of bioethanol from Miscanthus.
Keywords: Bioethanol; Miscanthus; Response surface methodology (RSM); Enzymatic hydrolysis; Fermentation
Contact information: a: Changhae Institute of Cassava and Ethanol Research, Changhae Ethanol Co., Ltd, Jeonju, 561-203, Korea; b: Bioenergy Crop Research Center, National Institute of Crop Science,
Rural Development Administration, Muan, 534-833, Korea; *Corresponding author: changrd@chethanol.com
INTRODUCTION
Over the last few decades, the excessive consumption of fossil fuels has led to an increasing demand for alternative sources of fuel (Zaldivar et al. 2001). These alternative sources usually rely upon the production of renewable energy sources such as ethanol. Currently, ethanol is mainly produced from sugar or starch for use as a fuel. However, the availability of raw materials that are also food sources is not sufficient to meet the need for ethanol fuel production (Hahn-Hagerdal et al. 2006). Cellulosic ethanol is one of the most promising technological approaches available for reducing the emission of greenhouse gases from the transportation sector (Lynd 1996). Further, lignocellulosic biomass is a widely available, low-cost feedstock that is not subject to the ethical concerns associated with the use of a potential food resource (Rass-Hansen et al. 2007). For this reason, the development of a process for converting lignocellulosic biomass into ethanol is imperative. However, such a process is challenging due to the complex structure of the plant cell wall. Pretreatment is required to alter the structural and chemical composition of lignocellulosic biomass to facilitate rapid and efficient hydrolysis of carbohydrates in the cell wall into fermentable sugars (Chang and Holtzapple 2000).
A variety of physical (comminution, hydrothermolysis), chemical (acid, alkali, solvents, ozone), physico-chemical (steam explosion, ammonia fiber explosion), and biological pretreatment techniques have been developed to improve the accessibility of enzymes to cellulosic fibers (Moiser et al. 2005). Acid pretreatment includes the use of sulfuric, nitric, or hydrochloric acids to remove hemicellulosic components and expose cellulose to enzymatic digestion (Schell et al. 2003). Agricultural residues such as corncobs and stovers are particularly well suited for dilute acid pretreatment (Torget et al. 1991). Alkali pretreatment refers to the application of alkaline solutions for the removal of lignin and various uronic acid substitutions present on hemicellulose that lower enzyme accessibility (Chang and Holtzapple 2000). Generally, alkaline pretreatment is more effective for agricultural residues and herbaceous crops than wood materials (Hsu 1996). Peroxide pretreatment enhances enzymatic conversion through oxidative delignification and reduction of cellulose crystallinity (Gould 1985). Increased lignin solubilization and cellulose availability have been observed during the peroxide pretreatment of wheat straw (Martel and Gould 1990), Douglas fir (Yang et al. 2002), and oak (Kim et al. 2001). Ozonation is another attractive pretreatment method that does not leave strong acidic, basic, or toxic residues in treated materials (Neely 1984). The effect of ozone pretreatment is essentially limited to lignin degradation. Specifically, hemicellulose is attacked, while cellulose is barely affected (Sun and Cheng 2002). Further, ozonation has been widely used to reduce the lignin content of both agricultural and forestry wastes (Neely 1984).
Miscanthus utilizes the C4 photosynthetic pathway. Compared to C3 plants, which make up the majority of plants, C4 plants have a higher carbon dioxide fixation rate that results in high rates of photosynthesis. Therefore, C4 plants can grow very fast. Additionally, C4 plants have a very low compensation point, enabling them to conduct photosynthesis at high light intensity when only low concentrations of carbon dioxide are available. Furthermore, since the concentration of CO2 relative to O2 in the cells of C4 plants is high, the rate of photorespiration in C4 plants is significantly lower than in C3 plants (Theese 1995). Miscanthus can grow up to 4 m tall (Eitzinger and Kossler 2002). The height of the plant is dependent on the species as well as the growing conditions. A benefit of Miscanthus is its high biomass yield, which depends on the season during which it is harvested (Himken et al. 1997). In Northern Europe, M. sinesis hybrids have been found to yield up to 25 t/ha, whereas in middle and Southern Europe M. x giganteus yields up to 38 t/ha, and M. sinensishybrids yield up to 41 t/ha (Lewandowski et al. 2003).
To fully utilize Miscanthus as a feedstock for ethanol production, pretreatment is required to render the cellulose fibers more amenable to the action of hydrolytic enzymes. In this study, response surface methodology (RSM) was used to determine the optimal pretreatment with NaOH solution and enzymatic hydrolysis conditions that produce high concentrations of bioethanol. RSM is a statistical technique used to model and optimize multiple variables, and it can be used to determine the optimum conditions by combining experimental design with interpolation of first- or second-order polynomial equations in a sequential testing procedure. This methodology has already been successfully applied in optimizing the enzymatic hydrolysis of several substrates, including cellulose (Kunamneni and Singh 2005; Tengborg et al. 2001; Marques et al. 2007; Ribeiro and Ribeiro 2008; Gouveia et al. 2008; Lu et al. 2007; Lebo et al. 2004). Also, enzymatic hydrolysis and fermentation experiments were carried out using the pretreated biomass to determine the appropriate enzyme concentration and biomass loading. As the enzyme cost is high relative to other factors, the enzyme dosage has a great effect on the economics. Although high biomass loading could lead to high ethanol concentration, it is too difficult to agitate as the solid content and viscosity increase. In addition, the enzyme can be exposed to product inhibition by glucose that is produced in the course of enzymatic hydrolysis. Under these conditions, bioethanol was produced through separate hydrolysis and fermentation (SHF) processes, which is the most basic process used for fermentation in order to minimize contamination.
MATERIALS AND METHODS
Raw Materials
Miscanthus was harvested at a local site in Korea (Jeonju City) during the winter of 2009 and air-dried at temperatures below 45 °C to obtain a dry matter content of 92 to 94%. Dried Miscanthus was chopped and hammer-milled to a particle size of 1 to 3 mm, then stored in sealed plastic bags at room temperature until used.
Enzymes were provided by Novozymes, Korea. A cellulase complex (NS50013) and β-glucosidase (NS50010) were used to investigate enzymatic digestibility. The cellulase complex had an activity of 70 filter paper units (FPU)/g cellulose. The β-glucosidase had 250 cellobiase units (CbU)/g. All reagents used in this study were of analytical grade.
NaOH Pretreatment and Enzymatic Hydrolysis
In this study, 10 mL of NaOH solution was used to pretreat 2 g of ground Miscanthus samples in order to determine the optimum pretreatment and enzymatic hydrolysis conditions. The treatments were performed at various temperatures and for various times in an oil bath. The reaction time was estimated after approaching the set temperature. After cooling, the treated biomasses were washed with deionized water several times. Then, the biomass was dried at 45 °C in order to fix the moisture for enzymatic hydrolysis.
Two enzyme solutions, the cellulase complex and β-glucosidase, were used to investigate the effects of enzyme concentration (cellulase activity of 5 to 70 FPU/g cellulose and β-glucosidase activity of 30 CbU/g) and biomass concentration (1 to 30% loading) on enzymatic hydrolysis. Hydrolysis was conducted at 50 °C and 150 rpm for 72 h. After the reaction, 1.0 mL aliquots were taken and centrifuged at 5,000 rpm for 10 min. The supernatant was removed for sugar content analysis (Yang and Wyman 2004).
Experimental Design
Response surface methodology (RSM) is a collection of mathematical and statistical techniques that are used to model and analyze problems in which the response of interest is influenced by several variables, and the objective is to optimize this response (Montgomery 2001). In this study, many variables could potentially affect the efficiency of the pretreatment process. Central composite rotatable design (CCRD) was employed to determine the effects of independent variables on the response and factor interactions using different combinations of variables. Three independent variables, namely temperature (X1), reaction time (X2), and NaOH solution concentration (X3), were studied at three levels with three repetitions at the central point and three replications at the axial and factorial points (Table 1).
Table 1. Coded and Decoded Values for each Variable of the Central Composite Rotatable Design

For each of the five variables studied, high (coded +√2) and low (coded −√2) set points were selected according to the results obtained in the preliminary tests. The results of each CCRD were analyzed using Design Expert® software version 7.1.3 from Stat-Ease, Inc., Minneapolis, USA. The quadratic effects of the five variables were calculated, as well as their possible interactions, with the conversion rate of the biomass to glucose. The significance of these variables was evaluated using variance analysis (ANOVA).
Three-dimensional surface plots were drawn to illustrate the effects of the independent variables on the dependent variables, as described by a quadratic polynomial equation fitted to the experimental data. The fit of the models was evaluated by determining the R-squared coefficient and the adjusted R-squared coefficient. To verify the models, optimum values for the selected variables were obtained by solving the regression equation using Design Expert® software version 7.1.3.
Fermentation with Industrial Microorganism Saccharomyces cerevisiae CHY 1011
After enzymatic hydrolysis, S. cerevisiae CHY 1011 was inoculated, and solid caps were replaced with silicone septa caps pierced with 22 g needles in order to exhaust the CO2 that was released during fermentation. The bottles were then placed back on the shaker/incubator, and the temperature was set to 32 °C. These bottles were sampled periodically for the next 48 h, after which the final ethanol concentration was estimated.
S. cerevisiae inoculum was prepared by growing strain CHY 1011 on solid YPD medium containing 10 g of yeast extract, 20 g of protease peptone, and 10 g of dextrose per liter supplemented with 15 g of Bacto agar. The solid culture was incubated at 32 °C for 48 h, after which a single colony was transferred to a 50 mL Erlenmeyer flask containing 10 mL of YPD. Then, the colony was grown at 32 °C with agitation (150 rpm) for 12 h. This culture was used to inoculate the seed culture, which consisted of 200 mL of YPD in a 500 mL Erlenmeyer flask incubated for 12 h.
Analytical Methods
The total solids, acid-soluble lignin, and acid-insoluble lignin contents of Miscanthus were determined by the National Renewable Energy Laboratory (NREL) using Standard Biomass Analytical Procedures (National Renewable Energy Laboratory). The carbohydrate content of Miscanthus was estimated by measuring the hemicellulose (xylan, galactan, and arabinan)- and cellulose (glucan)-derived sugars. The composition of the hydrolysate produced by enzymatic hydrolysis was determined by measuring glucose and xylose by high performance liquid chromatography (HPLC).
The HPLC (Waters, USA) system was equipped with a Bio-Rad Aminex HPX-87P column, a guard column, an automated sampler, a gradient pump, and a refractive index detector. The mobile phase was deionized water at a flow rate of 0.6 mL/min at 85 °C. Prior to HPLC injection, all samples (derived from solids and hydrolysate) were neutralized with calcium carbonate, centrifuged at 5,000 g for 10 min, and filtered through 0.2 µm syringe filters. The concentration and impurities of ethanol were deter-mined using a Density/Specific Gravity Meter (DA-510, KEM Co, Ltd., Japan) and gas chromatography (GC) with a Supelco 6.6 % CARBOWAX 20M column, Agilent, USA.
RESULTS AND DISCUSSION
Characteristics of Miscanthus
The chemical composition of Miscanthus varies according to its growth location, season, harvesting method, as well as analysis procedure (National Renewable Energy Laboratory). The composition of Miscanthus used in this study is listed in Table 2.
Based on the HPLC carbohydrate analysis, the sugar fraction was 59.08% and the lignin fraction was 23.31% of the dry biomass. Glucan, which was derived from both the Miscanthus fiber and plant cell wall, was the major component (36.96%). Xylan, as the major hemicellulose constituent, constituted up to 22.12%. Lignin is a complex chemical compound derived from biomass that protects against enzyme attack. Arabinan accounted for only a small portion (>1%) of the biomass, whereas galatan and mannan were not detected. Additionally, Miscanthus contained little ash (2 to 3%) and other unknown components. Glucan and xylan can be converted to ethanol using organisms capable for fermenting pentoses and hexoses. However, digestion of pentose by S. cerevisiae CHY 1011 is difficult, and therefore, cellulose was retained during pretreatment and utilized to ferment hexoses derived from the biomass.
Optimization of Pretreatment and Enzymatic Hydrolysis with Central Composite Rotatable Design (CCRD)
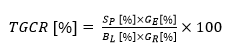
Following pretreatment and enzymatic hydrolysis, the total glucose conversion rate (TGCR) was evaluated as a function of temperature, time, and NaOH solution concentration. The TGCR was expressed as the efficiency of pretreatment and enzymatic hydrolysis at the same time, and it was determined according to Eq. 1,
 (1)
(1)
in which Sp is the solid ratio after pretreatment, GE is the glucose concentration after enzymatic hydrolysis, BL is the pretreated biomass loading at enzymatic hydrolysis, and GR is the raw biomass glucose concentration. The temperature ranged from 120 to 180 °C, time ranged from 10 to 30 min, and the pretreatment solution concentration ranged from 0.5 to 1.5 M in the optimal CCRD test (Table 3).
Table 2. Major Components of Miscanthus

*Values indicate the mean of triplicate observations
Table 3. Central Composite Design for the Optimization of Three Variables in Determining Total Glucose Conversion Rate (TGCR) after Enzymatic Hydrolysis

* Values indicate the mean of triplicate observations
Variance analysis (ANOVA) was performed to evaluate the effects of the variables and their possible interactions. The coefficients of the full model were evaluated using regression analysis, and their significance was tested. The insignificant coefficients were excluded from the model using backward elimination. The analysis of variance performed on the reduced models (Table 4) demonstrated that they were statistically significant with p-values lower than 0.0001.
Table 4. ANOVA Results for Response of Total Glucose Conversion Rate

R2 = 0.9998; adj. R2 = 0.9987; d.f.=degree of freedom.
The NaOH concentration produced the lowest p-values (<0.0001) among all factors, which indicates that NaOH concentration was the dominant factor affecting the TGCR. Equation (2) describes the correlation between the significant variables and glucose release rate for the pretreated biomass in terms of the decoded values,
Ya = 76.056 – 0.523 X1 -0.243 X2 + 14.16 X3– 1.162 X1X2 + 0.029 X1X3+ 2.681 X2X3– 0.129 X12 + 0.598 X22 -5.086 X32 + 5.356 X1X2X3– 2.593 X12X2 -8.035 X12X3+ 0.525 X1X22 (2)
where X1 is temperature, X2 is time, and X3 is the NaOH concentration.
The relationship between the response and controlled variables was visualized using the response surface or contour plots. Response surface plots were used to estimate the TGCR as a function of two factors, based on Eq. 2, while maintaining all of the other factors at a fixed level of zero. The convex response surfaces suggest that there were well-defined optimal variables. Graphic representation of the response surface shown in Fig. 1 helps visualize the effects of temperature and NaOH solution concentration.

Fig. 1. Response surface plots show the effects of temperature and NaOH solution concentration. The value of the variable time was fixed at the central point.
The proportion of the total variation attributed to each fit was evaluated using the R-squared value (noting that R2 > 0.75 indicates a suitable model) (Haaland 1989). For the pretreated Miscanthus, the regression equation resulted in an R2 value of 0.9998, which is in good agreement with the adjusted R2 of 0.9987. These results ensure that the theoretical values were well adjusted to the experimental data using this model. Therefore, the model was suitable for predicting the TGCR.
The optimum values of the selected variables were obtained by solving the regression equation, and results are shown in Table 5. To validate the model, the optimum values for Equation (2) were used in triplicate sets of experiments, and the maximum response obtained for each parameter is presented in Table 5. The experi-mental response for Miscanthuswas 83.92% of the TGCR. This value is in good agreement with the predicted value of 86.89 (82.55-91.23) with a 95% confidence interval. This behavior shows that the model could be adapted to the experimental results, confirming the validity and adequacy of the models.
Table 5. Optimal Values of the Test Variables in Decoded Units, and the Predicted Maximum of the Total Glucose Conversion Rate (TGCR) from Dry Biomass at a 95% Confidence Interval

Enzymatic Hydrolysis of Pretreated Miscanthus
Enzymatic hydrolysis experiments were carried out using the pretreated biomass in order to determine the effects of enzyme concentration and biomass loading. Equation 3 describes enzymatic digestibility,
 (3)
(3)
in which GE is the concentration of enzyme-converted glucose and GP is the glucose concentration after pretreatment. Figure 2 shows the enzymatic digestibility of pretreated Miscanthus at 1% (w/v) biomass loading with cellulase complex and β-glucosidase enzyme loadings of 5 to 70 FPU/g cellulose and 30 CbU/g, respectively. The conversion rate was enhanced in accordance with an increase in enzyme dosage. However, there was little difference in enzymatic digestibility when the enzyme dosage was greater than 50 FPU/g cellulose. Based on these results, an enzyme loading of 50 FPU/g cellulose was chosen to examine the enzymatic digestibility of pretreated Miscanthus, due to its high stability and effective reaction.

Fig. 2. Enzymatic digestibility of pretreated Miscanthus at 1% (w/v) biomass loading with cellulase complex and β-glucosidase enzyme loadings of 5 to 70 FPU/g cellulose and 30 CbU/g, respectively. ●5; ○10; ▼20; △30; ■40; □50; ◆60; ◇70 FPU g-1 cellulose
Figure 3 (a and b) shows the converted glucose concentration and enzymatic digestibility of pretreated Miscanthus at various biomass loadings (1 to 24% (w/v)) with 50 FPU/g of cellulose enzyme. A biomass loading of over 24% was impractical due to difficulties in stirring. In early enzymatic hydrolysis, enzymatic digestibility could not be analyzed due to the high viscosity of the biomass. The converted glucose concentration showed an upward trend, but enzymatic digestibility decreased with increased biomass loading. There was little difference in enzymatic digestibility (ca. 90%) when the biomass loading was greater than 10% (w/v) of the biomass concentration, whereas greater than 20% (w/v) biomass loading resulted in 80% enzymatic digestibility. One explanation is that the enzyme activity decreased in accordance with the increasing conversion of glucose concentration.

Fig. 3. Converted glucose concentration (a) and enzymatic digestibility (b) of pretreated Miscanthus at 1~24 % (w/v) biomass loading with cellulase complex and β-glucosidase enzyme loadings of 50 FPU/g cellulose and 30 CbU/g, respectively. ●1; ○5; ▼10; △15; ■17; □20; ◆22; ◇24 % biomass loading
Separate Hydrolysis and Fermentation (SHF) of Pretreated Miscanthus with S. cerevisiae
The fermentative potentials of the pretreated materials were evaluated using S. cerevisiae. The pretreatment and enzymatic hydrolysis conditions were applied according to the results of the RSM. To evaluate the ethanol concentration as a function of biomass loading (10 to 24% (w/v)), the pretreated biomass was mixed with the cellulase complex and β-glucosidase for 72 h at 50 °C. Fermentation was subsequently carried out for 48 h at 32 °C with inoculation of 7% S. cerevisiae. Sterilization was conducted before and after enzymatic hydrolysis to prevent contamination of the SHF process.
Figure 4 (a) shows the ethanol concentrations of the pretreated Miscanthus at various biomass loadings (10 to 24 % (w/v)) after enzymatic hydrolysis using 50 FPU/g cellulose before and after sterilization. As the biomass loading increased, the ethanol concentration accordingly increased. The final ethanol concentrations for biomass loadings of 10% and 20% were 27.01 and 49.30 g/L, respectively. However, the ethanol yields decreased upon increasing biomass loading. Ethanol yields were calculated by dividing the experimental ethanol concentration by the theoretical amount of ethanol produced by glucose conversion from pretreated biomass. When the biomass dosage was 10%, the ethanol yield was 80.73%, which is 1.3 times higher than that of the 20% biomass loading (61.40%). As previously mentioned, this indicates that enzyme activation was inhibited by the amount of converted glucose, which increased with increasing biomass loading.
Figure 4 (b) shows the results of the fermentation process carried out under the same conditions of (a), but without sterilization after enzymatic hydrolysis, to preserve enzyme activity. As a result, ethanol production increased considerably. Compared to the data of (a), the rates of increase in ethanol concentration were found to be 4.92% for 10% and 20.08% for 24% biomass loading, respectively. This suggests that the ethanol concentration was increased by additional enzymatic hydrolysis along with consumption of glucose by yeast during fermentation. These results are summarized in Table 6.

FIG. 4. Ethanol fermentation as a function of biomass loading (10~24% (w/v)), (a): Sterilization before and after enzymatic hydrolysis, (b): Sterilization before enzymatic hydrolysis. ○10; □15; △20; ∇22; ◇24 % biomass loading
Table 6. Converted Glucose Concentration after Enzymatic Hydrolysis, and Ethanol Production from Fermentation

Table 7. Overall Process for Bioethanol Production from Miscanthus

CONCLUSIONS
The overall process of Miscanthus pretreatment for production of bioethanol was examined in this study (Table 7). Pretreatment was essential to the production of ethanol from the lignocellulosic biomass, which was achieved through saccharification by breaking the tangled structure of cellulose, hemicellulose, and lignin so that the enzyme could easily permeate into the biomass. In this study, NaOH solution was used for pretreatment, and the optimal pretreatment and enzymatic hydrolysis conditions were determined through response surface methodology (RSM). The results reveal that the optimal temperature was 145.29°C with a reaction time of 28.97 min and a NaOH concentration of 1.49 M. After pretreatment, 50 FPU/g of cellulose of the cellulase complex and 30 CbU/g of β-glucosidase were added and mixed together at 150 rpm and 50 °C for 72 h. Following inoculation of S. cerevisiae, ethanol was produced after 48 h of fermentation at 32 °C and 150 rpm. The ethanol concentration was 59.20 g/L at a pretreated biomass loading of 20%, which is relatively higher than those of other lignocellulosic materials. Overall, the ethanol production process from Miscanthus using NaOH pretreatment was effective, and it may be feasible for the commercial production of bioethanol in the near future.
ACKNOWLEDGEMENTS
This study was financially supported by the Rural Development Administration (20100401-030-800-001-06-00).
REFERENCES CITED
Chang, V. S., and Holtzapple, M. T. (2000). “Fundamental factors affecting biomass enzymatic reactivity,” Appl. Biochem. Biotechnol. 84, 1-37.
Eitzinger, J., and Kossler, C. (2002). “Microclimatological characteristics of a Miscanthus (Miscanthus cv. giganteus) stand during stable conditionsat night in the nonvegetative winter period,” Theor. Appl. Climatol. 71, 245-257.
Gould, J. M. (1985). “Studies on the mechanism of alkaline peroxide delignification of agricultural residues,” Biotechnol. Bioeng. 27, 225-231.
Gouveia, I. C., Fiadeiro, J. M., and Queiroz, J. A. (2008). “Enzymatic removal of plant residues from wool: Application of experimental design techniques for optimization parameters,” Biochem. Eng. J. 4, 157-165.
Haaland, P. D. (1989). Design in Biotechnology, Marcel Dekker, Inc., New York, USA.
Hahn-Hagerdal, B., Galbe, M., Gorwa-Grauslund, M. F., Liden, G., and Zacchi, G. (2006). “Bio-ethanol – The fuel of tomorrow from the residues of today,” Trends Biotechnol. 24, 549-556.
Himken, M., Lammet, J., Neukirchen, D., Czypionka-Kause, U., and Olfs, H.-O. (1997). “Cultivation of Miscanthus under West European conditions: Seasonal changes in dry matter production, nutrient uptake and remobilization,” Plant Soil. 189, 117-126.
Hsu, T. A. (1996). “Pretreatment of biomass,” In: Wyman, C. E. (ed.), Handbook on Bioethanol: Production and Utilization, Taylor & Francis, Washington, DC, USA.
Kim, S. B., Um, B. H., and Park S. C. (2001). “Effect of pretreatment reagent and hydrogen peroxide on enzymatic hydrolysis of oak in percolation process,” Appl. Biochem. Biotechnol. 91, 81-94.
Kunamneni , A., and Singh, S. (2005). “Response surface optimization of enzymatic hydrolysis of maize starch for higher glucose production,” Biochem. Eng. J. 27, 179-190.
Lebo, S. E., Gargulak, J. D., and McNally, T. J. (2001). “Lignin,” in Kirk-Othmer Encyclopedia of Chemical Technology, Kroschwitz, J. I., and Howe-Grant, M. (eds.), John Wiley & Sons, New York, USA.
Lewandowski, I., Clifton-Brown, J. C., Andersson, B., Brasch, G., Chrsitian, D. G., Jørgensen, U., Jones, M. B., Riche, A. B., Schwarz, K. U., Tayebi, K., and Teixeira, F. (2003). “Environment and harvest time affects the combustion qualities of Miscanthus genotypes,” Agron. J. 95, 1274-1280.
Lu, X. B., Zhang, Y. M., Yang, J., and Liang, Y. (2007). “Enzymatic hydrolysis of corn stover after pretreatment with dilute sulfuric acid,” Chem. Eng. Technol. 30, 938-944.
Lynd, L. R. (1996). “Overview and evaluation of fuel ethanol from cellulosic biomass: Technology, economics, the environment, and policy,” Annu. Rev. Energy. Environ. 21, 403-465.
Marques, J., Vila-Real, H. J., Alfaia A. J., and Ribeiro, M. H. L. (2007). “Modelling of the high pressure-temperature effects on naringin hydrolysis based on response surface methodology,” Food Chem. 105, 504-510.
Martel, P., and Gould, J. M. (1990). “Cellulose stability and delignification after alkaline hydrogen-peroxide treatment of straw,” J. Appl. Poly. Sci. 39, 707-714.
Moiser, N., Wyman, C., Dale, B., Elander, R., Lee, Y. Y., Holtzapple, M., and Ladisch, M. (2005). “Features of promising technologies for pretreatment of lignocellulosic biomass,” Bioresour. Technol. 96, 673-686.
Montgomery, D. C. (2001). Design and Analysis of Experiments, 5th Ed., John Wiley & Sons, New York, USA.
National Renewable Energy Laboratory, “Standard biomass analytical procedures,” Available from: www.nrel.gov/biomass/analytical_procedures.html
Neely, W. C. (1984). “Factors affecting the pretreatment of biomass with gaseous ozone,” Biotechnol. Bioeng. 26, 59-65.
Rass-Hansen, J., Falsig, H., Jorgensen B., and Christensen C. H. (2007). “Bioethanol: Fuel or feedstock?,” J. Chem. Technol. Biotechnol. 82, 329-333.
Ribeiro, I. A. C., and Ribeiro, M. H. L. (2008). “Kinetic modelling of naringin hydrolysis using a bitter sweet alfa-rhamnopyranosidase immobilized in k-carrageenan,” J. Mol. Catal. B Enzymatic. 51, 10-18.
Schell, D. J., Farmer, J. J., Newman M., and McMillan, J. D. (2003). “Dilute-sulfuric acid pretreatment of corn stover in pilot-scale reactor: Investigation of yields, kinetics, and enzymatic digestibilities of solids,” Appl. Biochem. Biotechnol. 105, 69-85.
Sun, Y., and Cheng, J. J. (2002). “Hydrolysis of lignocellulosic materials for ethanol production: A review,” Bioresour. Technol. 83, 1-11.
Tengborg, C., Galbe M., and Zacchi, G. (2001). “Influence of enzyme loading and physical parameters on the enzymatic hydrolysis of steam-pretreated softwood,” Biotechnol. Prog.17, 110-117.
Theese, P. (1995). “Effects of pond size and consequent predator density on two species of tadpoles,” Oecologia 102, 371-376.
Torget, R., Walter, p., Himmel, M., and Grohmann, K. (1991). “Dilute-acid pretreatment of corn residues and short-rotation woody crops,” Appl. Biochem. Biotechnol. 28, 75-86.
Yang, B., and Wyman, C. E. (2004). “Effect of xylan and lignin removal by batch and flowthrough pretreatment on the enzymatic digestibility of corn stover cellulose,” Biotechnol. Bioeng. 86, 88-98.
Yang, B., Boussaid, A., Mansfield, S. D., Gregg D. J., and Saddler, J. N. (2002). “A fast and efficient alkaline peroxide treatment to enhance the enzymatic digestibility of steam exploded softwood substrates,” Biotechnol. Bioeng. 77(6), 678-684.
Zaldivar, J., Nielsen H., and Olsson L. (2001). “Fuel ethanol production from lignocellulose: A challenge for metabolic engineering and process integration,” Appl. Microbiol. Biotechnol. 56, 17-34.
Article submitted: February 17, 2011; Peer review complete: March 20, 2011; Revised version received and accepted: April 12, 2011; Published: April 18, 2011.