
Abstract
Comparison of industrial and laboratory pulps from Pinus radiata showed higher energy requirement and lower tear index at the same tensile strength in the case of industrial pulps. Chemical differences between pulps were negligible and cannot explain the strength differences observed. Morphology of the fibers changed during processing with an increase in kinks and curls for industrial pulps. Increased twists and wrinkling in mill fibers were observed based on scanning electron microscopy images. Results from water retention value and fiber saturation point measurements showed reduced water holding ability of industrial fibers. Simons’ stain and hydrogen nuclear magnetic resonance confirmed a higher proportion of macropores in the fibers of industrial compared to laboratory pulps. Evidence supports the presence of both micropore closure and creation of new mesopores and macropores during industrial processing. A combination of fiber damages, porosity changes, and induced deformations seems to play the main role in the lower strength properties of industrial pulps when compared to laboratory pulps.
Download PDF
Full Article
Changes in Cell Wall Structure during Kraft Processing of Pinus radiata
Olli P. Joutsimo* and Dante Giacomozzi**
Comparison of industrial and laboratory pulps from Pinus radiatashowed higher energy requirement and lower tear index at the same tensile strength in the case of industrial pulps. Chemical differences between pulps were negligible and cannot explain the strength differences observed. Morphology of the fibers changed during processing with an increase in kinks and curls for industrial pulps. Increased twists and wrinkling in mill fibers were observed based on scanning electron microscopy images. Results from water retention value and fiber saturation point measurements showed reduced water holding ability of industrial fibers. Simons’ stain and hydrogen nuclear magnetic resonance confirmed a higher proportion of macropores in the fibers of industrial compared to laboratory pulps. Evidence supports the presence of both micropore closure and creation of new mesopores and macropores during industrial processing. A combination of fiber damages, porosity changes, and induced deformations seems to play the main role in the lower strength properties of industrial pulps when compared to laboratory pulps.
Keywords: Strength deliver; Hornification; Porosity; Refinability; Tensile index
**Contact information: Bioforest S.A., Área Celulosa, Celulosa Arauco y Constitución S.A., Coronel, Región del Bio-Bio, Chile; *Corresponding autor: ojoutsimo@gmail.com
INTRODUCTION
The main objective of kraft process is the chemical degradation and removal of components from the wood matrix, mainly lignin and extractives. Furthermore, hemicelluloses and cellulose are also partially degraded and removed during processing, modifying the whole chemistry and structure of the fibers (Johansson 2008). The removal of components develops an inner porous structure in the cell wall (Stone and Scallan 1965, 1968; Allan et al. 1991; Andreasson et al. 2003) and affects surface and bulk chemical composition, shape, strength, swelling behavior and water holding ability, among other properties of the fibers (De Ruvo and Htun 1983; Andreasson et al. 2003).
In addition, process conditions such as high alkalinity, temperature, and mechanical forces or a combination of those, can create non-homogeneous zones such as deformations and damage points in the fiber wall. Depending on the extent and type of damage, these points will affect the capacity of the fibers to carry and/or distribute load in a web, reducing the final strength of paper sheets (MacLeod 1987; Cyr et al. 1989; Hakanen and Hartler 1995; Joutsimo 2004; Seth 2006; Brännvall 2007). Examples of non-homogeneous zones are presented in Fig. 1, and include dislocations, microcompressions, twists, kinks, and curls (MacLeod 1987; Hakanen and Hartler 1995; Seth 2006; Rauvanto et al. 2006; Rauvanto 2010).
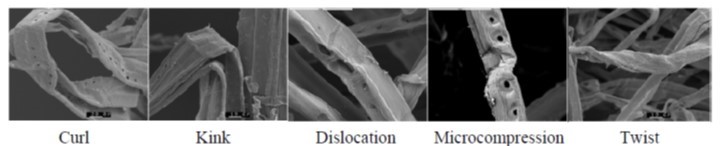
Fig. 1. Defects and failure zones in pulp fibers (Rauvanto 2010)
Salmén and Hornatowska (2014) compared fibre deformations from mill like conditions and laboratory pulps for softwood. According to Salmén, damages resulting from mechanical deformation of fibers can be divided into two types:
- Changes in the fibre shape that mainly affect the water retaining capacity and sheet density, reducing the number of bonding sites, and thus, strength properties. Wet zero-span strength is not affected.
- Local structural damages of the fibers, that leads to lower fiber strength. Main observable changes are lower wet zero-span and lower tear at a given tensile index.
Furthermore, Joutsimo (2004) reported that pulps mechanically treated together with high temperature and pH, showed no increase in defects but a decrease in the measured fiber strength by 20% as zero span or by 40% as tear index at 70 Nm/g of tensile index. Water retention was also reduced after mechanical treatment. The strength reduction could not be fully explained by changes in shape, as fiber shortening, by differences in carbohydrate composition, nor by cellulose degradation. According to the author, upon processing, a loosening of the macrofibril structures and layer delamination is produced. This loosening could enhance surface irregularities and reduce the bonding area. The fiber strength decreased due to fewer bonding sites between parts of the cell wall due to mechanical forces.
Damaged points created upon processing of the fibers can be observed as an increase in measured kinks and curl in both brownstock and bleached pulps (Hakanen et al. 1995; Seth 2006). Whether the damaged point will finally affect the strength of the fibers will depend on the extension of the damage and the subsequent processing. In the case of cell wall delamination, it cannot be measured as an increase in curls and kinks, being necessary to use techniques as 1H and 2H-NMR and Simons’ stain to study changes in cell wall porosity (Meng et al. 2013).
According to Brännvall and Lindström (2006), another factor to consider is the chemical composition at the surface of the fibers. Brännvall studied the chemical and structural differences between industrially produced pulps compared to laboratory-cooked pulps. Results indicate that a significant part of pulp strength reduction could not be attributed to changes in morphology (evaluated as curls and kinks) or strength of individual fibers (evaluated as zero span). Instead of that, Brännvall hypothesizes that the lower strength of the industrial pulps seems to be related to weaker fibre-fibre joints, caused by adsorption of more degraded hemicelluloses onto the surface of the fibers. Furthermore, studies by Brännvall et al. (2007) showed that bleached pulps with less xylan content have less resistance to mechanical treatment, with lower tensile, tear strength, and wet zero span values.
EXPERIMENTAL
Industrial and laboratory-made brownstock and bleached pulps from Pinus radiata were compared to determine differences in chemistry, structure, water holding ability, and other properties to elucidate the reasons for strength differences between them. Additionally, holocellulose pulps were prepared based on chips used for industrial production of bleached kraft pulps to evaluate changes in fiber structure after lignin dissolution and removal.
Materials
Industrial pulps were obtained from a Pinus radiata kraft mill in southern Chile. Samples were taken from different points of the process: digester discharge, after oxygen delignification, and after bleaching. Laboratory pulps were obtained in a batch digester (Georgia Tech) using industrial chips from the mill. In every stage additional laboratory holocellulose pulps were obtained to study cell wall structure after lignin removal.
Methods
Pinus radiata chips and pulps were analyzed to determine changes in chemistry and structure along the fiberline. Chemical characterization includes carbohydrate content analysis by HPLC. Structural characterization considered the strength, optical, morphological properties and porous structure by solute exclusion technique and nuclear magnetic resonance. Image analysis was done using Scanning Electron Microscope (SEM).
Wood chip sample characterization
A total of 25 kg wet Pinus radiata chips were obtained from the feeding system to continuous digester at a kraft mill in southern Chile. After sampling, chips were screened according to SCAN CM 40:94 in Bioforest facilities, Chile.
Laboratory kraft cooking
The cooks were based on compact cooking configuration using 3 M/K Systems laboratory digesters, 10 liter each, with liquor recirculation and indirect electric heating (Georgia Tech, USA). One digester was designated as the digestion vessel, and two digesters were used for heating the liquors. The cooking liquors were prepared in accordance to the industrial conditions using stock liquors of sodium sulfide and sodium hydroxide. Sulphidity and alkalinity of white liquor were 35% and 123.5 g/L EA as NaOH. Previous to cooking, chips were steamed 5 min at 3 bar. Impregnation time was 30 min using 103 ºC, 7% alkali charge, and 6:1 L:W ratio. Transfer circulation was performed at 117 ºC, L:W ratio 5:1, and 13 g/L EA consumption. Cooking was done at 145 ºC, 13% EA, L:W ratio 4:1, and kappa target 28. After cooking, the cooked chips were transferred to a basket where it was well soaked in water (approx. 20 L) and washed overnight. After slow disintegration and hand homogenization, the pulp slurry (10% consistency) was stored in a cold room until used.
Oxygen delignification
Oxygen delignification was performed in a Parr reactor at Georgia Tech, USA. The conditions were pulp consistency 10%, NaOH 3%, 96 ºC, O2 pressure 10 bar, and 70 min. The oxygen pulp was thoroughly washed until the effluent was pH neutral. The O2delignified pulp was used for preparing holocellulose pulp and analyzing fiber properties.
Holocellulose pulp preparation of mill pulps
Holocellulose pulps were prepared from mill brownstock and oxygen delignified pulp samples as described by Hubbell et al. (2010). This procedure allowed the selective removal of lignin without affecting to a great extent the structure of the cell wall. 100 g of pulp (o.d. basis) were suspended in deionized water (3% consistency) and reacted with sodium chlorite (0.67 g/g pulp) and 60 mL of acetic acid (0.67mL/g pulp) at 70 ºC in a sealed bag. At two-hour intervals, additional charges of sodium chlorite solution were added to the reaction. At the end of six hours, the reaction was cooled and filtered using a glass filter. The resulting holopulps were thoroughly washed with deionized water. After washing, the holopulps were characterized for Klason lignin content.
Pulp characterization
The pulps were analyzed for TAPPI brightness, viscosity, and strength properties at Paper Testing Lab, IPST, Georgia Tech, USA. TAPPI brightness was measured using a Brightmeter Micro S-5, from Technidyne Corp. Two handsheets were prepared for optical test according to TAPPI standard method T272 sp-08. The viscosity of the pulps was measured using cupriethylenediamine (CED) solution according to TAPPI T230om – 08. Bleached pulps were refined in a PFI mill, and strength, optical, and morphological properties evaluated from the resulting handsheets. The water retention value (WRV) was measured according to ISO/FDIS 23714. Morphology (fiber length, coarseness, curls, kinks, etc.), was evaluated using an Op Fiber Quality Analyzer (FQA).
Carbohydrate content was determined using the filtrate from acid hydrolysis and high pressure liquid chromatography. Hydrolysis of polysaccharides was done according to TAPPI T249cm-09. Carbohydrate analysis was done by HPLC using high performance anion exchange chromatography with pulsed amperometric detection (HPAEC-PAD) in a Dionex ICS-3000 ion chromatography with CarboPactm PA-1 column.
Cell wall porosity measurements
Porosity measurements were done based on fibre saturation point (FSP), nuclear magnetic resonance (1H and 2H NMR), and Simons’ stain methods at Georgia Tech, USA.
The solute exclusion method using dextrans of molecular weight 2×10⁶ Daltons was used to determine the FSP values of the pulps. This method has the advantage that the fibers can be maintained in a water-swollen state during the measurement. This means that the pore closure resulting from the different drying methods can be avoided. According to Stone and Scallan (1965), macropores are defined as a family of large cell wall pores (greater than 1000 nm in diameter), which do not collapse upon solvent exchange drying. The smaller pores, which are detected by differential scanning calorimetry (DSC), are referred to by Maloney (2000) as micropores. The micropores hold two fractions of water: non-freezing water (NFW) and freezing bound water (FBW) (Maloney 2000). The FSP is the sum of NFW, FBW, and water in the macropores. The procedure implemented is a modification of Stone and Scallan’s method, developed by Luukko and Maloney (1999).
An NMR relaxation technique was used to determine pore properties of pulp, based on Andreasson et al. (2005). All pulp samples were soaked with deionized water overnight. Saturated pulp samples were recovered by filtration and then conditioned to desired moisture content in a sealed desiccator at 25 ºC and for 14 days. The wet pulp fiber (moisture content 27.6-34.2%) was then placed in 10 mm NMR tubes, which were sealed to prevent water evaporation. 1H spin-spin (T2) and 2H spin-lattice (T1) NMR measurements were carried out on a Bruker DSX-400 spectrometer operating at frequencies of 400.13 MHz for 1H in a Bruker microimaging probe. The spin-spin relaxation times were determined using a standard 2D Carr-Purcell-Meiboom-Gill (CPMG) sequence with a 5 μs (90°) 1H pulse, 10 μs (180°) 1H pulses, 16 scans, 10 s recycle delay, and Δ = 0.0002 s. The spin-lattice experiments were determined using a standard saturation recovery experiment utilized a 5 μs (90°) 1H pulse, 16 scans, 10 s recycle delay, 0.25 s delay in saturation pulse train, and 32 pulses in saturation pulse train.
Simons’ stain technique is based on the use of two dyes, blue and orange, which are adsorbed in pores of the cell wall. Adsorption of one or the other will depend on quantity, size, and accessibility of pores in the cell wall. The method used was a modification of the original, developed by Chandra et al. (2008). Measurements were done based on 600 mg (od) pulp, 100 mg into each of a set of 6 Corning polypropyrene centrifuge tubes. To each tube was added 1.00 mL of PBS (phosphate buffered saline solution, pH 6.8). Different amounts of 10.00 g/L concentration of dye solution, ranging from 0.25 to 2.00 mL, were added to each tube. The tubes were incubated at 60 °C with shaking at 200 rpm. After 6 h incubation, the tubes were centrifuged at 10,000 rpm for 5 min. The supernatant dye solution was measured by a UV–Vis spectrophotometer. The amounts of adsorptions of orange and blue dyes by the pulp pores can be calculated from the initial amounts of dye applied and the amounts measured in the supernatant solution.
Image analysis
SEM images were obtained to explore the change of surface structures between lab and mill pulp samples. All pulp samples for SEM analysis were prepared based on a solvent exchange method (Foston and Ragauskas 2010), which showed minimal pore collapse upon drying. Wet pulp fibers were dehydrated using a series of gradient acetone-water solvent systems. The extracted pulp was exchanged via a gradient cyclohexane-acetone series. The pulp suspension in the cyclohexane was frozen and then freeze-dried overnight at room temperature. Samples were examined using a LEO 1530 scanning electron microscope to obtain images at 200, 2,000, and 20,000 magnifications.
RESULTS AND DISCUSSION
In this section, changes in chemical composition, cell wall porosity, fiber strength, morphology, and water holding ability at the different stages of the process are presented. As a definition, during discussion of results, the pores are divided based on its diameter in: macropores (up to 1,000 nm), mesopores (10-1,000 nm), and micropores (0.1-10 nm).
Chemical Characterization of Wood and Pulps
Carbohydrate content (Janson 1974) in pulps (Fig. 2 and Fig. 3) showed similar chemical composition between laboratory and industrial pulps. The only differences were mannose and uronic acids content. In the case of arabinose, there was a difference, but it is not considered because the value is close to the detection limit of the technique (0.3%).

Fig. 2. Carbohydrate content for brown industrial and laboratory Pinus radiata pulps

Fig. 3. Carbohydrate content for delignified industrial and laboratory Pinus radiata pulps
Based on carbohydrate composition, no substantial differences were observed between laboratory and industrial pulps.
Klason Lignin, Viscosity, and TAPPI Brightness
Klason lignin content, dynamic viscosity, and TAPPI brightness were also evaluated for the mill and lab pulps and are presented in Table 1.
Table 1. Results for Lignin Content, Viscosity and TAPPI Brightness


Fiber Morphology
The morphology analysis showed a reduction in fiber length (measured as length weighted average) and an increase in kinks and curls (Page et al. 1985) from cooking to bleached pulp (Figs. 4 to 6), which is in agreement with Joutsimo (2004), Seth (2006), and Rauvanto (2010). Process areas for which the changes in fiber morphology were more significant were the digester, washing (press section), and oxygen delignification, which is in line with previous studies of MacLeod (1987) and Hakanen and Hartler (1995).

Fig. 4. Fiber length comparison between industrial and laboratory pulps

Fig. 5. Curl comparison between industrial and laboratory pulps

Fig. 6. Kink index comparison between industrial and laboratory pulps
When comparing industrial and laboratory pulps, the laboratory samples showed higher fiber length and lower curl and kink indices, indicating that lab fibers were straighter and had fewer deformations when compared to industrial fibers. If these deformations will finally affect the paper strength, it will depend on the type and extent of the damage. It is known that during refining some deformations are straightened, but other ones generate a weak point in the cell wall structure, thus reducing the strength of the individual fibers, as it is described by Salmén et al. (2014).
The shortening of the fibers in lab pulps between brownstock and oxygen bleached is probably an artifact caused by the increase in kinks and curls. This change in morphology after oxygen delignification has been described by Rauvanto and Henricson (2009) as due to damage on the fiber structure due to a combination of oxygen stage and machinery.
Water Holding Ability
The water holding ability of fibers depends on chemical composition of the fibers (hemicellulose content), fiber charge, porosity of the cell wall, and delignification degree, among other factors. Changes in water holding ability were studied based on water retention value and fiber saturation point measurements.

Fig. 7. Water retention values for industrial and laboratory radiata pine pulps
Measured WRV values (Fig. 7) showed less than 5% of variation along the process. These values were within the range of error of the method. Industrial pulps in all the stages of the process presented 20% lower values compared to laboratory pulps. Fiber saturation point measurements (Fig. 8) were done using the solute exclusion technique using 2×10⁶ molecular weight dextran, equivalent to 56 nm in hydrodynamic diameter of the dextran. Therefore, pores with openings less than 56 nm will be detected (Stone and Scallan 1968).

Fig. 8. Fiber saturation point for industrial and laboratory radiata pine pulps
Fiber saturation point measurements can be related to the total pore volume in the cell wall and the characteristics of those pores. In general, no differences were observed between the stages of the process, both in industrial or laboratory pulps, which is consistent with WRV measurements. When comparing both types of pulps, laboratory pulps had 15% higher FSP values than industrial pulps. Based on the results there are at least two possible explanations for the observed difference in FSP:
- Industrial pulps have less total volume of pores compared to the laboratory pulps.
- In the case of industrial pulps, new pores are created during processing, pores that are out of the range of size measured by FSP technique.
Both explanations are consistent with the WRV values observed (Fig. 10). An explanation for the reduction in WRV and FSP values is that some of the pores close irreversibly during processing. Another possibility is that new mesopores (10 to 1,000 nm in diameter) and macropores (>1,000 nm in diameter) are created due to delamination of the cell wall, as it was suggested by Joutsimo (2004). These new pores are not able to hold the water inside them when a sample is under centrifugation, thus reducing the whole WRV value measured. To elucidate if new pores are created during processing, different techniques must be applied.
Changes in Fiber Porosity
Simons’ stain
According to Yu et al. (1995), high values for O:B ratio (Orange to Blue dye) are related to a higher proportion of big pores than smaller pores, and a low O:B ratio indicates the opposite. Values for O:B ratio increased between cooking and oxygen delignification, which is consistent with the fact that some components are being removed from the cell wall, leaving open spaces or “micropores” between fibrils.

Fig. 9. Simons’ stain results Fig. 10. Simons’ stain results for
for Pinus radiata brown pulp Pinus radiata oxygen delignified
pulps
As presented in Figs. 9 and 10, O:B values were lower for laboratory pulps, which is an indication of a higher proportion of smaller pores in the cell wall. On the contrary, the O:B ratio was higher in mill pulps, indicating a higher proportion of bigger pores. Simons’ stain results suggested that new mesopores and macropores were created during processing of mill pulps. This is consistent to WRV values observed in Fig. 7, because smaller pores of lab pulps can hold water more effectively than bigger pores, giving higher WRV values compared to mill pulps.
1H and 2H NMR
Results of 1H and 2H NMR studies are presented in Figs. 11 and 12. Based on the literature (Li et al. 1993; Foston et al. 2010) the first peak likely corresponds to water within the mesopores of the fiber and the second one is due to capillary water. According to Foston et al. (2010), at least three peaks can be found in spin-spin experiments:
- The first peak around 2 ms is related to water on and between cellulose fibrils (fast relaxation times suggest that it is a “confined” water or bound water). This could be related to water in micropores (1 nm or less).
- The second peak around 20 ms can be related to water in the voids of hemicellulose-lignin matrix encasing the cellulose bundles. This could be related to micro and mesopores.
- The third peak at 60 ms can be related to free water in lumens and fiber capillaries. It can be related to mesopores until 20 nm (detection limit for this technique)
Results from 1H-NMR (Fig. 11) show that the lab pulps usually exhibited 2 peaks, except for the lab brown stock holopulp. However, the mill pulps appeared to have 3 peaks, and the third peak was shifted to long relaxation time. This is likely due to the existence of new-bigger pores created due to mechanical stress during pulping process. Water behaves in these pores in a similar way as free water in lumens and capillaries. A similar shift was observed for mill O2holopulp, exhibiting slight shifts for mill brownstock holopulp when compared to the corresponding laboratory samples. It can be expected that mechanical stress will promote the joining of adjacent micropores. As a result, larger pores could be formed for mill pulps. However, lab O2 pulp appears to have similar shift with the corresponding mill pulp. This is likely due to slightly different moisture content of the pulp.

Fig. 11. Distribution of spin-spin relaxation times of lab and mill pulps in 1H-NMR experiments determined using a standard 2D Carr-Purcell-Meiboom-Gill (CPMG) sequence
The difference in pore size distribution between lab and mill pulps was determined using 2H NMR techniques (Fig. 12). The shift of peaks was not clear between lab and mill pulp samples. However, pore size distributions of mill pulps became broadened as compared to those of lab pulps.
It can be assumed that more mechanical stress to mill pulp may increase the fraction of pores due to delamination of cell wall. This might lead the pore size distribution to broaden in the fiber cell wall.

Fig. 12. Distribution of spin-lattice relaxation times of lab and mill pulps produced via Inverse Laplace Transforms (ILT, Matlab 7.13 program) of saturation recovery T1 experiments
Simons’ stain and H-NMR results confirmed that industrial pulps had bigger pores than lab pulps but with less water holding ability based on WRV measurements. These results support the theory that cell wall structure of laboratory pulps is in better condition and less “loose” compared to industrial pulps; this is a result previously presented by Joutsimo (2004).
Analysis of SEM Images
Some deformations of the fiber in the production process can be measured as kinks, curls, twists, roughness, and compressions in the cell wall (Joutsimo 2004; Seth 2006; Rauvanto et al. 2006; Rauvanto 2010). SEM images (Figs. 13 and 14) show these kinds of deformations produced on the fibers between cooking and bleaching stages.

Fig. 13. SEM images of laboratory and mill brownstock pulps from radiata pine

Lab brownstock holopulp (top) and Mill brownstock holopulp (bottom)
Magnification 200x (left); 2.000X (middle); 20.000X (right)
Fig. 14. SEM images for laboratory and industrial holocellulose pulps from radiata pine
SEM images show straighter fibers in laboratory pulps compared to industrial pulps. Surface of industrial pulps were more rugged, and this characteristic became more visible after bleaching. Kinks and curls were more visible in industrial ECF pulps (Fig. 15). Both are indicators of changes produced in pulps along the process.

Mill ECF Pulp
Magnification 200x (left); 2.000X (middle); 20.000X (right)
Fig. 15. SEM images of mill ECF bleached pulps
Strength Properties
Strength properties evaluated were tensile index, tear index, burst index, and TEA. According to the expected, refining developed strength, increasing tensile, and burst index for all the pulps evaluated (Figs. 16 and 17).
Pulps from cooking presented the best strength properties, both unrefined and refined between zero and 4,000 PFI revolutions when compared to delignified and bleached pulps. Industrial cooking was shown to be the main point where tensile and tear strength is lost. Unrefined tensile index of unbleached mill pulp compared to laboratory brown pulp at the same kappa presented 33% decrease in tensile index (Fig. 16). Between delignification and bleaching, another 33% was lost (Fig. 16). Based on the changes in the fiber deformation and cell wall structure (Figs. 4-15) the reasons for the strength loss are related to the changes in shape and cell wall structure imparted to the fibers during the processing.

Fig. 16. Tensile index development after refining in the range of 0-4000 PFI revolutions

Fig. 17. Burst index development after refining in the range of 0-4000 PFI revolutions
The tear index behaved as expected, with high values for tear in unrefined pulps that are reduced during refining (Fig. 18). Higher tear index values are presented in ECF bleached pulps compared to brownstock pulps.
When comparing tear-tensile pair (Fig. 19), the tear index for laboratory brownpulps was 64% higher than the industrial pulps at a tensile index of 70 Nm/g. Moreover, industrial brownstock pulps required 4 times more refining energy than laboratory pulps to a tensile index of 70 Nm/g.


Fig. 19. Tear-Tensile pair for brownstock industrial and laboratory pulps
Fig. 18. Tear index for radiata pine pulps in different stages of the process
Results from tensile energy absorption (TEA) are presented in Fig. 20. Values for TEA present similar results than tensile index, with higher values for lab pulps in all the range of PFI revolutions. It is interesting to note that TEA loss was more pronounced in lab O2holopulp than in industrial pulp, which may be interpreted as the fibers are very susceptible to damage even under more careful processing conditions like those applied in laboratory. Studies done by Rauvanto et al. (2009) showed that pulp strength properties experienced similar decreases in both laboratory and industrial delignification, which indicates that the modification in pulp strength is due to chemical modification of the fibre cell wall structure. According to the author, strength reduction of pulps treated with oxygen is unavoidable even with the gentlest possible mechanical treatment conditions.

Fig. 20. TEA after refining in the range of 0-4000 PFI revolutions
In summary, structural changes were deeper in industrial pulps compared to laboratory pulps. The lower strength properties and water-holding capacity of industrial pulps seems to have at least two structural causes: An increase in fiber deformations and damages due to processing, affecting both fiber shape and strength of individual fibers, and changes in porous structure of the cell wall, with cell wall delamination and increase in mesopores and macropores.
Studies by Salmén et al. (2014) concluded that two mechanisms can be related to strength loss: fibre damage and changes in transverse fibre shape. The present results agree with fibre damage, but differ in the transverse fibre shape as one of the main mechanisms. According to Salmén, the change in the transverse fibre shape is produced by collapse of the fibre, reducing the lumen area, and leading to pulps with lower water retaining capacity, lower density, and higher drainability. However, if there is no increase in fiber deformations (measured as curls and kinks), lumen collapse might produce more dense papers, with less drainability compared to laboratory pulps, which is not the case. Our hypothesis is that, besides lumen collapse, the main structural change in fibers from industrial pulps is associated to cell wall delamination, leading to less water holding ability, lower conformability, density, strength; and higher drainability of industrial pulps compared to laboratory-produced pulps.
Thus, the higher strength loss observed for industrial pulps is a result of:
- the reduction in the number of bonding sites due to structural changes (deformations, cell wall delamination)
- lower strength of the individual fibers due to damages induced to the fibers during processing
Chemical factors such as hemicellulose quality at the surface of the fibers, among others, are not discarded and of course can contribute to the overall strength loss observed, but were not the scope of the present study.
CONCLUSIONS
- Paper test sheets made from industrial pulps presented higher energy requirement and lower tear index at the same tensile strength compared to laboratory pulps.
- Chemical differences between laboratory and industrial pulps were negligible and could not explain the strength difference observed.
- Mill processing induced more changes in fiber morphology than laboratory processing, with an increase of kinks, curls and wrinkling in the surface of the fibers. Based on its extent, these deformations can create failure points in the cell wall, explaining part of the strength loss observed.
- Mill pulps showed lower water holding ability when compared to laboratory pulps, which can be produced by: micropore closure, creation of new mesopores and macropores due to delamination, or a combination of both.
- Porosity measurements (1H and 2H NMR and Simons’ stain) confirmed higher amount of big pores in mill pulps compared to laboratory pulps, which supported the hypothesis that some delamination occurred in the cell wall during processing.
- Induced damage points, fiber deformations and porosity changes occurred during processing are taught to be responsible for most of the observed strength loss when industrial and laboratory pulps from softwood are compared.
ACKNOWLEDGEMENTS
The authors wish to express their gratitude to Celulosa Arauco y Constitución S.A. and Bioforest S.A. for financial support in the development of this study.
REFERENCES CITED
Allan, G. G., Ko, Y., and Ritzenthaler, T. (1991). “The microporosity of pulp. The nature of the pore size distribution,” Tappi J. 74(3), 205-212.
Andreasson, B., Forsström, J., and Wågberg, L. (2003). “The porous structure of pulp fibres with different yields and its influence on paper strength,” Cellulose 10, 111-123. DOI: 10.1023/A:1024055406619
Andreasson, B., Forsstroem, J., and Wågberg, L. (2005). “Determination of fibre pore structure: Influence of salt, pH and conventional wet strength resins,” Cellulose 12(3), 253-265. DOI: 10.1007/s10570-004-5837-6
Brännvall, E., and Lindström, M. (2006). “A study on the difference in tensile strength between industrially and laboratory-cooked pulp,” Nordic Pulp and Paper Research Journal 21(2), 222-226. DOI: 10.3183/NPPRJ-2006-21-02-p222-226
Brännvall, E. (2007). “Aspects on strength delivery and higher utilization of the strength potential of softwood kraft pulp fibres,” Doctoral Thesis. Department of fibre and polymer technology. School of chemical science and engineering, KTH, Royal Institute of technology, Stockholm, Sweden.
Brännvall, E., and Lindström, M. (2007). “The hemicellulose composition of pulp fibers and their ability to endure mechanical treatment,” Tappi Journal 6(10), 19-24.
Chandra, R. P., Esteghlalian, A. R., and Saddler, J. N. (2008). “The characterization of pretreated lignocellulosic substrates prior to enzymatic hydrolysis, Part I. A modified Simons` staining technique,” Biotechnol. Prog. 24, 1178-1185. DOI: 10.1002/btpr.33
Cyr, M. E., Embley, D. F., and MacLeod, J. M. (1989). “Stronger kraft softwood pulp – achieved!,” Tappi Journal 72(10), 157-163.
De Ruvo, A., and Htun, M. (1983). “Fundamental and practical aspects of papermaking with recycled fibers,” in: The Role of Fundamental Research in Papermaking, Mechanical Engineering Pub. Ltd., London, Vol. 1, 195-225.Foston, M., and Ragauskas, A. (2010) “Changes in the structure of the cellulose fiber wall during dilute acid pretreatment in Populus studied by 1H and 2H NMR,” Energy Fuels 24, 5677-5685. DOI: 10.1021/ef100882t
Hakanen, A. and Hartler, N. (1995), “Fiber deformations and strength potential of the kraft pulps,” Paperi ja Puu 77(5), 339-344
Hubbell, C. A., and Ragauskas, A. J. (2010). “Effect of acid-chlorite delignification on cellulose degree of polymerization,” Bioresource Technology 101, 7410-7415. DOI: 10.1016/j.biotech.2010.04.029
Janson, J. (1974). “Analytik der polysaccharide in Holz und Zellstoff,” Faserforschung und Textiltechnik 25(9), 375-382.
Johansson, D. (2008). “Carbohydrate degradation and dissolution during kraft cooking,” Licenciate thesis. Karlstad University Studies 2008:12. Karlstad, Sweden.
Joutsimo, O. (2004). “Effect of mechanical treatment on softwood kraft fiber properties,” Dissertation for the degree of Doctor of Science in Technology, Department of Forest Products Technology, Helsinki University of Technology (Espoo, Finland,).
Li, T.-Q., and Henriksson, U. (1993). “Determination of pore sizes in wood cellulose fibers by 2H and 1H NMR,” Nordic Pulp and Paper Research Journal 8(3), 326-330. DOI: 10.3183/NPPRJ-1993-08-03-p326-330Luukko, K., and Maloney, T. C. (1999). “Swelling of mechanical pulp fines,” Cellulose 6(2), 123-136. DOI: 10.1023/A:1009256307149
MacLeod, J. M. (1987). “The strength potential of unbleached kraft pulps,” Pulp & Paper Canada, 88(9), 103-107.
Maloney, T. (2000). “On the Pore Structure and Dewatering Properties of the Pulp Fiber Cell Wall,” Acta Polytechnica Scandinavica, Chemical Technology Series N°27.
Meng, X., Foston, M., Leisen, J., DeMartini, J., Wyman, Ch., and Ragauskas, A. (2013). “Determination of porosity of lignocellulosic biomass before and after pretreatment by using Simons’ stain and NMR techniques,” Bioresource Technology 144, 467-476. DOI: 10.1016/j.biortech.2013.06.091
Page, D. H., Seth, R. S., Jordan, B. D., Barbe, M. C. (1985) “Curl, crimps, kinks and microcompressions in pulp fibres—their origin, measurement and significance,” Papermaking Raw Materials: Transactions of the 8th Fundamental Research Symposium, Mechanical Engineering Publications, London. 183-227.
Rauvanto, I., Passas, R., and Henricson, K. (2006). “Fiber damage in unbleached reinforcement pulp. The phenomena in industrial softwood kraft pulps,” Paperi ja Puu 88(4), 239-246.
Rauvanto, I., and Henricson, K. (2009). “Fibre damage in oxygen delignification: Mechanical and chemical interactions,” Journal of Pulp and Paper Science 35(1), 34-38.
Rauvanto, I. (2010). “The intrinsic mechanisms of softwood fiber damage in brown stock fiber line unit operations,” Thesis for the degree of Doctor of Science (Technology). Acta Universitatis Lappeenrantaensis 385. Lappeenranta University of Technology, Lappeenranta, Finland.
Salmén, L., and Hornatowska, J. (2014) “A comparison of fibre deformations from mill like and laboratory kraft cooking of softwood,” Nordic Pulp and Paper and Research Journal 29(2), 211-217. DOI: 10.3183/NPPRJ-2014-29-02-p211-217
Seth, R. S. (2006) “The importance of fibre straightness for pulp strength,” Pulp and Paper Canada 107(1), 34-42.
Stone, J. E., and Scallan, A. M. (1965). “Influence of drying on the pore structures of the cell wall. Consolidation of the paper web,” Transactions of the 3rd Fundamental Research Symposium held at Cambridge, 145-167.
Stone, J. E., and Scallan, A. M. (1968). “The effect of component removal upon the porous structure of the cell wall of wood. Part III. A comparison between the sulphite and kraft processes,” Pulp Paper Magazine Canada 69, 288-293.
Yu, X, Minor, J. L., and Atalla, R. H. (1995). “Mechanism of action of Simons’ stain,” Tappi J. 78(6), 175-180.
Article submitted: December 10, 2014; Peer review completed: January 29, 2015; Revised version received and accepted: February 23, 2015; Published: March 2, 2015.
DOI: 10.15376/biores.10.2.2461-2478