
Abstract
Atmospheric liquefaction technology has been used widely and is an effective way of biomass component utilization. In this paper, the liquefied products obtained from corn stalk using polyhydric alcohols 1,2-propanediol (PG) mixed diethylene glycol (DEG) through acid catalysis under atmosphere pressure were characterized by various analytical technologies. The results indicated that 39 kinds of organic compounds were present in bio-oil, among which alcohols were the most, phenols were the second, and their relative contents were 70.7% and 25.6%, respectively. There were also some organic acids, ethers, esters, and ketones. More than 80% of these compounds had a carbon number less than 25. Carbon nuclear magnetic resonance spectra (13C-NMR) showed that different chemical shifts (ppm) corresponded to various carbon types. The chemical composition of the residue from liquefaction was complex and contained a certain amount of large molecular substances that were difficult to degrade. It required more severe pyrolysis conditions than those of corn stalk. Results from X-Ray Diffraction (XRD) indicated the destruction of crystalline structure of carbohydrates and the cellulose molecules were cracked, indicating that the cellulose was degraded and the degree of liquefaction was high.
Download PDF
Full Article
Characterization of Liquefied Products from Corn Stalk in the Presence of Polyhydric Alcohols with Acid Catalysis
Yan Zhang,a,b,* Huile Wang,a Huifang Zhao,a Zhong Liu,b Jingjun Huang,a Yujie Yang,a and Yu Chen a
Atmospheric liquefaction technology has been used widely and is an effective way of biomass component utilization. In this paper, the liquefied products obtained from corn stalk using polyhydric alcohols 1,2-propanediol (PG) mixed diethylene glycol (DEG) through acid catalysis under atmosphere pressure were characterized by various analytical technologies. The results indicated that 39 kinds of organic compounds were present in bio-oil, among which alcohols were the most, phenols were the second, and their relative contents were 70.7% and 25.6%, respectively. There were also some organic acids, ethers, esters, and ketones. More than 80% of these compounds had a carbon number less than 25. Carbon nuclear magnetic resonance spectra (13C-NMR) showed that different chemical shifts δ (ppm) corresponded to various carbon types. The chemical composition of the residue from liquefaction was complex and contained a certain amount of large molecular substances that were difficult to degrade. It required more severe pyrolysis conditions than those of corn stalk. Results from X-Ray Diffraction (XRD) indicated the destruction of crystalline structure of carbohydrates and the cellulose molecules were cracked, indicating that the cellulose was degraded and the degree of liquefaction was high.
DOI: 10.15376/biores.17.3.4262-4279
Keywords: Corn stalk; Liquefaction; Polyhydric alcohol; Bio-oil; Residue
Contact information: a: Key Laboratory of Recycling and Eco-treatment of Waste Biomass of Zhejiang Province, Zhejiang University of Science and Technology, Hangzhou 310023, China; b: Tianjin Key Lab of Pulp and Paper, Tianjin University of Science and Technology, Tianjin 300457, China;
* Corresponding author: 15122753563@163.com
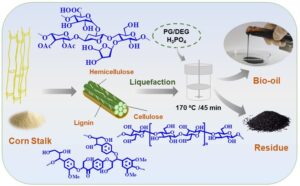
GRAPHICAL ABSTRACT
INTRODUCTION
Given the problems of scarcity and depletion in future availability of petrochemical resources, lignocellulosic biomass, as a renewable resource, has grasped increased attention globally (Lee et al. 2000). Abundant and widely distributed agricultural residue is an important part of lignocellulosic resources. However, if it is not reasonably handled and utilized, it will not only be a waste of resources, but will also cause serious pollution to the environment. Rational development and utilization of agricultural residue will contribute to the harmonious development for man and nature. Atmospheric pressure catalytic liquefaction technology is a thermochemical process that converts biomass into liquid products with wide molecular weight distribution through the interaction of liquefying agent and catalyst under atmospheric pressure and temperature below 200 °C. This is one of the effective ways of agricultural residue utilization that has been applied widely (Kormin and Rus 2017; Breunig et al. 2018).
Liquid products and residues from biomass transformation by liquefaction have a wide range of applications. The former can replace some petrochemical products (Jindal and Jha 2016) and can also be used as chemical raw materials to prepare other products (Bridgeman et al. 2007), such as ethanol (Poligenis et al. 2008) and biofuel, and as raw materials to produce polyurethane foaming materials (Schulzke et al. 2018), carbon fibers (Yoshida et al. 2005), phenolic resins (Yan et al. 2017), and adhesives (Li et al. 2017). Thus, biomass with lower energy density and grade is transformed into liquid product with higher energy density and grade. The liquefaction residue can be converted into activated carbon materials with low cost and high quality (Zhao et al. 2016).
The liquefying agent plays an important role in atmospheric pressure catalytic liquefaction. Not only can it disperse biomass raw materials, but it also affects the liquefaction outcome and molecular weight distribution of biomass. The commonly used liquefying agents mainly include phenol, alcohols, and cyclic carbonates. In recent years, many researchers have explored low toxic alcohols as liquefaction solvents for lignocellulosic biomass.
The advantages of using these alcohols are that it not only has a critical temperature and pressure lower than that of water that make the reaction conditions relatively mild, but also it can provide active hydrogen as a hydrogen donor. Meanwhile, it has a relatively low dielectric constant, which imparts easier dissolution of the polar products with higher molecular weight derived from the biomass components and can effectively prevent the re-polymerization of liquefied products (Yip et al. 2009).
To better use liquefied products, it is necessary to understand their structural characteristics. When bagasse powder is liquefied by polyethylene glycol/glycerol (Gly) catalyzed with sulfuric acid (SA) at 140 to 180 °C under ambient pressure, hemicellulose is the most active component of the cell wall, followed by lignin and cellulose. Liquefaction is a highly endothermic reaction (Zhang et al. 2020). Domingos et al. (2019) obtained high liquefaction yield when orange peel waste is liquefied with ethylene glycol (EG)/Gly (1:1) catalyzed using SA (liquefying agent/biomass material 9:1) at 180 °C for 1 h, and can efficiently be transformed into excellent polyurethane foam. The effect of liquefying agents, such as PG, DEG, 1,4-butanediol, and EG during 130 to 190 °C for 1 h using corn stalk as raw material and H3PO4 as catalyst was investigated by Zhang et al. (2018). Tests revealed that at the optimum temperature of 180 °C, liquefaction yield is the highest, up to 99.2% with PG as liquefying agent.
In this article, corn stalk was liquefied in PG/DEG mixture using an acid catalyst at 170 °C for 45 min, and the obtained liquefied products (both the residue and bio-oil) were characterized systematically. The main chemical components, functional groups, chemical structure, and fiber properties of the liquefied products were examined by various anlytical techniques. Moreover, the physicochemical properties of the produced bio-oil were tested and compared with that of crude oil. The findings here contribute to providing a theoretical foundation and technical support for the utilization of lignocellulosic biomass liquefied products, while also developing more potential applications in diverse fields, and promoting the efficient utilization of biomass resources and the development of biomass-based products.
EXPERIMENTAL
Materials
Crushed corn stalks were collected from farms near Tianjin, China. Corn stalk powders of 20- to 80-mesh size were screened through the standard sieve, and part of powders that can pass the 0.830 mm sieve (20 mesh) but cannot pass the 0.177 mm sieve (80 mesh) was retained. After the substrate moisture was balanced, it was stored for standby. Chemical compositions of corn stalk are summarized in Table 1. The contents of cellulose, hemicellulose, lignin and alcohol extract were determined by NREL method. And the contents of moisture and ash were tested by GB/T2677.2-1993.
Table 1. Chemical Compositions of the Corn Stalk Material

The primary chemicals used were of analytical purity (e.g., concentrated phosphoric acid, PG, DEG, 1,4-dioxane, NaOH, and pyridine). Acetone-d6, KBr, and silane reagent (BSTFA 90%, TMCS 10%) were of chromatographic purity. These solvents were purchased from the Sinopharm Chemical in Shanghai (China).
Liquefaction of the Corn Stalk
The corn stalk was liquefied using 10% catalytic amount of H3PO4 and liquefying agent (PG:DEG = 1:2) with liquid to solid ratio of 5:1 in the PARR 4848 high-pressure reactor (PARR, Champaign, IL, USA) at 338 r/min. Timing was started when the liquefaction temperature reached 170 °C, and cooling water was used to reduce the reactor temperature to about 25 °C after 45 min.
Products after the liquefaction were washed and dissolved with 80% 1,4-dioxane, stirred magnetically for 30 min, and then centrifuged for 15 min at 10 °C (10000 r/min). After centrifugation, concentrate (bio-oil) was obtained after 1,4-dioxane was removed from supernatant with rotary evaporation at 40 °C. Liquefaction residue was obtained by washing the centrifuged solid with deionized water and recycled 1,4-dioxane until the filtrate was colorless, followed by drying at 105 °C for 24 h (Zhang et al. 2018). At this time, the yields of bio-oil and liquefaction residue were 99.38% and 0.62%, respectively.
Analysis Methods
Fourier transform infrared (FTIR) analysis
KBr films made by dry sample and KBr (1:100, W/W) were analyzed using a Bruker 650 FTIR spectrometer (Karlsruhe, Germany) in the 4000 to 400 cm-1 range of wavenumber, and with a frequency of 16 scans (Zhang et al. 2021).
Pyrolysis gas chromatography mass spectrometric (Py-GC/MS) analysis
0.1 g sample was taken in a single-shot PY-2020iS pyrolyzer (Frontier LRB, Fukushima, Japan) and reacted at 600 ℃ for 12 s. Pyrolyzer was interfaced with a GC-MS analyzer (7890A-5975C, Agilent Technologies, Palo Alto, CA, USA). Cracking gas entered GC-MS system at a high purity He purge, with a total flow rate of 14 mL/min, split ratio of 10:1, split flow rate of 10 mL/min, and injection temperature of 280 ℃.
Column box program: The initial column temperature of 40 ℃ was retained for 5 min before being heated to 280 °C at a rate of 10 °C/min for 3 min. The GC-MS interface temperature was 280 °C; ion source was 230 °C; and MS four-stage rod was 150 °C. In EI scanning mode, mass number scanning range of mass spectrum was 50 to 800 amu.
GC-MS analysis
Silylation method: Initially, 20 mg bio-oil was dried in a vacuum drying oven at 40 °C for 30 min. Then, 80 and 150 μL of BSTFA and TMCS reagents were respectively added to it and the silanization reaction was allowed to proceed for 45 min at 70 °C. A 0.22-μm microporous membrane was used to filter the fluids (organic component) for GC-MS analysis.
GC conditions: HP-5MS column (30 m × 250 μm × 0.25 μm) was used with high purity helium gas as carrier gas, and the gas flow rate was set at 1.0 mL/min (shunt ratio of 10:1, inlet temperature of 300 ℃, injection volume of 0.2 μL, solvent delay of 3 min). The heating program was an initial temperature of 80.0 ℃, which was retained for 3 min. Then the heating reached 150 ℃ at 5 ℃/min and was retained for 0 min. Lastly, the heating rose to 300 ℃ at 10 ℃/min and was retained for 5 min. Total running time was 37 min.
MS conditions: The ion source temperature was set at 230 ℃, four-stage rod temperature was 150 ℃, and full scan range of 40 to 1000 amu, in EI ionization mode.
Thermogravimetric analysis (TGA)
5 to 10 mg sample was recorded on a thermogravimetric analyzer (TGA-Q50, Shimadzu, Kyoto, Japan) under N2 from 30 to 600 °C at a heating rate of 10 °C/min.
13C-NMR analysis
Corn stalk was analyzed with cross-polarization/magic angle spinning carbon-13 nuclear magnetic resonance spectra (CP/MAS 13C-NMR) (Infinityplus 300, Varian, Palo Alto, CA, USA). Approximately 100 mg bio-oil was dissolved in 0.5 mL of acetone-d6, and 13C-NMR was performed by an AVANCE III 400M NMR spectrometer (Bruker, Karlsruhe, Germany) using 10,000 scan numbers.
XRD analysis
The crystal morphology of the samples was measured using a Shimadzu Lab XRD-6100 diffractometer (Kyoto, Japan). Cu-Kα rays (λ = 1.54 A) were used to radiate the samples at a scanning angle of 2θ = 5 to 40° at scanning speed of 4°/min.
Bio-oil Physicochemical Properties
Determination of dynamic viscosity (μγ)
A rotary viscometer (DV2TLY, Brookfield, Stoughton, Middleboro, USA) was used to determine the bio-oil viscosity at 24 ± 1 ℃ by means of an appropriate rotor.
Determination of acid value
0.15 to 0.20 g of bio-oil (m, g) was dissolved in 25 mL 80% 1,4-dioxane solution, and titrated with N mol/L of NaOH (V1, mL). The consumed volume (V2, mL) was recorded after balancing. Acid value (X, mgKOH/g) was calculated by Eq. 1:
 (1)
(1)
Determination of density
The density of bio-oil was measured using a liquid densitometer (ET-03L, ETNALN, Beijing, China) at 15 ℃.
Determination of solid content
Bio-oil (m, g) was dissolved in 100 mL ethanol and filtered with 1.0 μm microporous membrane. The filtrate was washed until it was clear and colorless. After 15 min of air drying, the filtrate was transferred to an oven for drying (150 ℃, 30 min), cooled, and weighed (m0, g). The solid content of bio-oil was the mass ratio of m0 to m.
Determination of char yield
The char yield was calculated by the mass ratio of remaining substance to bio-oil after carbonization of bio-oil in an aerobic environment for 20 min and then combustion at 775 ℃ for 8 h.
RESULTS AND DISCUSSION
FTIR Analysis
The FTIR spectra of corn stalk and its liquefied products are shown in Fig. 1. As a control sample, the distinctive peaks for three-component can be observed in corn stalk spectrum. In the liquefaction residue spectrum, except for the lignin with C=O stretching vibration appeared at 1623 cm-1, the intensities of most distinctive peaks were diminished or entirely vanished, suggesting that lignin was almost totally liquefied and the residue contained mainly its derivatives. The C1-H bending vibration of β-glycosidic bond at 891 cm-1 was clearly attenuated, showing that bond was partially disrupted during liquefaction. At 1721 cm-1, there were characteristic peaks of aldehydes, ketones or esters linked to benzene rings, and carbohydrate compounds from corn stalk. In the residue this peak was substantially higher in intensity, which was due to degrading carbohydrate molecules to generate more carbonyl compounds during liquefaction. It may also be that aldehyde group formed was linked to lignin basic unit to produce a relatively stable structure. Three-component peaks were diminished or vanished, implying that they were degraded, and cellulose was more difficult to liquefy than lignin and hemicellulose. Residue consisted mostly of incompletely liquefied cellulose and polymers produced by the reaction of tiny molecules produced by the three components degradation.
Due to the polymerization of O-H groups in the liquefied corn stalk with acid catalysts and alcoholic groups in the liquefying agents, there was evidence of the generation of water or other small molecules. Thus, the O-H stretching peak intensity in bio-oil at 3411 cm-1 was weakened when compared to that in the corn stalk spectrum. Bio-oil peaks weakened or disappeared in the ranges of 1721 to 1377 and 1250 to 1049 cm-1, while a strong peak appeared at 1007 cm-1, due to the degradation of lignin macromolecules into new substances and the gradual reduction of liquefying agent in the late liquefaction stage.

Fig. 1. FTIR spectra of corn stalk and liquefied products
Py-GC/MS or GC-MS Analysis
Figure 2 represented the total ion chromatogram (TIC) of corn stalk and its liquefied products. The distribution of peaks including the relative peak heights and spectral patterns in the three curves were more complex, indicating that their compounds types and relative contents were much complicated.

Fig. 2. TIC of corn stalk and its liquefied products
The main components of corn stalk and its liquefied products were identified using the mass spectra of each absorption peak in the TIC diagram, and the relative contents of these components were determined by the area normalization technique (Table S1). As shown in Fig. 3, furans (39.6%), phenols (16.6%), ketones (6.18%), hydrocarbons (5.23%), alcohols (2.16%), aldehydes (1.75%), esters (1.80%), and organic acids (0.049%) were identified in the pyrolysis products of corn stalk. Also detected were heteroatom (S- or N-based) organic compounds with a content of 26.6%. The pyrolysis products of liquefaction residue contained complex compounds, such as furans (10.6%), ketones (3.73%), hydrocarbons (35.2%), phenols (18.9%), alcohols (4.17%), aldehydes (4.31%), ethers (1.25%), organic acids (4.79%), and 17.0% hetero-atomic compounds.
Bio-oil was made up of 39 different chemical compounds, practically all of which included element O, indicating that it contained a lot of oxygen and was unstable. The percentage of alcohols in bio-oil was the highest at 70.7%. It also contained 10.6% PG and 30.6% DEG, some of which were formed by degradation and others would have formed from non-reacting liquefying agents. Phenols made up 25.6% of the bio-oil. Some ether bonds in lignin were broken, specifically the β-O-4 bond, and degraded into phenolic compounds, which were mostly derived from cracking of phenylpropane-based fundamental structure of lignin. Acids (2.80%) and ethers (0.644%) formed from the degradation of carbohydrates were also found in the bio-oil, making it acidic and caustic. In addition, 0.097% esters and 0.129% ketones were included in the bio-oil.

Fig. 3. Relative contents and distribution of compounds in corn stalk and its liquefied products
TGA Study
TGA of corn stalk and its liquefied products are depicted in Fig. 4. The pyrolysis stages of corn stalk were separated into three periods. The first stage was the heating step (from 30 to 150 ℃), which was mostly associated with the escape of water and small molecules, and the mass loss rate of corn stalk at this step was 6.3%. The second stage (rapid mass loss stage) was from 150 to 385 °C, with mass loss of roughly 65.8%. Hemicellulose pyrolysis produced a shoulder peak at 256 °C. Pyrolysis process of cellulose caused the largest mass loss at 337 °C, and mass loss rate at that step was 64.7%. At 385 °C, residual mass was 27.5%. The third stage (slow mass loss stage) was 385 to 600 °C. With the increase of temperature, the mass loss rate decreased, and residual mass at 600 ℃ was 20.5%.
Compared with the pyrolysis of corn stalk, the initial pyrolysis temperature (267 ℃), shoulder peak (310 ℃), maximum mass loss peak temperature (398 ℃), and reaction termination temperature (490 ℃) of liquefaction residue all moved backward, indicating that these four temperatures were increased, while the final and maximum mass loss rate decreased remarkably. This demonstrated that pyrolysis conditions of residue were more severe than those of corn stalk (Zhang et al. 2019b). Liquefaction residue mainly came from the insoluble substances produced by the reaction between the degradation products of the three components or the reaction with PG/DEG.
The different carbon number in bio-oil resulted in different boiling points and corresponding mass loss peaks. There were two peaks with different intensities on the derivative thermogravimetric (DTG) curve between 30 and 150 ℃, and mass loss rate of bio-oil was approximately 40%, which was explained by the volatilization of water or light oils carbon number with less than 10, such as light naphtha and refining gas. The mass loss was roughly 40% at 150 to 350 °C, and multiple peaks on the DTG curve were caused by pyrolysis of heavy oil, kerosene, diesel, and other compounds, indicating that the bio-oil contained some compounds with carbon numbers between 10 and 25. From 350 to 450 °C, there was no clear peak, and the mass loss was approximately 2%, which was attributed to the fact that the bio-oil contained less lubricating oil or heavy fuel oil and other substances with carbon number between 25 and 35. However, a small peak appeared from 450 to 600 °C, with mass loss rate of approximately 3%, which was primarily due to thermal decomposition of waxes, colloid, and bitumen with carbon numbers greater than 35 in bio-oil. The residual weight percentage of bio-oil was around 15%. At 107 °C, the peak maximum was reached, with mass loss of 0.66%/℃. This was because the distillation reaction of bio-oil mainly took place at low temperature and contained a large number of compounds with carbon number less than 10. In conclusion, the bio-oil contained more than 80% compounds with carbon number less than 25, indicating that the bio-oil was comparable to gasoline, kerosene, diesel oil, and other petroleum-based products. This was well consistent with GC-MS detection results.

Fig. 4. TG (Left) and DTG (Right) curves of corn stalk and its liquefied products
NMR Analysis
Figure 5 displays 13C-NMR spectra of corn stalk and bio-oil. In Fig. 5, their signals were mainly concentrated in the range of δ 20 to 180 ppm. Signals at different δ–values corresponded to different types of carbon, such as carbon in alkyl, methoxy, alkoxy, aryl and carboxyl corresponding to in the ranges of δ 10 to 46, 54 to 57, 60 to 110, 110 to 160 and 160 to 180 ppm, respectively. The δ 174.25 and 20.84 ppm in the spectrum of corn stalk were respectively derived from carbonyl and methyl carbons on the acetyl group of hemicellulose. The signal at 60 to 110 ppm was mostly due to cellulose. For example, signals at 105.20, 74.82, and 72.69 ppm correspond to C-1/2/3/5, respectively. The δ 88.11, 64.48, and 84.27 ppm came from crystalline region of C-4/6 and amorphous region C-4 in cellulose. The δ-value at 134.41 ppm increased due to etherified and unetherified C-1 on G-type, and etherified and unetherified C-1/4 on S-type lignin units. The signal at 137.03 ppm was consistent with its etherified structure. The signal at 115.21 ppm was derived from C-5 of G-type lignin. The signal at 56.20 ppm was assigned to -OCH3 in lignin. In the bio-oil spectrum, the signal near 29.28 and 206.59 ppm was reflected by acetone-d6 (Zhang et al. 2019a). There was no signal near 56.3 ppm, indicating that methoxyl group was removed in the liquefaction system.


Fig. 5. NMR spectra of corn stalk and bio-oil
XRD Analysis
The XRD patterns of corn stalk and its liquefaction residue are displayed in Fig. 6. Figure 6 reveals that the corn stalk diffraction chart had three diffraction peaks, among which peaks at 2θ = 15.68° (110), 21.92° (200) and 34.52° (004) planes (Zhai et al. 2018) were ascribed to cellulose type I (Golbaghi et al. 2017). Moreover, the main and secondary peaks of the liquefaction residue vanished in the ball-milled cellulose sample (Boissou et al. 2014). This can be attributed to the destruction of the crystalline structure of cellulose and hemicellulose under high temperature, acid catalyzed liquefaction, and inorganic elements and minerals contained in the corn stalk, resulting in the disappearance of the lattice structure of cellulose I. This means that corn stalk was simultaneously decrystallized and degraded at this time.

Fig. 6. X-ray diffraction patterns of corn stalk and liquefaction residue
Analysis of Bio-oil Physicochemical Properties
Bio-oil presented an opaque, brownish black, viscous liquid with some fluidity and a pungent smell, which was similar to crude oil in appearance. If the bio-oil was placed for a period of time, a specific quantity of solid particles were seen at the bottom. If the storage time was prolonged, large viscous substances appeared on the upper layer. Its physicochemical properties were intimately linked to this phenomenon.
Physicochemical properties of bio-oil are shown in Table 2. The solid content, char yield, and acid value of bio-oil were much higher than those of crude oil, up to 20 to 100 times higher. The quality of bio-oil was lowered as a result of these variables. Solid particles in bio-oil gradually deposited to the bottom and adsorbed some lignin degradation products. Even if some larger solid particles can be removed by filtration and other methods, the smaller particles will still be absorbed during storage, leading to greater particulate matter over time. The presence of these solid particles, char, and high acidity will cause a series of adverse effects, such as increase in the apparent viscosity of bio-oil and corrosion of the equipment used. When the air supply was insufficient, the carbon material obtained by volatilizing the volatile components included in the oil was referred to as the char yield. The char yield may represent the possibility of oil products coking and carbon deposition. The char yield of bio-oil was more than 100 times that of the highest crude oil, signifying that bio-oil will produce certain coking and carbon deposition, resulting in wear and blockage of burner.
Table 2. Physicochemical Properties of Bio-oil and Crude Oil

CONCLUSIONS
- Liquefied products prepared from corn stalk in the presence of PG/DEG mixture with H3PO4 catalysis at 170 °C for 45 min under atmospheric pressure were characterized. Results showed that characteristics corresponding to the functional groups of cellulose, hemicellulose, and lignin from corn stalk disappeared. This indicated that it degraded to produce small molecular compounds and intermediates. Liquefaction residue generated mainly contained products from the reaction between these degradation products with each other or with liquefying agent.
- The physicochemical properties of bio-oil from corn stalk and crude oil were quite different. Bio-oil had high viscosity, acidity, solid content, and char yield, and contained more than 70% alcohols and more than 80% compounds with carbon number less than 25, which were the key factors affecting the quality of bio-oil.
- The composition of liquefaction residue was complex, including hydrocarbons, phenols, alcohols, furans, organic acids, aldehydes, ketones, ethers, and heteroatom-containing compounds. The condition of pyrolysis was more intense than that of corn stalk. In addition, the crystalline structure of carbohydrate in corn stalk was completely destroyed during liquefaction, so that there was no Cellulose-I crystalline lattice in the produced residue, indicating that corn stalk was almost completely liquefied at liquefaction system used.
REFERENCES CITED
Boissou, F., Mühlbauer, A., Karine, D., Leclercq, L., Kunz, W., Marinkovic, S., Estrine, B., Nardello-Rataj, V., and Jérôme, F. (2014). “Transition of cellulose crystalline structure in biodegradable mixtures of renewably-sourced levulinate alkyl ammonium ionic liquids, gamma-valerolactone and water,” Green Chemistry 16(5), 2463-2471. DOI: 10.1039/c3gc42396d
Breunig, M., Gebhart, P., Hornung, U., Kruse, A., and Dinjus, E. (2018). “Direct liquefaction of lignin and lignin rich biomasses by heterogenic catalytic hydrogenolysis,” Biomass and Bioenergy 111, 352-360. DOI: 10.1016/j.biombioe.2017.06.001
Bridgeman, T. G., Darvell, L. I., Jones, J. M., Williams, P. T., Fahmi, R., Bridgwater, A. V., Barraclough, T., Shield, I., Yates, N., and Thain, S. C. (2007). “Influence of particle size on the analytical and chemical properties of two energy crops,” Fuel 86(1-2), 60-72. DOI: 10.1016/j.fuel.2006.06.022
Domingos, I., Ferreira, J., Cruz-Lopes, L., and Esteves, B. (2019). “Polyurethane foams from liquefied orange peel wastes,” Food and Bioproducts Processing 115, 223-229. DOI: 10.1016/j.fbp.2019.04.002
Golbaghi, L., Khamforoush, M., and Hatami, T. (2017). “Carboxymethyl cellulose production from sugarcane bagasse with steam explosion pulping: Experimental, modeling, and optimization,” Carbohydrate Polymers 174, 780-788. DOI: 10.1016/j.carbpol.2017.06.123
Jindal, M. K., and Jha, M. K. (2016). “Effect of process parameters on hydrothermal liquefaction of waste furniture sawdust for bio-oil production,” RSC Advances 6(48), 41772-41780. DOI: 10.1039/C6RA02868C
Kormin, S., and Rus, A. Z. M. (2017). “Preparation and characterization of biopolyol from liquefied oil palm fruit waste: Part 2,” Materials Science Forum 882, 113-118. DOI: 10.4028/www.scientific.net/MSF.882.113
Lee, S. H., Yoshioka, M., and Shiraishi, N. (2000). “Liquefaction and product identify-cation of corn bran (CB) in phenol,” Journal of Applied Polymer Science 78(2), 311-318. DOI: 10.1002/1097-4628(20001010)78:2<311::aid-app110>3.0.co;2-n
Li, Y., Li, B., Du, F., Wang, Y., Pan, L., and Chen, D. (2017). “Microwave-assisted hydrothermal liquefaction of lignin for the preparation of phenolic formaldehyde adhesive,” Journal of Applied Polymer Science 134(10), article ID 44510. DOI: 10.1002/app.44510
Poligenis, S. N., Mojovic, L., Rakin, M. B., and Dušanka, P. (2008). “A microwave-assisted liquefaction as a pretreatment for the bioethanol production by the simultaneous saccharification and fermentation of corn meal,” Chemical Industry and Chemical Engineering Quarterly 14(4), 231-234. DOI: 10.2298/CICEQ0804231N
Schulzke, T., Iakovleva, A., Cao, Q., Conrad, S., Zabelkin, S., and Grachev, A. (2018). “Polyurethane foams produced from pyrolysis oil-production and possible applica-tion,” Biomass and Bioenergy 115, 195-202. DOI: 10.1016/j.biombioe.2018.04.006
Yan, L., Cui, Y., Gou, G., Wang, Q., Jiang, M., Zhang, S., Hui, D., Gou, J., and Zhou, Z. (2017). “Liquefaction of lignin in hot-compressed water to phenolic feedstock for the synthesis of phenol-formaldehyde resins,” Composites. Part B: Engineering 112, 8-14. DOI: 10.1016/j.compositesb.2016.10.094
Yip, J., Chen, M., Szeto, Y. S., and Yan, S. (2009). “Comparative study of liquefaction process and liquefied products from bamboo using different organic solvents,” Bioresource Technology 100(24), 6674-6678. DOI: 10.1016/j.biortech.2009.07.045
Yoshida, C., Okabe, K., Yao, T., Shiraishi, N., and Oya, A. (2005). “Preparation of carbon fibers from biomass-based phenol-formaldehyde resin,” Journal of Materials Science 40(2), 335-339. DOI: 10.1007/s10853-005-6087-1
Zhai, Q., Li, F., Fei, W., Xu, J., Jiang, J., and Cai, Z. (2018). “Liquefaction of poplar biomass for value-added platform chemicals,” Cellulose 25(8), 4663-4675. DOI: 10.1007/s10570-018-1872-6
Zhang, Y., Liu, Z., Hui, L. F., and Wang, H. M. (2018). “Diols as solvent media for liquefaction of corn stalk at ambient pressure,” BioResources 13(3), 6818-6836.
DOI: 10.15376/biores.13.3.6818-6836
Zhang, H., Li, Q., Peng, F., Guo, H., and Chen, X. (2020). “Kinetic study on the liquefaction of bagasse in polyhydric alcohols based on the cell wall component of the liquefied residue,” Iranian Polymer Journal 29, 535-541. DOI: 10.1007/s13726-020-00817-5
Zhang, Y., Liu, Z., Liu, H. T., Hui, L. F., Wang, H. M., and Liu, H. Y. (2019a). “Characterization of liquefied products from corn stalk and its biomass components by polyhydric alcohols with phosphoric acid,” Carbohydrate Polymers 215, 170-178. DOI: 10.1016/j.carbpol.2019.03.096
Zhang, Y., Liu, Z., Liu, H. T., Hui, L. F., Wang, H. M., and Liu, H. Y. (2019b). “Characterization of the liquefaction residue from corn stalk and its biomass components using polyhydric alcohols with phosphoric acid,” BioResources 14(2), 2684-2706. DOI: 10.15376/biores.14.2.2684-2706
Zhang, Y., Wang, H. L., and Liu, Z. (2021). “Separation and characterization of corn stalk biomass components,” BioResources 16(4), 7205-7219. DOI: 10.15376/biores.16.4.7205-7219
Zhao, L., Wang, Y., and Li, W. (2016). “Nitrogen(N)-doped activated carbon materials with a narrow pore size distribution derived from coal liquefaction residues as low-cost and high-activity oxygen reduction catalysts in alkaline solution,” RSC Advances 6(93), 90076-90081. DOI: 10.1039/C6RA17049H
Article submitted: December 29, 2021; Peer review completed: April 16, 2022; Revised version received: May 6, 2022; Accepted: May 18, 2022; Published: May 24, 2022.
DOI: 10.15376/biores.17.3.4262-4270
APPENDIX
Supplementary Material
Table S1. Comparison of Main Chemical Components of Corn Stalk and its Liquefied Products


Footnotes: this only showed the peak area of the compound group, – indicating that the compound was not detected.