Abstract
Biomass liquefaction is a major process used to obtain fuel additives, valuable chemicals, and high-quality activated carbon. In this work, three major biomass components (cellulose, hemicellulose, and lignin) and corn stalk were liquefied, and the corresponding liquefaction residue yields were 0.62%, 14.56%, 1.98%, and 1.29%, respectively, using polyhydric alcohols and acid catalysis under atmospheric pressure. The liquefaction residues from the corn stalk and biomass components were analyzed by thermogravimetric analysis, pyrolysis-gas chromatography/mass spectrometry, X-ray diffraction, and scanning electron microscopy. It was found that the corn stalk residues were mainly large molecules produced by interactions of some small molecules and incompletely degraded cellulose; condensation polymers generated from the reaction of degraded substances derived from lignin or hemicellulose; and insoluble components containing reactants from the degraded substances of the three major components and the insoluble substances generated by the liquefaction agents during the process.
Download PDF
Full Article
Characterization of the Liquefaction Residue from Corn Stalk and Its Biomass Components Using Polyhydric Alcohols with Phosphoric Acid
Yan Zhang, Zhong Liu,* Haitang Liu,* Lanfeng Hui, Huimei Wang, and Haoyue Liu
Biomass liquefaction is a major process used to obtain fuel additives, valuable chemicals, and high-quality activated carbon. In this work, three major biomass components (cellulose, hemicellulose, and lignin) and corn stalk were liquefied, and the corresponding liquefaction residue yields were 0.62%, 14.56%, 1.98%, and 1.29%, respectively, using polyhydric alcohols and acid catalysis under atmospheric pressure. The liquefaction residues from the corn stalk and biomass components were analyzed by thermogravimetric analysis, pyrolysis-gas chromatography/mass spectrometry, X-ray diffraction, and scanning electron microscopy. It was found that the corn stalk residues were mainly large molecules produced by interactions of some small molecules and incompletely degraded cellulose; condensation polymers generated from the reaction of degraded substances derived from lignin or hemicellulose; and insoluble components containing reactants from the degraded substances of the three major components and the insoluble substances generated by the liquefaction agents during the process.
Keywords: Corn stalk; Liquefaction; Residue; TGA; Py-GC/MS
Contact information: Tianjin Key Lab of Pulp and Paper, Tianjin University of Science and Technology, Tianjin 300457, China; *Corresponding authors: mglz@tust.edu.cn; liuhaitang@tust.edu.cn
INTRODUCTION
Given the depletion and excessive use of fossil energy sources and the escalation of global environmental problems, biomass sources, including agroforestry, animal waste, industrial waste, domestic waste, and aquatic life, have played an important role in the development of sustainable energy because of their abundant availability, low cost, and renewable nature (Lee et al. 2000a; Putro et al. 2016). It is generally recognized that plant biomass, a composite material that is predominantly composed of cellulose, hemicellulose, and lignin, is an ideal renewable resource. Furthermore, it has considerable potential to be converted into liquid fuels (Jindal and Jha 2016) and chemicals via liquefaction techniques (Lee et al. 2000b; Yip et al. 2009).
The technology for biomass liquefaction has made a great impact on researchers around the world (Kormin and Rus 2017). Liquid products and residue are generated by liquefaction with suitable solvents. Liquid products can substitute petrochemical products and can be further processed as chemical raw materials for manufacturing other products, such as adhesives (Li et al. 2017), phenolic resins (Yan et al. 2017), polyurethane foams (Schulzke et al. 2018), and carbon fibers (Yoshida et al. 2005), etc. Compared with liquid products, residues have attracted increasing attention from researchers and some studies have been completed because the residue content is usually used as an evaluation of the extent of liquefaction (Yamada and Ono 1999). Moreover, liquefaction residues can be used as good raw materials for the preparation of high-quality and low-cost activated carbon materials (Zhao et al. 2016).
Several studies have been performed previously on the liquefaction effect of biomass under different conditions. The effects of the temperature, reaction time, hydrogen pressure, and type of solvent on the residue yield of sawdust were studied by Yan et al. (1999). The results revealed that a reduction in the residue yield was because the solvent promoted the destruction of the sawdust molecular structure. Bamboo has been subjected to a liquefaction process using phenol, ethylene glycol (EG), and ethylene carbonate (EC) with hydrochloric acid for different reaction times and liquid ratios (Yip et al. 2009). It was found that phenol was the best solvent for bamboo liquefaction, with a residue yield of less than 1%. The Fourier transform infrared (FT-IR) spectroscopy analyses of the residues showed that the major signals in the bamboo spectrum were diminished with phenol and EC, while ketone, ester, and benzene derivatives were generated by EG during the liquefaction process.
Chinese eucalyptus was liquefied in the presence of glycerol/EG. The effect of the chemical composition of the wood liquefaction residue under different liquefaction conditions (reaction time, liquefaction temperature, acid concentration, and liquor ratio) was characterized (Zhang et al. 2012). The results showed that the liquefaction residue was related to the liquefaction temperature, acid dosage, and liquid to solid ratio. With an increase in the acid dosage, the liquefaction rate, acid-insoluble lignin content, and hemicellulose content of the residues increased, while the relative content of cellulose decreased.
The wood liquefaction residues were detected by wet chemical analyses, FT-IR, X-ray diffraction (XRD), and scanning electron microscopy (SEM) (Pan et al. 2007), which demonstrated that the lignin in the middle lamella had been preferentially dissolved compared with cellulose in the liquefaction process. The condensation reaction of the degraded lignocellulose during wood liquefaction using polyhydric alcohols was discussed by Yamada et al. (2007). From the results, it was concluded that the water-insoluble fraction might have originated from condensed 5-hydroxymethylfurfural derivatives.
Currently, a comprehensive analysis of non-wood liquefaction residue is still lacking. Additionally, the research on the composition of liquefaction residues is unclear. It is crucial to investigate the characteristics of non-wood residue components to develop new methods for better comprehension of some fundamental aspects of non-wood liquefaction.
In this paper, corn stalk and its biomass components were liquefied by a mixture of 1,2-propylene glycol (PG) and diethylene glycol (DEG) with an acid catalyst, and a systematic exploration of the characteristics of the liquefaction residues was performed. The main objective was to understand the composition of the residue from corn stalk liquefaction by studying the degradation behavior of each component in the plant feedstock. Then, the thermal decomposition property, main components, crystallization, and morphological structure changes of the corn stalk, cellulose, hemicellulose, lignin, and their residues after liquefaction were evaluated with thermogravimetric analysis (TGA), pyrolysis gas chromatography/mass spectrometry (Py-GC/MS), XRD, and SEM. The research results can contribute to the reuse of non-wood liquefaction residues, which is valuable for environmental protection and the economy.
EXPERIMENTAL
Materials
The cellulose, hemicellulose, and milled wood lignin (MWL) used in this study were extracted from corn stalk. The extraction process is shown in Fig. 1 (Lv and Wu 2012). Corn stalk (20-mesh to 80-mesh) was obtained from a farmland in Tianjin, China, dried in an oven at 105 °C for 12 h, and stored in a desiccator prior to use. The chemical composition (dry weight) of corn stalk used was as follows: hemicellulose, 20.42%; cellulose, 36.89%; lignin, 17.38%; alcohol extract, 13.80%; and ash, 2.43%.

Fig. 1. Schematic for the extraction of hemicellulose, cellulose, and MWL from corn stalk
Analytically pure reagents (phosphoric acid, PG, DEG, 1,4-dioxane, and ethanol) were purchased from Sinopharm Chemical (Shanghai, China).
Liquefaction of the Raw Materials
The cellulose, hemicellulose, MWL, and corn stalk were liquefied by a mixture of DEG and PG (1:2, ω/ω) with phosphoric acid as the catalyst under atmospheric pressure using a high-pressure reactor (4848, PARR, Champaign, IL, USA). PG was an H-donor solvent. It not only dissolved and prevented the re-binding of pyrolysis fragments, but also provided hydroxyl free radicals. It was easy to dehydrogenate in liquefaction reaction, and the dehydrogenated hydrogen atoms existed in the form of free radicals. Hydrogen free radicals were combined with free radical fragments from pyrolysis of plant fibers, thus reducing the possibility of coupling free radical fragments into condensation products. The H-donor solvents participated in the reaction, but they could be separated after the reaction and regenerated by hydrogenation (Connors et al. 1980). Because of the high price of PG, the liquefaction cost of corn stalk could be reduced under the premise that the liquefaction yield was not affected by the mixed DEG.
The optimum conditions for liquefaction of corn stalk were determined by single factor method. The liquefaction temperature was set at 140 °C, 150 °C, 160 °C, 170 °C, 180 °C, and 190 °C; liquefaction agent was diethylene glycol mixed with 1,2-propanediol, the mixing ratio of the two was set at 15:1, 9:1, 6:1, 4:1, 2:1, 1:2, 1:4, and 1:6; the liquid-solid ratio was set at 1:1, 3:1, 5:1, 7:1, and 9:1; catalyst dosage was set at 2%, 4%, 6%, 8%, 10%, 12%, 14%, and 16%; liquefaction time was set at 15 min, 30 min, 45 min, 60 min, 75 min, and 90 min, and the rotational speed was 338 r/min. The optimum liquefaction conditions of corn stalk were determined by studying the influence of these factors on liquefaction yield. The liquefaction reaction was performed under optimized conditions (5:1 liquid-solid ratio, 10% catalyst dosage, 45-min reaction time, and 170 °C liquefaction temperature). After a preset time, the kettle was immersed in cooling water to quench the reaction.
Measurement of the Liquefaction Residue Yield
The residues were diluted with a large amount of mixture liquid containing water and 1,4-dioxane (1:4, v:v). This mixture was recommended as a general diluent for liquefied biomasses. The diluted products were separated into residue and filtrates using a TGL-20M high-speed refrigerated centrifuge (Xiangyi Centrifuge Instrument co. LTD., Changsha, China). Water and 1,4-dioxane was used to rinse the residues to a constant weight through filter paper until the filtrate was colorless. The residue was dried in an oven at 105 °C for 24 h. The residue yield was defined as the percentage of dry weight of the dioxane insoluble matter to the total lignocellulose weight (Yamada and Ono 1999).
Characterization of the Raw Material and Liquefaction Residues
TGA
The TGA of the samples (10 mg) was performed in a thermogravimetric analyzer (TGA-Q50, Shimadzu, Kyoto, Japan) at a heating rate of 10 °C/min up to a final temperature of 800 °C under a nitrogen atmosphere.
Py-GC/MS analysis
For Py-GC/MS analysis, 0.1-mg samples were pyrolyzed at 600 °C for 12 s with a single-shot PY-2020iS pyrolyzer (Frontier, Fukushima, Japan). The temperature of the quartz tube was calibrated by a thermocouple. Pyrolysis was done in a high pure helium atmosphere by applying a 12-mL/min flow rate and 8:1 split ratio. The pyrolyzer interfaced with an Agilent 7890A/5975C GC/MS (Palo Alto, CA, USA). The GC/MS had an Agilent HP-5MS capillary column (30 m × 250 μm × 0.25 μm). The pyrolysis interface and GC injector temperature were kept at 280 °C.
The GC oven temperature was programmed to hold at 40 °C for 5 min and then increase to 280 °C for 2 min at a rate of 8 °C/min. The total operation time was 37 min. The ion source and MS interface were heated to 230 °C and 150 °C, respectively. The MS was operated in the electron impact mode. The mass range of 50 amu to 800 amu was scanned.
XRD analysis
Diffraction diagrams of the samples at the optimized conditions were recorded between 5° and 40° using a Shimadzu Lab XRD-6100 diffractometer at a scanning rate of 4°/min. The relative crystallinity (CrI) of the polymers was calculated by dividing the area of the crystalline peaks by the total area under the curve (Segal et al. 1959; Abdou et al. 2008).
SEM analysis
Morphological changes in the biomass samples were observed with a scanning electron microscope (JSM-IT300, JEOL, Tokyo, Japan).
RESULTS AND DISCUSSION
Thermal Analysis
The thermogravimetric (TG) and derivative thermogravimetric (DTG) curves of the corn stalk and its three main components (cellulose, hemicellulose, and MWL) are given in Fig. 2. The comparison between these four substances showed that the initial decomposition temperature of hemicellulose was relatively low. Weight loss mainly occurred between 169 °C and 339 °C, with a maximum weight loss rate of 0.68%/°C obtained at 278 °C. The solid residue (char) content that remained at 800 °C was 23.4%. This indicated that the thermal stability of hemicellulose was poor. The main reason for this was that hemicellulose is a heterogeneous polymer composed of several different types of monosaccharides. The bonds between different monosaccharides were weak, and the reaction of dehydration and side chain removal occurred easily under acid action. The original temperature of cellulose pyrolysis was the highest. Degradation occurred over a narrow temperature range (238 °C to 382 °C), with the highest decomposition rate (1.72%/°C) found at 351 °C. Meanwhile, the lowest char content was only 11.5% at the final temperature, which showed that cellulose was the most stable. This was attributed to the homogeneous unbranched crystalline structure of cellulose with D-glucose units. MWL decomposed over a wide temperature range (142 °C to 416 °C) with two low-intensity peaks (< 0.35%/°C) at 230 °C and 355 °C. Additionally, the final char yield was up to 31.3%. This resulted from MWL having the highest carbon content of the three corn stalk components and its complex structure. The main structure was composed of three kinds of phenylpropane monomers linked via ether bonds and abundant side chains (hydroxyl and methoxyl). By comparing the TGA data of the three components, the order of their thermal stability from lowest to highest was hemicellulose, cellulose, and MWL, which may have been related to their different chemical structures and compositions (Varhegyi et al. 1989; Wang et al. 2008; Cheng et al. 2012).

Fig. 2. TG and DTG curves of the corn stalk and its three main components
The major pyrolysis temperature range for corn stalk was 135 °C to 377 °C, and the char content was 19.1% at 800 °C. By comparing this result with the results of the three main components, it was found that the pyrolysis behavior of the corn stalk can be considered the synthesis of each component. The maximum weight loss peak (337 °C) and shoulder peak (256 °C) of the corn stalk were derived from the pyrolysis of cellulose and hemicellulose, respectively, and MWL increased the main weight loss temperature range of the corn stalk thermal degradation. In contrast, the volatile products and chars produced by pyrolysis of the corn stalk mainly came from the degradation of cellulose and MWL, respectively, while hemicellulose contributed to the production of both products (Tan et al. 2006).
The TG and DTG curves, and thermal properties of the liquefaction residues from the corn stalk and three components are shown in Fig. 3 and Table 1, respectively. Compared with the corresponding components of the corn stalk, hemicellulose, and MWL residues, the initial decomposition and reaction termination temperatures of those three residues increased remarkably, the temperature of the maximum weight loss peak obviously shifted, the char yield increased dramatically, and the maximum weight loss rate decreased greatly. The results demonstrated that the pyrolysis conditions of the liquefaction residue were more restrictive than those of the liquefied component. This may have been because the residue from hemicellulose acid catalysis in the presence of polyhydric alcohol was mainly derived from the condensation product generated by its degraded small molecular substances. Meanwhile, its chemical structure had obviously changed and thus the TG behavior of its residue also changed remarkably (Zhang et al. 2006). Most of the MWL residues corresponded to condensed polymer structures, which were produced by the reactions between their degradation products (mainly aromatic derivatives) or the degraded product and their liquefaction reagent.

Fig. 3. TG and DTG curves of the liquefaction residues from the corn stalk and its three main components
Compared with the pyrolysis of cellulose, the initial decomposition temperature of the cellulose liquefaction residue decreased while its maximum weight loss peak temperature increased. The reason was that the liquefaction residue was cellulose that was not liquefied completely, but its crystalline structure was destroyed during liquefaction, and some glycosidic, C-C, and C-O bonds in the cellulose structure were broken (Zhang et al. 2011). The final weight loss yield and maximum weight loss rate decreased notably, which may have been caused by the insoluble substances produced by the cellulose degradation products and liquefaction reagents, or the aromatic cyclization of residues in the cellulose structure at high temperatures (Zhang et al. 2011). Based on these phenomena, it was concluded that the bond between the plant components was destroyed, and the pyrolysis behavior of the corn stalk residue was the collaboration of its three components in the liquefaction process.
Table 1. Thermal Parameters of the Liquefaction Residue of the Corn Stalk and its Three Main Components

Tmass loss – The temperature range for mass loss; DTGmax – The peak of DTG; Tpeak – The temperature of the weightlessness peak; a – At 800 °C, on dry basis
Py-GC/MS Analysis
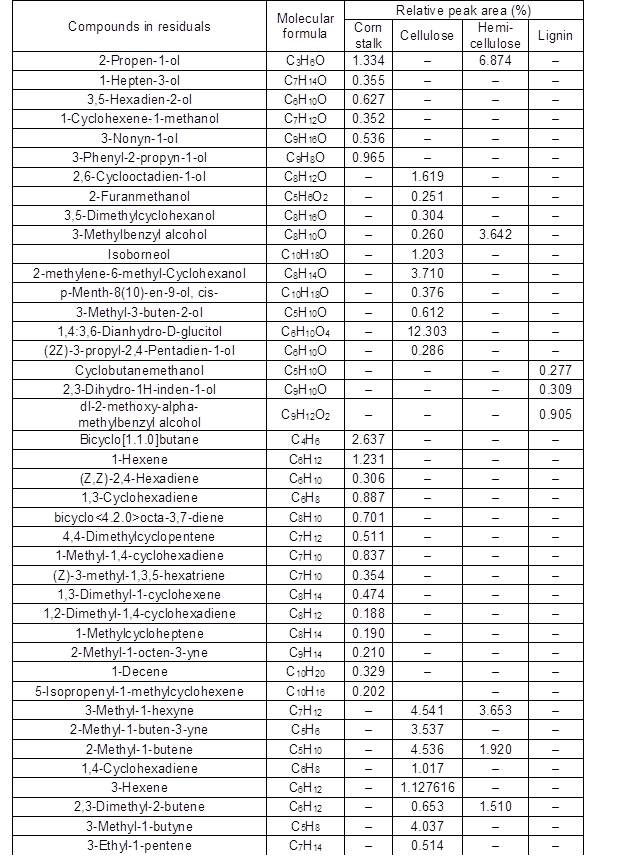
Pyrolysis of the corn stalk and its components was studied by Py-GC/MS. The identification of the main decomposition products and relative contents based on mass spectral libraries and the area normalization method is given in Table A1 and Fig. 4. Table A1 and Fig. 4 showed that the hemicellulose pyrolysis products mostly contained ketones (51.4%), hydrocarbons (15.9%), alcohols (10.2%), and a small amount of acids, aldehydes, and furfural. The hemicellulose isolated from corn stalk mainly consisted of L-arabino-β-(1→4)-D-glucuronoxylan units and other small amounts of sugar residues, such as glucose, galactose, and glucuronic acid, which were linked to the main chain as side chains. The thermal stability of the branched chains was poor. They were easily broken down and produced small molecular compounds at a low temperature. When the temperature increased, the glycosidic bonds in the main chain structure broke and dehydrated to form double linkages and other chemical bonds. The ketones accounted for more than half of the total content of pyrolysis products. The production of small molecular ketones (e.g., 2-pentanone, 3-hexanone, and 1-hydroxy-2-butanone) was complex, while cyclopentanones and cyclopentenones (38.03%) were almost solely derived from the degradation of sugar units, followed by the reorganization of opened bonds.
Compared with that of the hemicellulose, the main chemical groups of the cellulose pyrolysis products were similar, but the latter included more furans (17.1%), anhydrous sugars (1.94%), and small molecular weight aldehydes (17.7%). This was because cellulose was pyrolyzed to 13.5% furfural, which belonged to furans. After breaking the β-(1→4)-glycosidic bonds in the cellulose polymers, the formation of levoglucosan (LG) was mediated by molecular rearrangement between the obtained monomers (Li et al. 2001). Then, LG was dehydrated into 1,4:3,6-dianhydro-α-d-glucopyranose. This tended to open rings and the secondary decomposition of LG tended to produce simple organic compounds, such as aldehydes, alcohols, and ketones, at high temperatures. However, anhydrous sugars were not detected in the hemicellulose pyrolysis products of corn stalk, which was because of the formation of furans or cyclopentanones from these substances through the possible dehydration, fission, decarbonylation, decarboxylation, and polymerization reactions that occurred at 600 °C.
The main decomposition products of MWL were phenols (54.4%) and furans (38.9%). As one of the representative compounds of MWL pyrolysis, the presence of phenols was ascribed to the cleavage of C-O-C and C-C bonds on the side chains of the MWL structural units. Another typical pyrolytic product (furans) contained 2-acetylfuran (38.1%), 7-methylbenzofuran (0.25%), 2-ethylbenzofuran (0.23%), and furfural (0.39%). The three former compounds were derived from the secondary aggregation of MWL allyl radical intermediate substances, while furfural mainly originated from the pyrolysis products of residual hemicellulose impurities when MWL was extracted from the corn stalk. Hence, these pyrolysis products implied that the MWL severely decomposed at 600 °C.
The pyrolysis products from the corn stalk included many compounds that stemmed from fracturing of its individual components, such as furans (39.6%), phenols (16.6%), ketones (6.18%), hydrocarbons (5.23%), alcohols (2.16%), aldehydes (1.75%), esters (1.80%), and acids (0.05%). The corn stalk pyrolysis products also contained heteroatom organic compounds (S or N), such as 1,1-dimethylhydrazine (6.18%), 1,3-dihydro-2,4-pyrimidinedione (5.01%), and 2-mercaptopyrimidine (0.62%). However, anhydrous sugars were not found in the pyrolysis products, which was likely because of the conversion of the products to small molecules (aldehydes and ketones) through the catalysis of inorganic elements in the corn stalk at 600 °C.

Fig. 4. Relative contents of the major identified groups in decomposition products of corn stalk and its biomass components
The Py-GC/MS analysis method was used to determine the liquefaction residues from the fast pyrolysis of the corn stalk, cellulose, hemicellulose, and MWL. The relative percentage (content) of each peak area was calculated by the method of area normalization, and the specific distributions are given in Table A2 and Fig. 5. The main pyrolysis products of the cellulose residue included furans (28.3%), alcohols (20.9%), aliphatics (20.2%), ketones (15.3%), and a small quantity of esters (2.04%). The decomposition products from the hemicellulose residue were similar to those from cellulose, and also contained acids (1.11%), ethers (1.46%), and aldehydes (22.4%). The reason for this may have been that the composition of hemicellulose was more complex and there were many kinds of sugar units, such as pyran, furan, and β- or α-glycosidic bonds. Additionally, there were D- and L-type units in the structure, and the glycosyl groups were linked by 1→2, 1→3, 1→4, and 1→6. Therefore, the reaction was more complicated than that for cellulose. The types of residue that were produced by the liquefaction reaction were also more complicated. The phenols and aromatics, which occupied 20.6% and 69.9% of the total decomposition products, respectively, were major components from MWL residue pyrolysis. It was possible that the basic skeleton of the MWL was made up of phenylpropane structural units. The degraded small molecules reassembled or reacted with the liquefaction agents to form macromolecular substances, whereas the phenyl structure was retained during MWL liquefaction. The liquefaction residue from corn stalk contained almost all of the compounds produced by pyrolysis of each component liquefaction residue, including furans (10.6%), phenols (18.9%), ketones (3.73%), aliphatics (9.06%), aromatics (26.2%), alcohols (4.17%), aldehydes (4.31%), esters (1.25%), and acids (4.79%). Also, other compounds made up 17.0% of the residue. Thus, the contribution of each component residue was different for each pyrolysis product distribution of the corn stalk residue. Moreover, inorganic elements had obvious effects on the liquefaction of corn stalk.

Fig. 5. Classification of the compounds based on the chemical functional groups in the different liquefaction residues
Finally, by comparing the Py-GC/MS spectra of the corn stalk and its major components with those of their liquefaction residues, it was found that in the process of acid-catalyzed liquefaction of corn stalk by polyhydric alcohols, small molecular substances that were generated by the degradation of the biomass components polymerized to form polymers (insoluble substances in 80% 1,4-dioxane) and were part of the residue.
XRD Analysis
Results of the XRD analysis of the untreated and treated corn stalk and its biomass components are illustrated by Figs. 6 and 7, respectively. Cellulose I is typically characterized by two broad peaks located at 16.12° (101) and 22.42° (002), and a third peak at 38.36° (040) (Wada et al. 2003). Figure 6 shows that the cellulose I lattice was observed in the corn stalk and cellulose, and their CrI values were 64.24% and 74.11%, respectively. However, the two diffraction peaks at 16.12° and 22.42° disappeared in the hemicellulose and MWL spectra to form an amorphous structure (Boissou et al. 2014). This was because of the absence of cellulose impurities when hemicellulose and MWL were extracted from the corn stalk.

Fig. 6. XRD curves of the untreated corn stalk, cellulose, hemicellulose, and MWL
Figure 7 demonstrates that the cellulose I lattice was preserved in the liquefaction residue from cellulose. The liquefying technique induced an increase in the CrI from 74.1% to 79.7% for cellulose, which was dependent on the removal of the amorphous area of the cellulose. This showed that the liquefaction treatment process had a certain influence on the degradation of cellulose, but cellulose was liquefied incompletely. Because of the complete destruction of the crystalline cellulose structure and hemicellulose by the catalyst at high temperatures, the cellulose I lattice in the corn stalk residue disappeared, which illustrated that the degradation degree of corn stalk liquefaction was quite high and corn stalk liquefied almost completely.

Fig. 7. XRD curves of the liquefaction residues from the corn stalk and its three components
SEM Analysis
The morphological structures of the corn stalk and its three main components before and after liquefaction were observed via SEM. Figure 8 shows the surface morphologies of the corn stalk (Fig. 8a), cellulose (Fig. 8b), MWL (Fig. 8c), hemicellulose (Fig. 8d), corn stalk residue (Fig. 8e), cellulose residue (Fig. 8f), MWL residue (Fig. 8g), and hemicellulose residue (Fig. 8h) under 500x magnification. It was seen from the comparison of Figs. 8b and 8f that the fibrous and compact structure of the cellulose was liquefied to form rough and disordered lumpy solids. Meanwhile, some segments of the fibrous structure can be observed in red circle of Fig. 8f. The results indicated that liquefaction of the cellulose was incomplete and the residues stemmed from insoluble macromolecules that were produced by the reaction and unreacted cellulose fragments. The reason was that the cellulose with its high crystallinity was composed of numerous microcrystals and a small amount of cell wall debris. Solvents and catalysts could not easily penetrate the cellulose, which led to a slow liquefaction reaction (Zhang et al.2011).

Fig. 8. SEM photographs of the corn stalk (a), cellulose (b), MWL (c), hemicellulose (d), corn stalk residue (e), cellulose residue (f), MWL residue (g), and hemicellulose residue (h)
Figure 8c shows that the structure of the MWL was mostly spherical. From Fig. 8g, the surface of the MWL residue was coarse, some of which was condensed into large agglomerates, and the original morphology of the single fiber was not observed at all. It was suggested that the residues generated by exhaustive MWL liquefaction were insoluble macromolecules, which were produced by the repolymerization of degraded small molecules or the solvent reaction. Because MWL was prone to chemical reaction under the action of heat and acid during the liquefaction process, the rate of MWL liquefaction was faster than that of cellulose and hemicellulose (Lee et al. 2002).
The surface morphologies of the hemicellulose and its residue are given in Figs. 8d and 8h, respectively. The hemicellulose, with a cotton-shaped surface and large fragment of broken cell walls, had a rough, unordered, and floc-covered residue surface after liquefaction. This showed that the completely liquefied hemicellulose residue did not contain the hemicellulose that originally participated in the reaction. Hemicellulose easily absorbed solvents because of its large specific surface area (Zhang et al. 2011), so its liquefaction rate was faster than that of cellulose.
Figure 8a shows that there was an orderly fiber arrangement, smooth surface, and compact structure in the corn stalk. In contrast, the corn stalk residues (Fig. 8e) exhibited a disorganized, rough, irregular, and granulated morphology, and featured non-crosslinking, as well as loose particles (Pan et al. 2007). Char might have been produced from the condensation of the MWL and plant fiber (Zhang et al. 2018). It was possible that the fibrous structure of the corn stalk was destroyed and basically liquefied.
Effect of the Biomass Components on Liquefaction
Table 2 shows that the residue yields were 0.62%, 14.56%, 1.98%, and 1.29%, when corn stalk, cellulose, hemicellulose, and MWL were used as liquefaction raw materials during acid catalysis with polyhydric alcohols, respectively. That is, the liquefaction yield from the corn stalk was the highest, while the yield from the hemicellulose was the lowest. The contribution of each component to the distribution of compounds in the liquefaction residue from the corn stalk was different. Hemicellulose contributed most to the production of ketones, aldehydes, and alcohols. Cellulose produced more small molecules, such as furans and alcohols. MWL pyrolysis mainly produced phenols and aromatics (Lv and Wu 2012). This was consistent with the Py-GC/MS analysis results. When corn stalk was liquefied, there was a complex promotion or inhibition relationship between the single components (Hosoya et al. 2007). Moreover, inorganic elements in the corn stalk might have played a catalytic role during liquefaction (Lv et al. 2013). These factors may have caused the liquefaction yield from the corn stalk to be higher than from the biomass components. At lower temperatures, cellulose was difficult to liquefy, while hemicellulose easily liquefied. However, at higher temperatures, cellulose could be liquefied and hemicellulose easily regenerated to form an insoluble residue (Zhang et al. 2006). This was the reason for the low liquefaction yield from the hemicellulose.
Table 2. Liquefaction Residue Yield of Each Component at the Optimum Conditions

CONCLUSIONS
- When corn stalk was liquefied under optimal conditions, hemicellulose and milled wood lignin (MWL) were more easily degraded than cellulose during liquefaction with polyhydric alcohols and acid catalysts. However, at higher temperatures, small molecules degraded by liquefaction of hemicellulose were most likely to repolymerize into hemicellulose derivatives which could resulted in the highest yield of hemicellulose residues.
- The pyrolysis behaviors of the residues produced from the corn stalk were similar when compared with the residues from the three major components during the liquefaction process. This suggested that the corn stalk liquefaction residues might have been generated from polycondensates or were derivatives of these interactions between small molecules of MWL or unreacted hemicellulose and cellulose. At the same time, it was indicated that the macromolecular substances originated from the reactions of the degradation products from the biomass components and PG/DEG.
ACKNOWLEDGMENTS
This project was financially supported by the National Key R&D Program of China (No. 2017YFB0307901) and the National Natural Science Foundation of China (NSFC) (No. 21576213).
REFERENCES CITED
Abdou, E. S., Nagy, K. S., and Elsabee, M. Z. (2008). “Extraction and characterization of chitin and chitosan from local sources,” Bioresour. Technol. 99(5), 1359-1367. DOI: 10.1016/j.biortech.2007.01.051
Boissou, F., Mühlbauer, A., De Oliveira Vigier, K., Leclercq, L., Kunz, W., Marinkovic, S., Estrine, B., Nardello-Rataj, V., and Jérôme, F. (2014). “Transition of cellulose crystalline structure in biodegradable mixtures of renewably-sourced levulinate alkyl ammonium ionic liquids, γ-valerolactone and water,” Green Chem. 16(5), 2463-2471. DOI: 10.1039/C3GC42396D
Cheng, K., Winter, W. T., and Stipanovic, A. J. (2012). “A modulated-TGA approach to the kinetics of lignocellulosic biomass pyrolysis/combustion,” Polym. Degrad. Stabil. 97(9), 1606-1615. DOI: 10.1016/j.polymdegradstab.2012.06.027
Connors, W. J., Johanson, L. N., Sarkanen, K. V., and Winslow, P. (1980). “Thermal degradation of kraft lignin in tetralin,” Holzforschung 34, 29-37. DOI: 10.1515/hfsg.1980.34.1.29
Hosoya, T., Kawamoto, H., and Saka, S. (2007). “Cellulose-hemicellulose and cellulose-lignin interactions in wood pyrolysis at gasification temperature,” J. Anal. Appl. Pyrol. 80(1), 118-125. DOI: 10.1016/j.jaap.2007.01.006
Jindal, M. K., and Jha, M. K. (2016). “Effect of process parameters on hydrothermal liquefaction of waste furniture sawdust for bio-oil production,” RSC Adv. 6(48), 41772-41780. DOI: 10.1039/C6RA02868C
Kormin, S., and Rus, A. Z. M. (2017). “Preparation and characterization of biopolyol from liquefied oil palm fruit waste: Part 2,” Mater. Sci. Forum. 882, 113-118. DOI: 10.4028/www.scientific.net/MSF.882.113
Lee, S.-H., Teramoto, Y., and Shiraishi, N. (2002). “Biodegradable polyurethane foam from liquefied waste paper and its thermal stability, biodegradability, and genotoxicity,” J. Appl. Polym. Sci. 83(7), 1482-1489. DOI: 10.1002/app.10039
Lee, S.-H., Yoshioka, M., and Shiraishi, N. (2000a). “Liquefaction and product identification of corn bran (CB) in phenol,” J. Appl. Polym. Sci. 78(2), 311-318. DOI: 10.1002/1097-4628(20001010)78:2<311::AID-APP110>3.0.CO;2-N
Lee, S.-H., Yoshioka, M., and Shiraishi, N. (2000b). “Liquefaction of corn bran (CB) in the presence of alcohols and preparation of polyurethane foam from its liquefied polyol,” J. Appl. Polym. Sci. 78(2), 319-325. DOI: 10.1002/1097-4628(20001010)78:2<319::AID-APP120>3.0.CO;2-Z
Li, S., Lyons-Hart, J., Banyasz, J., and Shafer, K. (2001). “Real-time evolved gas analysis by FTIR method: An experimental study of cellulose pyrolysis,” Fuel 80(12), 1809-1817. DOI: 10.1016/S0016-2361(01)00064-3
Li, Y., Li, B., Du, F., Wang, Y., Pan, L., and Chen, D. (2017). “Microwave-assisted hydrothermal liquefaction of lignin for the preparation of phenolic formaldehyde adhesive,” J. Appl. Polym. Sci. 134(10). DOI: 10.1002/app.44510
Lv, G., and Wu, S. (2012). “Analytical pyrolysis studies of corn stalk and its three main components by TG-MS and Py-GC/MS,” J. Anal. Appl. Pyrol. 97, 11-18. DOI: 10.1016/j.jaap.2012.04.010
Lv, G., Wu, S., Yang, G., Chen, J., Liu, Y., and Kong, F. (2013). “Comparative study of pyrolysis behaviors of corn stalk and its three components,” J. Anal. Appl. Pyrol. 104, 185-193. DOI: 10.1016/j.jaap.2013.08.005
Pan, H., Shupe, T. F., and Hse, C.-Y. (2007). “Characterization of liquefied wood residues from different liquefaction conditions,” J. Appl. Polym. Sci. 105(6), 3739-3746. DOI: 10.1002/app.26435
Putro, J. N., Soetaredjo, F. E., Lin, S.-Y., Ju, Y.-H., and Ismadji, S. (2016). “Pretreatment and conversion of lignocellulose biomass into valuable chemicals,” RSC Adv. 6(52), 46834-46852. DOI: 10.1039/C6RA09851G
Schulzke, T., Iakovleva, A., Cao, Q., Conrad, S., Zabelkin, S., and Grachev, A. (2018). “Polyurethane foams produced from pyrolysis oil-production and possible application,” Biomass Bioenerg. 115, 195-202. DOI: 10.1016/j.biombioe.2018.04.006
Segal, L., Creely, J. J., Martin Jr., A. E., and Conrad, C. M. (1959). “An empirical method for estimating the degree of crystallinity of native cellulose using the X-ray diffractometer,” Text. Res. J. 29(10), 786-794. DOI: 10.1177/004051755902901003
Tan, H., Wang, S.-R., Luo, Z.-Y., and Cen, K.-F. (2006). “Pyrolysis behavior of cellulose, xylan and lignin,” J. Fuel Chem. Technol. 34, 61-65.
Varhegyi, G., Antal Jr., M. J., Szekely, T., and Szabo, P. (1989). “Kinetics of the thermal decomposition of cellulose, hemicellulose, and sugarcane bagasse,” Energ. Fuel. 3(3), 329-335. DOI: 10.1021/ef00015a012
Wada, M., Kondo, T., and Okano, T. (2003). “Thermally induced crystal transformation from cellulose Iα to Iβ,” Polym. J. 35(2), 155-159. DOI: 10.1295/polymj.35.155
Wang, G., Li, W., Li, B., and Chen, H. (2008). “TG study on pyrolysis of biomass and its three components under syngas,” Fuel 87(4-5), 552-558. DOI: 10.1016/j.fuel.2007.02.032
Yamada, T., Aratani, M., Kubo, S., and Ono, H. (2007). “Chemical analysis of the product in acid-catalyzed solvolysis of cellulose using polyethylene glycol and ethylene carbonate,” J. Wood Sci. 53(6), 487-493. DOI: 10.1007/s10086-007-0886-8
Yamada, T., and Ono, H. (1999). “Rapid liquefaction of lignocellulosic waste by using ethylene carbonate,” Bioresour. Technol. 70(1), 61-67. DOI: 10.1016/S0960-8524(99)00008-5
Yan, L., Cui, Y., Gou, G., Wang, Q., Jiang, M., Zhang, S., Hui, D., Gou, J., and Zhou, Z. (2017). “Liquefaction of lignin in hot-compressed water to phenolic feedstock for the synthesis of phenol-formaldehyde resins,” Compos. Part B-Eng. 112, 8-14. DOI: 10.1016/j.compositesb.2016.10.094
Yan, Y., Xu, J., Li, T., and Ren, Z. (1999). “Liquefaction of sawdust for liquid fuel,” Fuel Process. Technol. 60(2), 135-143. DOI: 10.1016/S0378-3820(99)00026-0
Yip, J., Chen, M., Szeto, Y. S., and Yan, S. (2009). “Comparative study of liquefaction process and liquefied products from bamboo using different organic solvents,” Bioresour. Technol.100(24), 6674-6678. DOI: 10.1016/j.biortech.2009.07.045
Yoshida, C., Okabe, K., Yao, T., Shiraishi, N., and Oya, A. (2005). “Preparation of carbon fibers from biomass-based phenol-formaldehyde resin,” J. Mater. Sci. 40(2), 335-339. DOI: 10.1007/s10853-005-6087-1
Zhang, H., Pang, H., Shi, J., Fu, T., and Liao, B. (2012). “Investigation of liquefied wood residues based on cellulose, hemicellulose, and lignin,” J. Appl. Polym. Sci. 123(2), 850-856. DOI: 10.1002/app.34521
Zhang, H., Pang, H., Shi, J., and Liao, B. (2011). “Thermogravimetric behavior of biochemical biomass components and their liquefaction residues,” Chem. Ind. Eng. Prog. 30(10), 2194-2198. DOI: 10.16085/j.issn.1000-6613.2011.10.003
Zhang, H. R., Pang, H., Shi, J. Z., and Liao, B. (2011). “TG study on major biomass components and its liquefied residues from pyrolysis,” Chemical Industry & Engineering Progress30(10), 2194-2198. DOI: 10.1016/B978-0-444-53599-3.10005-8
Zhang, T., Zhou, Y., Zhang, J., and Liu, D. (2006). “Mild liquefaction behavior of various lignocellulosic raw materials,” Journal of Tsinghua University 46(12), 2011-2014. DOI: 10.16511/j.cnki.qhdxxb.2006.12.016
Zhang, Y., Liu, Z., Hui, L. F., and Wang, H. M. (2018). “Diols as solvent media for liquefaction of corn stalk at ambient pressure,” BioResources 13(3), 6818-6836. DOI: 10.15376/biores.13.3.6818-6836
Zhao, L., Wang, Y., and Li, W. (2016). “Nitrogen(N)-doped activated carbon materials with a narrow pore size distribution derived from coal liquefaction residues as low-cost and high-activity oxygen reduction catalysts in alkaline solution,” RSC Adv. 6(93), 90076-90081. DOI: 10.1039/C6RA17049H
Article submitted: October 28, 2018; Peer review completed: January 13, 2019; Revised version received: January 29, 2019; Accepted: February 5, 2019; Published: February 13, 2019.
DOI: 10.15376/biores.14.2.2684-2706
APPENDIX
Table A1. Comparison of Main Chemical Components of Corn Stalk and its Three Main Components

Note: this only showed the peak area of the compound group, – indicating that the compound was not detected.
Table A2. Comparison of Main Chemical Components of Four Kinds of Residues