
Abstract
Three kinds of softwoods (Douglas fir, radiata pine, and Sugi) were used to test the possibility of their classification via near infrared (NIR) spectroscopy. In a previous study, the authors presented that the content of Korean softwood extractives (larix, red pine, Korean pine, cedar, and cypress) influenced wood classification. For expanding the extent of wood species to be considered in the analysis, three foreign wood species were newly introduced. Prior to comparing the NIR spectra obtained from the three softwoods, principal component analysis (PCA) was conducted to evaluate the possibility of discriminating the three foreign softwoods. The three species were also divided into three groups based on PCA, and a thin-layer chromatography (TLC) test improved the reliability of NIR-based wood classification via extractive contents. A similar pattern was obtained for alcohol-benzene eluted extractive compounds between same wood species.
Download PDF
Full Article
Classification of Softwoods using Wood Extract Information and Near Infrared Spectroscopy
Se-Yeong Park,a Jong-Hwa Kim,b Jong-Chan Kim,c Sang-Yun Yang,b Hwanmyeong Yeo,c,d and In-Gyu Choi c,d,*
Three kinds of softwoods (Douglas fir, radiata pine, and Sugi) were used to test the possibility of their classification via near infrared (NIR) spectroscopy. In a previous study, the authors presented that the content of Korean softwood extractives (larix, red pine, Korean pine, cedar, and cypress) influenced wood classification. For expanding the extent of wood species to be considered in the analysis, three foreign wood species were newly introduced. Prior to comparing the NIR spectra obtained from the three softwoods, principal component analysis (PCA) was conducted to evaluate the possibility of discriminating the three foreign softwoods. The three species were also divided into three groups based on PCA, and a thin-layer chromatography (TLC) test improved the reliability of NIR-based wood classification via extractive contents. A similar pattern was obtained for alcohol-benzene eluted extractive compounds between same wood species.
Keywords: Near-infrared spectroscopy; Chemical composition; Extractive; Principal component analysis; Wood classification
Contact information: a: Department of Forest Biomaterials Engineering, Kangwon National University, Chuncheon 24341, South Korea; b: Department of Forest Sciences, College of Agriculture and Life Sciences, Seoul National University, Seoul 08826, South Korea; c: Department of Agriculture, Forestry, and Bioresources, College of Agriculture and Life Sciences, Seoul National University, Seoul 08826, Korea; d: Research Institute of Agriculture and Life Sciences, College of Agriculture and Life Sciences, Seoul National University, Seoul 08826, South Korea;
* Corresponding author: cingyu@snu.ac.kr
GRAPHICAL ABSTRACT
INTRODUCTION
The utilization of eco-friendly materials in daily life is attracting increasing attention because of worldwide environmental regulations. Among the variety of environmentally friendly materials, wood is a natural material with growing use not only for architecture and furniture but also as an alternative to petroleum-based resource materials (Zhu et al. 2016; Ramage et al. 2017). This environmental perception-accelerated movement toward utilizing natural raw materials to manufacture wood-based products is emerging worldwide, especially in countries that produce wood at low prices, and this trend is growing exponentially (Hetemäki and Hurmekoski 2016). In contrast, the increase in the volume of trades involving wood has stimulated several problems in the actual distribution process. Wood is classified according to the purpose of its use, and there are instances where low-grade wood is imported or a different species of wood is introduced during the actual distribution process. Despite various regulations, it is crucial to identify these issues in the field, thereby justifying the need to check the information regarding wood in real time.
Wood, which is composed of cellulose, hemicellulose, lignin, and extractives as main chemical components, is known as an anisotropic material with hierarchically porous structure (Chen et al. 2020). Woods have intrinsic cellular structures and chemical compositions depending on species. However, even if it is the same species, its properties considerably vary because of the growth conditions involving temperature, nutrients, rainfall amounts, etc. (Kariuki et al. 2006; Baribault et al. 2012; Jamrogiewicz 2012; Chi et al. 2015; Porep et al. 2015). These conditions can affect the mechanical and chemical properties of the wood. Additionally, these properties of wood can be understood based on expertise. However, receiving these data requires expert skill and takes long times, making it difficult to collect real-time information on site.
Near-infrared (NIR) spectroscopy is widely used for analyzing the quality and chemical constituent exploration in real time in various fields such as agriculture, food, and medicine (Marzena 2012; dos Santos et al. 2013; Jan et al. 2015). It is also being increasingly used for the rapid and non-destructive analysis of the properties of wood, regardless of proficiency, compared to the conventional wet analysis methods (Russ et al. 2009; Tsuchikawa and Kobori 2015). Over the past few years, the authors collected real-time information on wood analysis using NIR spectroscopy. In particular, the authors’ research group reported the analyses of the physical and chemical properties of Korean coniferous species used as interior and exterior materials in architecture, leading to automatic classification of the species (Kwon et al. 2017, 2019; Park et al. 2017, 2018; Yang et al. 2017, 2019a,b; Yeon et al. 2019; Yang et al. 2020). The Korean species used in the study were derived not only from one specific region but also from various latitudinal regions within Korea, and involved Larix kaempferi (Larch), Pinus densiflora (red pine), Pinus koraiensis (Korean pine), Cryptomeria japonica (cedar), and Chamaecyparis obtuse (cypress). According to the previous work, these five species have been classified into (1) larch, (2) red pine/Korean pine, and (3) cedar/cypress using NIR spectroscopy, and this allocation was reported to be influenced by the differences in absorption spectral regions associated with lignin with the extractives (Park et al. 2017, 2018). Yeon et al. (2019) used thin-layer chromatography (TLC) to demonstrate the presence of three clusters, previously observed by NIR spectroscopy, in the ethanol-benzene extracts used in wood chemical analysis.
Expanding on the authors’ previous work, this study aims to conduct further research on similar coniferous species outside Korea. In addition to the five Korean softwoods, Douglas fir, Japanese cedar, and radiata pine with a high volume of distribution (trade) were added as new official species; however, they had not yet been evaluated to determine whether they can be classified among the Korean species.
EXPERIMENTAL
Materials
Douglas fir (Pseudotsuga menziesii, Timberwest Forest Corp., Vancouver, Canada), radiata pine (Pinus radiata, Tenco Limited Co. Ltd., Rotorua, New Zealand), and Sugi (Cryptomeria japonica, Hano Shoten Co. Ltd., Kasuyamachi, Japan) were purchased from the National Forestry Cooperative Federation (KNFCF) in South Korea. The size of each lumber piece used in study was 50 × 100 × 600 mm3 (thickness × width × length), and 50 samples were prepared for each species. Then, each sample was sawn five times at 2 mm intervals using a saw machine (2012NB model, Makita, Aichi, Japan). A total of 250 sawdust samples were prepared from each species. The sawdust was ground and filtered through a 40-mesh sieve. The collected powder was stored at room temperature in a sealed plastic bag.
Methods
Near-infrared (NIR) spectrum acquisition
The NIR spectra of 750 powder samples (250 per species) were obtained using a SpectraStar 2600 XL instrument (Unity Scientific, Milford, MA, USA). The powder samples were placed in a cup holder (diameter × length, 100 × 50 mm2), and 12 scans were recorded per specimen. The wavelength range was set to 680 to 2600 nm at intervals of 1.0 nm. For spectra analysis, OMNIC 9.2 software (Thermo Scientific, Waltham, MA, USA) was used. Additionally, a Savitzky-Golay 2nd derivative (polynomial order: 3, smoothing point: 21) process was applied following the previous studies (Park et al. 2017, 2018)
Chemical composition analysis
Among all samples, the representative samples were selected prior to chemical composition analysis. It was difficult to obtain the chemical information of all samples by traditional chemical analysis. Mark and Tunnel (1985) reported that selection of representatives is available by dividing the cluster of samples with similar characteristics, which has been introduced as the Mahalanobis distance theory. From the authors’ previous study (Park et al. 2018), the species applied to the theory for selecting representative samples in Korean softwood was followed in this study. About 84 samples were selected as representatives (Douglas fir: 33, radiata pine: 27, and Sugi: 24).
The extractive contents were analyzed according to the National Renewable Energy Laboratory procedures (Sluiter et al. 2005, 2008). First, alcohol-benzene (1:2, v/v) mixture was used as a solvent to extract the extractive compounds such as fatty acids, flavonoids, terpenes etc. After the Soxhlet extraction at 80 °C for 6 h, the solution was concentrated to remove the solvent. The extractive content was calculated by the oven-dry weight.
The lignin content also was analyzed via the Klason lignin method. Approximately 0.3 g of wood powder was placed in a flask with 3 mL of 72% H2SO4 for 1 h at 30 °C. Next, 84 mL of distilled water was added to the flask, and the hydrolysis reaction was continued at 120 °C for 1 h. After the hydrolysis, the solid and liquid fractions were separated using an aspirator equipped with a glass filter. The weight of the solid residue obtained was the acid insoluble lignin, and the acid hydrolyzed solutes in the liquid fraction (acid-soluble lignin) were measured via an ultraviolet/visible (UV/Vis) spectrometer (UV-1601PC, Shimadzu, Kyoto, Japan).
Classification via principal component analysis
Principal component analysis (PCA) is an important mathematical tool for probing spectral differences among the sample spectra. More specifically, the score plot of the first principal component (PC1) and the second principal component (PC2) was based on the PCA, and it was used to observe the clusters in the selected samples. In this study, Unscrambler software (CAMO Analytics, CAMO 9.7, Oslo, Norway) was used for the multicomponent analysis with the PCA. To improve the spectral errors, a spectral transformation was performed using the Savitzky-Golay 2nd derivative (polynomial order: 3, smoothing point: 21).
Thin-layer chromatography analysis
Thin-layer chromatography (TLC) method was carried out to compare the extractive compounds visually in wood species. Alcohol-benzene extracts were used as eluent. Silica gel 60 plate was used as stationary phase, while 2:1 (v/v) hexane-ethyl acetate mixture was used as mobile phase. After elution, the plate was dried and the compounds were observed using ultraviolet (UV) light at 254 nm and 354 nm wavelengths.
RESULTS AND DISCUSSION
NIR Spectra Analysis
The NIR spectra of 750 samples of three species were collected. The results are presented in Fig. 1.
Figure 1(A) shows the raw spectra of all samples, and there are no spectral differences among the three species. For clearer interpretation, a spectral transformation was applied using the Savitsky-Golay 2nd derivative. After data processing, the changes in the spectral regions from 1600 to 1800 nm were observed. The results are presented in Fig. 1(B). The spectral peaks were assigned to the extractive and lignin bonds for wood. The distinct differences are attributed to the first overtone of the C-H bond, which originates from the –CH2, –CH3, and the =CH2 bonds found in aromatic compounds (Baillèresa et al. 2002; Fujimoto et al. 2007; Schwanninger et al. 2011). Wood also contains hemicellulose and cellulose, which can be observed in the spectral range of 2100 to 2400 nm. However, the region that originated from the components could not be clearly identified in this study. Therefore, to gather additional key factors for classification, the authors focused on a certain range of the spectral region that originated from lignin and extractives.

|
| Fig. 1. NIR spectra of all samples: (A) Raw spectra; and (B) 2nd derivative spectra |
Chemical Information of Selected Samples via PCA
Some specific samples were selected in order to isolate the representative samples because analyzing all 750 samples would have been difficult. Based on the Mahalanobis distance theory, a total of 84 samples were selected, and accordingly the chemical composition of the wood powders was analyzed for the three species.
In the case of Douglas fir, the extractives content ranged from 1.3% to 5.9%, and the lignin content ranged from 26.2% to 31.4%, respectively. Meanwhile, the extractive contents of radiata pine were observed to be higher than other species, ranging from 1.2% to 18.1%. In the authors’ previous study, the authors observed similar results using the Korean pine and red pine (Park et al. 2018). Pine species are commonly known to comprise large amounts of viscous extractives such as resins, which can possess distinct characteristics from other species (Ekeberg et al. 2006). The lignin content, which was also related to extractive contents, was identified to be within a broad range from 23% to 39.0%. For Sugi, the content of extractive ranged from 1.0% to 5.7%, whereas that of lignin ranged from 34.6% to 37.1%.


(A) Fig. 2 (part A). PCA analysis score plots based on NIR spectra: (A): raw spectra; (B): 2nd derivative spectra realized by removing the measurement limit of the instrumentation and the moisture; (C): 2nd derivative spectra of the three foreign softwoods and five Korean softwoods, and (D): 2nd derivative spectra of the 3 species in Group 3 (the graphs were partially referred from Park et al. (2018) |

(B) (C) |

(D) |
 |
| Fig. 2. PCA analysis score plots based on NIR spectra: (A): raw spectra; (B): 2nd derivative spectra realized by removing the measurement limit of the instrumentation and the moisture; (C): 2nd derivative spectra of the three foreign softwoods and five Korean softwoods, and (D): 2nd derivative spectra of the 3 species in Group 3 (the graphs were partially referred from Park et al. (2018) |
Wood Classification via PCA
The selected 84 samples of the three wood species were subjected to PCA analysis. The subsequent results of the same are illustrated in Fig. 2. Meanwhile, Fig. 2(A) was evaluated using raw spectra of the three species, which did not exhibit any distinctive difference. Therefore, a spectral transformation was further applied to remove errors (limitation of the instrumentation and moisture) that may occur during measurement of the raw spectrum via NIR spectroscopy. The authors also conducted a mathematical treatment to improve the results by removing the moisture (1380 to 1480 nm) part and the measurement limit part (1830 to 1950 nm) of the instrumentation. In addition, the 2nd derivative pretreatment was also applied. In this way, the 84 samples were clearly divided into three groups on the basis of the respective species as shown in Fig. 2(B).
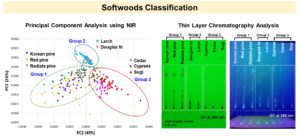
In the authors’ previous study, it was presented how the NIR-based classification of the Korean softwoods (larix, red pine, Korean pine, cedar, and cypress) was possible on the basis of their chemical compositions (Park et al. 2018). To expand the extent of the wood species, Douglas fir, radiata pine, and Sugi were additionally introduced in this study. Figure 2(C) shows the PCA results using eight softwoods. On the basis of the PCA result of the selected eight softwood samples, they were divided into three groups with similar chemical properties. In particular, the three added species (Douglas fir, radiata pine, and Sugi) exhibited PCA distribution results similar to the five Korean softwoods used in the previous research. These precisely included the following: Group 1: Korean pine, red pine, and radiata pine; Group 2: larch and Douglas fir; and Group 3: cedar, cypress, and Sugi. After PCA analysis of all species, cluster with unclear boundaries between similar species may appear. Although it was difficult to clearly discriminate the 3 species in Group 3, it can be confirmed that classification is possible by performing additional PCA analysis with only those species. Based on these results, the spectral patterns and the wood compositions were compared for a more detailed interpretation on how the eight species are distinguished by NIR.
 |
| Fig. 3. 2nd Derivative spectra of the eight softwoods after removing the measurement limit of the instrumentation and the moisture; the graphs were partially referred from the authors’ previous paper, Park et al. 2018. |
NIR Spectra Interpretation
As shown in Fig. 3, three clusters were observed on the PCA of the eight softwood species. To compare the spectral differences between the divided samples, the authors used 2nd derivative spectra of the respective species.
On the basis of the comparison, it was found that Korean pine, red pine, and radiata pine exhibited similar patterns on the spectra, which were classified as Group 1. In addition, larch and Douglas fir as well as cedar, cypress, and Sugi, which were previously divided into Groups 2 and 3, respectively, also showcased similar results. It was observed that there were differences in the spectra between the groups in specific regions: 900 to 1300, 1600 to 1800, and 2000 to 2200 nm. The peaks observed in these spectral regions are a result of the bonding patterns originating from the double-bonded carbon or methyl group in wood, especially from extractives. As a result, the factors affecting the discrimination have been classified on the basis of the species containing similar extractives.
Wood Classification via TLC Test
The effect of the extractive contents on the discrimination of eight softwoods was ascertained to be important, and therefore, the distribution of extractives obtained from wood powder was also tested using the TLC analysis.
The TLC analysis is a conventional method used for identifying a variety of organic compounds on the basis of their absorption capability in the stationary phase, such as silica gel, cellulose, and alumina. In particular, wood extractive compounds are commonly evaluated via the TLC test before their use and application in pharmaceutical, food, and cosmetic industries.

Fig. 4. TLC images of eight softwood extractives (visualized at UV-254 nm (A), 365 nm (B)); TLC analysis was partially referred from our previous paper, Yeon et al. 2019
In this study, an alcohol-benzene mixture was used to extract the soluble organic compounds for visible observation on the TLC plate. Alcohol-benzene extraction is widely applied for removing the extractive compounds in plants for facilitating chemical compositional analysis. In previous results, it was found that the wood extractive content affected the NIR-based classification of wood species. Therefore, the TLC test was conducted to present the evidence between the eight softwoods.
As shown in Fig. 4, Groups 1, 2, and 3 indicate similar spot patterns on the TLC plate. In particular, spots in case of Group 1, including Korean pine, red pine, and radiata pine, moved to the top, followed by the mobile phase (ethyl acetate: hexane – 1:2, v/v), at both 254 nm and 365 nm. It was assumed that the three kinds of softwoods have more non-polar compounds compared to the other softwood types. Pine species are commonly known to possess greater amount of resins, such as fatty acids, which have affinity with non-polar solvents (Piispanen and Saranpää 2002; Nisula 2018). Therefore, TLC spot movement of the three respective pines in Group 1 was observed more than those of the other species. Meanwhile, in case of Group 3, cypress, cedar, and Sugi did not show any spot movement at 254 nm. However, some spots were observed, which simply absorbed the light at 354 nm wavelength. Therefore, the authors decided to conduct a spot check on the TLC plate at different wavelengths to identify the discrimination.
CONCLUSIONS
- The results from analyzing the chemical properties of the three wood species designed for the classification of coniferous trees using the near infrared (NIR) technique, there was a large difference observed in the contents of extracts and lignin.
- On the basis of the principal component analysis (PCA) results, the eight Korean and foreign species analyzed were divided into three groups: Group 1: Korean pine/red pine/radiata pine; Group 2: Douglas fir/larch; and Group 3: cypress/cedar/Sugi. Furthermore, each species in the cluster could be classified by additional PCA processing.
- Through the TLC analysis, it was demonstrated that the contents and types of extractives are the key factors necessary for distinguishing the respective softwood species from each other. In particular, the distinction was most clearly observed in case of the pine species with high resin content. These results will act as important data for the classification of softwood species using the NIR technique.
ACKNOWLEDGEMENTS
This research was financially supported by the Forest Science and Technology Projects (Project No 2016009C10-1919-AB01) and funded by the Korea Forest Service.
REFERENCES CITED
Baillèresa, H., Davrieuxa, F., and Ham-Pichavantb, F. (2002). “Near infrared analysis as a tool for rapid screening of some major wood characteristics in a eucalyptus breeding program,” Annals of Forest Science 59(5-6), 479-490. DOI: 10.1051/forest:2002032
Baribault, T. W., Kobe, R. K., and Finley, A. O. (2012). “Tropical tree growth is correlated with soil phosphorus, potassium, and calcium, though not for legumes,” Ecological Monographs 82(2), 189-203. DOI: 10.1890/11-1013.1
Chen, C., Kuang, Y. D., Zhu, S. Z., Burgert, I., Tobias, K., Gong, A., Li, T., Berglund, L., Eichhorn, S. J., and Hu, L. B. (2020). “Structure–property–function relationships of natural and engineered wood,” Natural Review Materials 5(9), 642-666. DOI: 10.1038/s41578-020-0195-z
Chi, X., Tang, Z., Xie, Z., Guo, Q., Zhang, M., Ge, J., Xiong, G., and Fang, J. (2015). “Effects of size, neighbors, and site condition on tree growth in a subtropical evergreen and deciduous broad-leaved mixed forest, China,” Ecology and Evolution 5(22), 5149-5161. DOI: 10.1002/ece3.1665
dos Santos, C. A. T., Lopo, M., Páscoa, R.N. M. J., and Lopes, J. A. (2013). “A review on the applications of portable near-infrared spectrometers in the agro-food industry,” Applied Spectroscopy 67(11), 1215-1233. DOI: 10.1366/13-07228
Ekeberg, D., Flaete, P. O., Eikenes, M., Fongen, M., and Naess-Andresen, C. F. (2006). “Qualitative and quantitative determination of extractives in heartwood of Scots pine (Pinus sylvestris L.) by gas chromatography,” Journal of Chromatography A 1109(2), 267-72. DOI: 10.1016/j.chroma.2006.01.027
Fujimoto, T., Yamamoto, H., and Tsuchikawa, S. (2007). “Estimation of wood stiffness and strength properties of hybrid larch by near-infrared spectroscopy,” Applied Spectroscopy 61(8), 882-888. DOI: 10.1366/000370207781540150
Hetemäki, L., and Hurmekoski, E. (2016). “Forest products markets under change: Review and research implications,” Current Forestry Report 2, 177-188. DOI: 10.1007/s40725-016-0042-z
Jamrogiewicz, M. (2012). “Application of the near-infrared spectroscopy in the pharmaceutical technology,” Journal of Pharmaceutical and Biomedical Analysis 66, 1-10. DOI: 10.1016/j.jpba.2012.03.009
Kariuki, M., Rolfe, M., Smith, R. G. B., Vanclay, J. K., and Kooyman, R. M. (2006). “Diameter growth performance varies with species functional‐group and habitat characteristics in subtropical rainforests,” Forest Ecology Management 225(1-3), 1–14. DOI: 10.1016/j.foreco.2005.07.016
Kwon, O., Lee, H. G., Lee, M. R., Jang, S., Yang, S. Y., Park, S. Y., Choi, I. G., and Yeo, H. (2017). “Automatic wood species identification of Korean softwood based on convolutional neural networks,” Journal of Korean Wood Science and Technology 45(6), 797-808. DOI: 10.5658/WOOD.2017.45.6.797
Kwon, O., Lee, H. G., Yang, S. Y., Kim, H., Park, S. Y., Choi, I. G., and Yeo, H. (2019). “Performance enhancement of automatic wood classification of Korean softwood by ensembles of convolutional neural networks,” Journal of Korean Wood Science and Technology 47(3), 265-276. DOI: 10.5658/WOOD.2019.47.3.265
Mark, H., and Tunnel, D. (1985). “Qualitative near-infrared reflectance analysis using Mahalanobis distances,” Analytical Chemistry 57(7), 1449-1456. DOI: 10.1021/ac00284a061
Nisula, L. (2018). Wood Extractives in Conifers – A Study of Stemwood and Knots of Industrially Important Species, Ph.D. Dissertation, Åbo Akademi University, Turku, Finland.
Park, S. Y., Kim, J. C., Kim, J. H., Yang, S. Y., Kwon, O., Yeo, H., Cho, K. C., and Choi, I. G. (2017). “Possibility of wood classification in Korean softwood species using near-infrared spectroscopy based on their chemical compositions,” Journal of Korean Wood Science and Technology 45(2), 202-212. DOI: 10.5658/WOOD.2017.45.2.202
Park, S. Y., Kim, J. C., Yeon, S., Yang, S. Y., Yeo, H., and Choi, I. G. (2018). “Rapid prediction of the chemical information of wood powder from softwood species using near-infrared spectroscopy,” BioResources 13(2), 2440-2451. DOI: 10.15376/biores.13.2.2440-2451
Piispanen, R., and Saranpää, P. (2002). “Neutral lipids and phospholipids in Scots pine (Pinus sylvestris) sapwood and heartwood,” Tree Physiology 22(9), 661-666. DOI: 10.1093/treephys/22.9.661
Porep, J. U., Kammerer, D. R., and Carle, R. (2015). “On-line application of near infrared (NIR) spectroscopy in food production,” Trends in Food Science and Technology 46(2) Part A, 211-230. DOI: 10.1016/j.tifs.2015.10.002
Ramage, M. H., Burridge, H., Busse-Wicher, M., Fereday, G., Reynolds, T., Shah, D. U., Wu, G., Yu, L., Fleming, P., Densley-Tingley, D., et al. (2017). “The wood from the trees: The use of timber in construction,” Renewable and Sustainable Energy Reviews 68(Part 1), 333-359. DOI: 10.1016/j.rser.2016.09.107
Russ, A., Fišerová, M., and Gigac, J. (2009). “Preliminary study of wood species identification by NIR spectroscopy,” Wood Research 54(4), 23-32.
Schwanninger, M., Rodrigues, J., and Fackler, K. (2011). “A review of band assignments in near infrared spectra of wood and wood components,” Journal of Near Infrared Spectroscopy 19(5), 287-308. DOI: 10.1255/jnirs.955
Sluiter, A., Ruiz, R., Scarlata, C., Sluiter, J., and Templeton, D. (2005). Determination of Extractives in Biomass (NREL/TP-510-42619), National Renewable Energy Laboratory, Golden, CO, USA.
Sluiter, A., Hames, B., Ruiz, R., Scarlata, C., Sluiter, J., Templeton, D., and Crocker, D. (2008). Determination of Structural Carbohydrates and Lignin in Biomass (NREL/TP-510-42618), National Renewable Energy Laboratory, Golden, CO, USA.
Tsuchikawa, S., and Kobori, H. (2015). “A review of recent application of near infrared spectroscopy to wood science and technology,” Journal of Wood Science 61, 213–220. DOI: 10.1007/s10086-015-1467-x
Yang, S. Y., Park, Y., Chung, H., Kim, H., Park, S. Y., Choi, I. G., Kwon, O., Cho, K. C., and Yeo, H. (2017). “Partial least squares analysis on near-infrared absorbance spectra by air-dried specific gravity of major domestic softwood species,” Journal of Korean Wood Science and Technology 45(4), 399-408. DOI: 10.5658/WOOD.2017.45.4.399
Yang, S. Y., Park, Y., Chung, H., Kim, H., Park, S. Y., Choi, I. G., Kwon, O. K., and Yeo, H. (2019a). “Soft independent modeling of class analogy for classifying lumber species using their near-infrared spectra,” Journal of Korean Wood Science and Technology 47(1), 101-109. DOI: 10.5658/WOOD.2019.47.1.101
Yang, S. Y., Lee, H. G., Park, Y., Chung, H., Kim, H., Park, S. Y., Choi, I. G., Kwon, O., and Yeo, H. (2019b). “Wood species classification utilizing ensembles of convolutional neural networks established by near-infrared spectra and images acquired from Korean softwood lumber,” Journal of Korean Wood Science and Technology 47(4), 385-392. DOI: 10.5658/WOOD.2019.47.4.385
Yang, S. Y., Kwon, O., Park, Y., Chun, H., Kim, H., Park, S. Y., Choi, I. G., and Yeo, H. (2020). “Application of neural networks for classifying softwood species using near infrared spectroscopy,” Journal of Near Infrared Spectroscopy (online published) DOI: 10.1177/0967033520939320
Yeon, S., Park, S. Y., Kim, J. H., Kim, J. C., Yang, S. Y., Yeo, H., Kwon, O., and Choi, I. G. (2019). “Effect of organic solvent extractives on Korean softwoods classification using near-infrared spectroscopy,” Journal of Korean Wood Science and Technology 47(4), 509-518. DOI: 10.5658/WOOD.2019.47.4.509
Zhu, H., Lue, W., Ciesielski, P. N., Fang, Z., Zhu, J. Y., Henriksson, G., Himmel, M. E., and Hu, L. (2016). “Wood-derived materials for green electronics, biological devices, and energy applications,” Chemical Reviews 116(16), 9305-3974. DOI: 10.1021/acs.chemrev.6b00225
Article submitted: February 21, 2021; Peer review completed: May 1, 2021; Revised version received: May 30, 2021; Accepted: June 1, 2021; Published: June 4, 2021.
DOI: 10.15376/biores.16.3.5301-5312