
Abstract
Depending on the different types of raw materials used to produce hanji, a Korean traditional handmade paper, there can be significant differences in the durability and mechanical properties of the final product. In this study, near-infrared spectroscopy (NIR) combined with multivariate statistical methods were used to confirm the classification possibility of hanji based on the various type of raw materials. The hanji papers were prepared from paper mulberry trees, cooking agents, and mucilage. Altogether, a total of 60 hanji spectra were collected by NIR. Then, the 60 spectra were grouped into four categories: the control, paper mulberry, cooking agent, and mucilage type based on each of the types of raw materials contained in the hanji. Three different classification algorithms – partial least squares discriminant analysis (PLS-DA), support vector machines (SVM), and random forest (RF) – were used to classify the hanji types. The best hanji material classification performance was obtained when the hanji samples were classified according to paper mulberry type, wherein the prediction accuracies of PLS-DA, SVM, and RF were 100%, 100%, and 98%, respectively. These results suggested that NIR in combination with multivariate statistical methods can be used for hanji material classification.
Download PDF
Full Article
Classification Option for Korean Traditional Paper Based on Type of Raw Materials, Using Near-infrared Spectroscopy and Multivariate Statistical Methods
Kyung Ju Jang,a,* Tae Young Heo,b and Seon Hwa Jeong a
Depending on the different types of raw materials used to produce hanji, a Korean traditional handmade paper, there can be significant differences in the durability and mechanical properties of the final product. In this study, near-infrared spectroscopy (NIR) combined with multivariate statistical methods were used to confirm the classification possibility of hanji based on the various type of raw materials. The hanji papers were prepared from paper mulberry trees, cooking agents, and mucilage. Altogether, a total of 60 hanji spectra were collected by NIR. Then, the 60 spectra were grouped into four categories: the control, paper mulberry, cooking agent, and mucilage type based on each of the types of raw materials contained in the hanji. Three different classification algorithms – partial least squares discriminant analysis (PLS-DA), support vector machines (SVM), and random forest (RF) – were used to classify the hanji types. The best hanji material classification performance was obtained when the hanji samples were classified according to paper mulberry type, wherein the prediction accuracies of PLS-DA, SVM, and RF were 100%, 100%, and 98%, respectively. These results suggested that NIR in combination with multivariate statistical methods can be used for hanji material classification.
Keywords: Hanji; Near-infrared spectroscopy (NIR); Partial least squares discriminant analysis (PLS-DA); Support vector machines (SVM); Random forest (RF)
Contact information: a: Restoration Technology Division, National Research Institute of Cultural Heritage, 132 Munji-ro, Yuseong-gu, Daejeon 34122, Korea; b: Department of Information and Statistics, Chungbuk National University, Chungdae-ro 1, Seowon-Gu, Cheongju, Chungbuk 28644, Korea;
* Corresponding author: jangrace1992@gmail.com
GRAPHICAL ABSTRACT
INTRODUCTION
Hanji, a Korean traditional handmade paper, can be used to restore and conserve cultural heritage in papers all around the world, not limited to Korea. Compared with other types of wood pulp — Hanji has longer and more robust fibers and can produce thin paper with high mechanical properties (Jeong et al. 2014). If it is correctly manufactured, the paper typically lasts for more than 1,000 years with significant durability (Seo and Jun 2007). The process of traditional hanji making can be roughly divided into four steps. 1) One-year-old paper mulberry (Broussonetia kazinoki Siebold) trees are stripped after steaming to obtain a white layer of bark. 2) The cut white barks are cooked with ash lye (burned using soybean, chili, or buckwheat stems) to remove non-cellulosic material, such as pectin and lignin. 3) To build even thickness throughout, the washed bark slurry is mixed with the mucilage from Hibiscus manihot L. to achieve a controlled rate of drainage during sheet formation. 4) Each sheet of paper manufactured with a unique technique is lifted out and dried on a drying panel (Lee 2011). These methods are historically preserved and handed down procedures that are still available and used to this day.
Traditionally, the raw materials of hanji consist of indigenous plants grown in Korea. In recent years, due to cost reduction and material shortages, the use of imported paper mulberry and chemical substitutes, such as sodium hydroxide (NaOH) and polyacrylamide (PAM), has increased (Cho et al. 2004).
However, the identification of hanji component materials (e.g., paper mulberry origin, cooking agents (alkali), and mucilage) by visual inspection is impossible. Furthermore, price differences may occur in the market based on which raw material is used, and the increased use of chemical substitutes can disrupt distribution orders and induce quality deterioration. In this context, qualitative and quantitative detection of the raw materials of hanji is vital to prevent the deterioration of the quality of hanji for the historical paper conservation. Near-infrared spectroscopy (NIR) combined with multivariate statistical methods can solve these detection problems. The NIR spectrum essentially provides a “fingerprint” for a given material, and raw materials can be classified through multivariate analysis of the NIR spectrum (Alexandre Marcelo et al. 2014). NIR is a widely used technique for non-destructively analyzing organic materials because it produces no toxic residues and is rapid, cheap, and allows for the simultaneous analysis and characterization of various components. NIR analysis covers the electromagnetic spectrum at 750 to 2,500 nm and is mainly related to hydrogen-containing groups such as C-H, N-H, and O-H (Feng et al. 2017). The clear absorption peaks of particular NIR region in terms of the hydroxyl group are observed by second derivatives, which make it very useful for analyzing hanji (Mitsui et al. 2008).
The classification technique using NIR spectroscopy and multivariate statistical methods can highlight spectral differences between similar samples, model systematic variances in data, and present data in a straightforward manner (Teye et al. 2014). NIR has been applied with multivariate statistical methods for classification of wood and pulp materials (Tsuchikawa and Kobori 2015). Antti et al. (1996) investigated the possibility to make predictions of mixtures of wood chips from three different wood species (Swedish pine, Swedish spruce, and Polish pine) using NIR and partial least squares (PLS). Brink et al. (2010) used NIR with PLS regression and principal component analysis (PCA) for on-site process predictions of aspen fiber and birch bark content in unbleached hardwood pulp. The predicted models were suitable for quality assessments rather than quantitative determination. Canals et al. (2008) also investigated the possibility of classification and identification of various paper finishes (coated, offset, and cast-coated). They applied infrared spectra processed with appropriate multivariate statistical methods.
Although the studies of multivariate statistical methods combined with NIR are increasing year by year to classify various wood and pulp products, the classification of traditional hanji paper using NIR combined with multivariate statistical methods, such as the partial least squares discriminant analysis (PLS-DA), support vector machine (SVM), and random forest (RF) algorithms, is a new challenge.
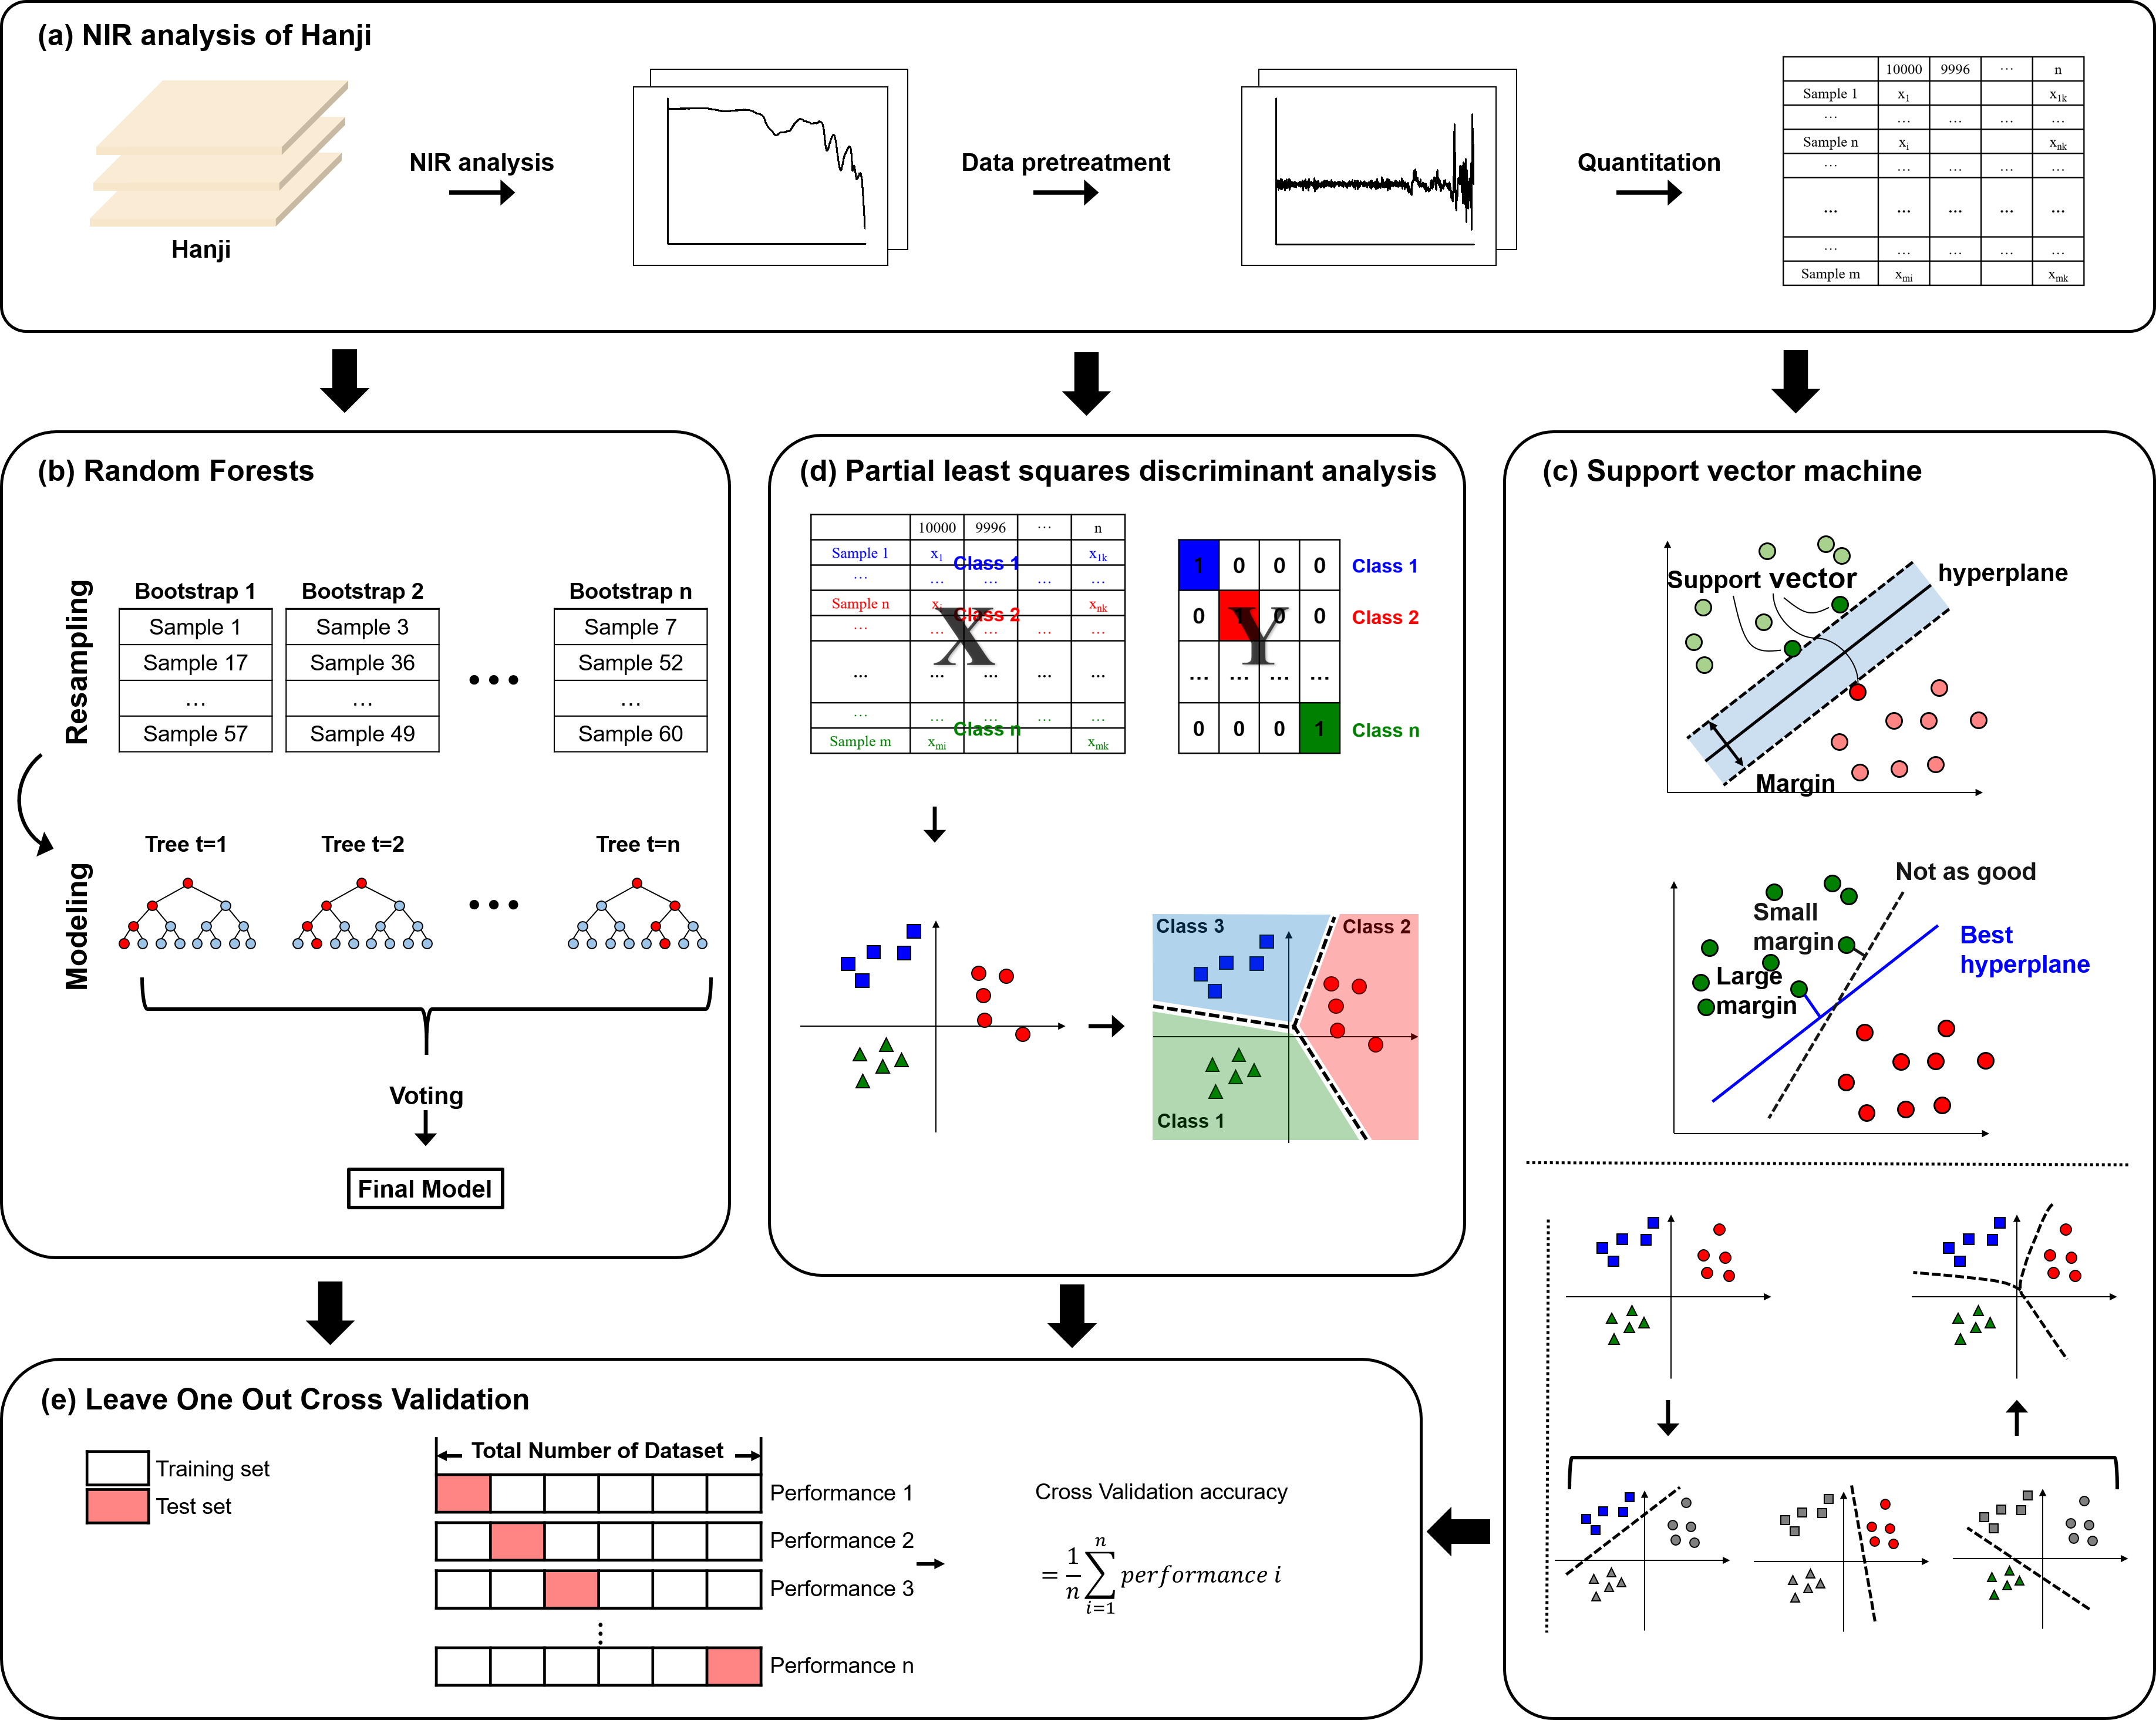
The authors ordered 12 types of hanji containing different raw materials under the process monitoring. To detect and classify hanji, 60 NIR spectra data were collected from these hanji papers. Then, PLS-DA, SVM, and RF algorithms were applied to classify the hanji materials. This study focused on a comparison of the three classification models’ potential as reliable and rapid methods for the classification analysis of component materials in hanji. Figure 1 shows a graphical presentation of the overall procedure the authors’ used to construct multivariate statistical models using hanji NIR data.

Fig. 1. Schematic diagram depicting the classification of hanji
EXPERIMENTAL
Preparation
To confirm whether the hanji samples could be classified based on three basic raw materials, 12 types of hanji samples with a weight of 15 g/m2 were prepared using various combinations of three basic raw materials: traditional or alternative (synthetic) materials of bast fibers, cooking agents, and mucilage. In this study, the bast fibers were derived from Korean paper mulberry (HongEun Seo, Uiseong, Korea) and Thai paper mulberry (Andong Hanji Co., Andong, Korea). The cooking agent, an alkali, consisted of ash from sesame straw (Andong Hanji Co., Andong, Korea), sodium hydroxide (NaOH) (Youngjin Co., Ltd., Bucheon, Korea), and sodium carbonate (Na2CO3) (OCI-SNF Co., Ltd., Seoul, Korea). The mucilage used were Hibiscus manihot L. (Andong Hanji Co., Andong, Korea) and polyacrylamide (PAM) (OCI-SNF Co., Ltd., Seoul, Korea). For analysis, five sheets of each of the 12 types of hanji samples were prepared (See Category 1 in Table 1).
NIR Analysis and Data Preprocessing
The NIR spectra of the hanji samples were performed by Fourier transform-near-infrared spectroscopy (FT-NIR; FT-NIR MPA; Bruker Optics Inc., Billerica, MA, USA) in diffuse reflectance mode.
Table 1. Summary of Categories and Classes by Type of Raw Materials using 60 Hanji for Classification

Note: n is the number of NIR spectra data of hanji
Every spectrum was recorded in the range of 10,000 to 4,000 cm−1 with a 4 cm−1 resolution, 32 scans, and air absorption was recorded as a reference standard. To eliminate undesired scatter effects, such as baseline shift and non-linearity, as much as possible, NIR spectra pre-processing steps were applied, such as the selection of a spectral range of 8,000 to 4,000 cm−1 and a fifth-order polynomial Savitzky–Golay second derivative.
Sample classification was performed with four approaches using the 60 hanji NIR spectra (Table 1). In the first approach, as a control, the objective was to determine whether each classification model could identify the type of raw material present in each hanji sample. Thus, 12 classes were established (n = 5 per class), adopted (Category 1), and named A to L based on the type of raw material present. In the second approach, the objective was to verify the models ability to distinguish the Korean vs. Thai paper mulberry present in the samples. Thus, two classes (n = 30 per class) were adopted (Category 2) and named M and N based on the type of raw material present. In the third approach, the authors’ sought to distinguish between the use of sesame straw, NaOH, and Na2CO3. Thus, three classes ((n = 20 per class) were adopted (Category 3) and named O, P, and Q based on the type of raw material present. In the fourth approach, the objective was to verify the models’ ability to distinguish Hibiscus manihot L. from PAM. Thus, two classes (n = 30 per class) were adopted (Category 4) and named R and S based on the type of raw material present.
Model Development
Three classification algorithms, partial least squares discriminant analysis (PLS-DA), support vector machine (SVM), and random forest (RF) were used for classification prediction. All data processing and classification were conducted using the R statistical software (R Core Team, ver. 3.4.1, Auckland, New Zealand).
The PLS-DA is a discriminant classifier that adapts PLS regression to optimize the separation between different groups of samples (Gromski et al. 2015). The PLS-DA is performed by linking two data matrices, X (i.e., spectroscopic data; sample readings) and Y (i.e., classes of interest; classification targets) (Lee et al. 2018a). The PLS-DA is based on the PLS2 algorithm that searches for latent variables with maximum covariance between the independent variables X and the corresponding dependent variable Y (Sun 2009). The PLS-DA model predicts the class for each sample and assigns a value of 1 or 0 depending on whether each sample belongs or does not belong to the class (Whei Miaw et al. 2018).
The SVM algorithm is a useful machine learning method used for both binary and multiclass classification (Mathur and Foody 2008). An SVM determines an optimal separating decision plane (hyperplane) such that the related margin between objective groups is maximized (Mancini et al. 2019). The X and Y variables are identical to those in the PLS-DA model.
The RF ensemble machine learning method is frequently employed toward multi-class classification (Bin et al. 2016). The RFs extend decision tree methods based on Classification and Regression Trees (CARTs) that grow multiple trees to form forests (Lee et al. 2013; Lee et al. 2018b). The RF algorithm uses a large number of unpruned decision trees, each of which emits a class prediction, and the class with the most votes becomes the prediction of the model (Statnikov et al. 2008). The X and Y variables are identical to those of PLS-DA and SVM.
Cross-validation
With all classification methods, a method of measuring generalization error through the use of holdout data, cross-validation was utilized (Xia et al. 2019). Of the many cross-validation techniques available, one of the most popular is leave-one-out cross-validation (LOOCV). The LOOCV is useful for small datasets because it removes a minimal amount of data from the training data at each iteration.
Confusion Matrix
A confusion matrix is used to visualize and evaluate the performance of a classification algorithms (Xu et al. 2020). The confusion matrix contains information about actual and predicted classifications results by a classification algorithm (Diez 2018; Tharwat 2018).
There are two types of classification problems, two-class (binary) classification and multi-class classification, correlated to the number of classes. The following Fig. 2 shows the confusion matrices and examples for a two-class classifier and multi-class classifier, respectively.

Fig. 2. Visualization of the confusion matrix for (a) the two-class classification and (b) multi-class classification with N classes (Abraham et al. 2019) and the examples with the author’s PLS-DA results for (c) category 2 and (d) category 3.
The model performance is evaluated using the count of true positive (TP), true negative (TN), false positive (FP), and false negative (FN) in a matrix. The entries in the confusion matrix have the following meaning. TP is the number of correct predictions that an instance is positive, TN is the number of correct predictions that an instance is negative, FP is the number of incorrect of predictions that an instance negative, and FN is the number of incorrect predictions that an instance is positive.
For example, FN is calculated as the sum of green color, i.e., FN in Fig. 2 (c) is 30, and FN in Fig. 2 (d) has different values from class A to class C; class A = 0 + 7=7; class B = 10 + 10=20; class C = 8 + 0=8.
The classification performance metrics can be calculated from the four outputs, TP, TN, FP, and FN, and are represented by scalar values such as accuracy, sensitivity, and specificity. Accuracy is indicated as a ratio between the correctly classified samples to the total number of samples. Sensitivity shows how well real samples are detected, whereas specificity shows how well the true negative condition is identified. The expressions to calculate accuracy (Eq. 1), sensitivity (Eq. 2) and specificity (Eq. 3) are presented below:

RESULTS AND DISCUSSION
NIR Data
Spectra were collected over the range of 10,000 to 4,000 cm-1. However, only 8,000 to 4,000 cm-1 spectra were used for analyses as the beginning and end parts of the spectra showed excessive noise caused by optical equipment and the ambient environment. Figure 3 shows the 60 original NIR spectra and the second-derivative NIR spectra of the hanji samples. No significant spectral difference could be found between each type of hanji sample with the naked eye. The hanji samples primarily consisted of wood components such as cellulose and hemicellulose.
In Fig. 3(a), the absorption bands mainly attributable to cellulose were observed at wavelengths of approximately 7,000 cm-1 (first overtone of O-H stretching), 6,720 cm-1 (first overtone of O-H stretching), 6,300 cm-1 (first overtone of O-H stretching), 5,600 cm-1 (first overtone of C-H stretching), 5,450 cm-1 (O-H stretching and second overtone of C-O stretching), 4,750 cm-1 (O-H stretching and C-H deformation), 4,404 cm-1 (C-H stretching and C-H deformation), and 4,280 cm-1 (C-H stretching and C-H deformation) in the hanji sample spectra.
The absorption band from hemicellulose was observed at wavelengths of approximately 7,300 cm-1 (C-H stretching and C-H deformation) and 5,860 cm-1 (first overtone of C-H stretching). The peak at 5,150 cm-1 (O-H stretching and second overtone of C-H stretching) is caused by water (Schwanninger et al. 2011). In addition, Fig. 3(b) shows two derivative hanji spectra and Fig. 3(c) to Fig. 3(f) show their average spectra according to the categories 1 to 4. Overall, the three ranges of 7,500 to 6,700 cm-1, 5,700 to 5,000 cm-1, and 4,700 to 4,000 cm-1 showed a specific pattern change that can be used to classify hanji based on type of raw materials.

Fig. 3. (a) Raw NIR spectra, (b) 2 derivative NIR spectra, 2 derivative average NIR spectra of categories (c) 1, (d) 2, (e) 3, and (f) 4
The PLS-DA Model
Figure 4 illustrates the PLS-DA score plots from the four categories according to Table 1. In category 1(a), PLS-DA could not differentiate the 12 classes.
However, in category 2(b), the score values of Korean and Thai paper mulberry were separated to a high extent, which revealed the feasibility of discrimination between the hanji based on types of paper mulberry. In category 3(c), the samples with ash (class O) appeared to nearly overlap those with NaOH (class P). In category 4(d), PLS-DA distinguished between the two classes with some score overlap.

Fig. 4. PLS-DA score plots of categories (a) 1, (b) 2, (c) 3, and (d) 4
Classification Performance Assessment
The performance of the three algorithms, PLS-DA, SVM, and RF, was evaluated by an assessment measure that included accuracy, sensitivity, and specificity based on a confusion matrix. The classification performance results are shown in Fig. S1 and Table 2. In Table 2, category 1 as a control achieved low accuracy (< 0.50) and sensitivity values in spite of high specificity values in all three (PLS-DA, SVM, and RF) classification models.
Category 2 has two classes that distinguish between Korean and Thai mulberry trees included in hanji. All three models within these classes (PLS-DA, SVM, RF) obtained the highest values than the other category; accuracy (1.00, 1.00, 0.98), sensitivity (1.00, 1.00, and 1.00) and specificity (1.00, 1.00, and 0.97) (values in parentheses given for PLS-DA, SVM, and RF, respectively).
Category 3 has three classes that distinguish between Ash, NaOH, and Na2CO3 included in hanji. In category 3, the PLS-DA, SVM, and RF models have relatively low values. The models developed by PLS-DA, SVM, and RF exhibited, respectively, 0.42, 0.6, and 0.63 of accuracy.
Lastly, Category 4 has two classes that distinguish between Hibiscus manihot L. and PAM included in hanji. The models achieved relatively high accuracy (0.85, 0.7, and 0.68), sensitivity (0.93, 0.73, and 0.70), and specificity (0.76, 0.67, and 0.67) than category 3 models.
Category 2 models, the classification prediction model of Hanji based on the type of paper mulberry, showed highest assessment values. In this regard, the main material of hanji is the inner bark of paper mulberry, and its main chemical component is holocellulose which make up more than 90% (Seo and Kim 2011). As mentioned in the introduction, the main absorption bands of the NIR spectra are attributed to the O–H, C–H, and C–O bands found in holocellulose, a major component of inner bark of paper mulberry. Therefore, category 2 showed higher assessment values than the others.
Category 4, the classification prediction model of hanji based on the type of mucilage, showed the second highest assessment values. Since mucilage is added at the last paper formation step without a washing process, the authors believed that the classification model of hanji based on the type of mucilage achieved a higher classification value than the classification model of hanji based on the type of cooking agent.
On the other hand, the classification prediction model of hanji based on the type of cooking agent shown on category 3, reflected the lowest assessment values than the other categories. Most of the cooking agents was removed by the washing process after the cooking procedure. Thus, the authors consider that the washing process caused the low model accuracy of category 2.
Future research may focus on investigating the feasibility of classifying hanji including various type of paper mulberry trees to classify them more reliably. In addition, paper mulberry trees can also be affected by plant environmental factors, including soil, climate, and the atmosphere. Therefore, the above research should be conducted as long-term studies considering these factors to make progress in reliability.
Table 2. Comparison of the Classification Results of Categories 1 to 4 by Accuracy, Sensitivity, and Specificity

CONCLUSIONS
The aim of this study was to confirm the possibility of classification of hanji based on raw materials. The raw materials used to manufacture hanji were as follows: [category 2] paper mulberry (Korean/Thai), [category 3] cooking agents (ash/NaOH/Na2CO3), and [category 4] mucilage (Hibiscus manihot L./PAM). To evaluate the hanji, classification models, PLS-DA, SVM, and RF were developed using NIR analysis.
- The classification models of hanji based on types of paper mulberry, which include the main raw material of hanji, PLS-DA and SVM achieved their highest assessment values as 100% of classification performance values (accuracy, sensitivity, and specificity. In contrast, classification models of hanji based on cooking agent and mucilage achieved lower assessment values.
- The results indicate that the most critical factor in classifying hanji was the type of paper mulberry used. This is important because the proper classification models used in this research can be a potential tool for the classification of hanji paper, improving the quality of hanji used to historical conservation.
ACKNOWLEDGMENTS
This study was carried out with the support of the Restoration Technology Division in the National Research Institute of Cultural Heritage (Daejeon, Korea) for an R&D project.
REFERENCES CITED
Abraham, S., Huynh, C., and Vu, H. (2019). “Classification of soils into hydrologic groups using machine learning,” Data 5(1), 1-14. DOI: 10.3390/data5010002
Alexandre Marcelo, M. C., Martins, C. A., Pozebon, D., and Gerrao, M. F. (2014). “Methods of multivariate analysis of NIR reflectance spectra for classification of yerba mate,” Analytical Methods 6(19), 7621-7627. DOI: 10.1039/c4ay01350f
Antti, H., Sjöström, M., and Wallbäcks, L. (1996). “Multivariate calibration models using NIR spectroscopy on pulp and paper industrial applications,” Journal of Chemometrics 10(5), 591-603. DOI: 10.1002/(SICI)1099-128X(199609)10:5/6<591::AID-CEM474>3.0.CO;2-L
Bin, J., Ai, F. F., Fan, W., Zhou, J. H., Yun, Y. H., and Liang, Y. Z. (2016). “A modified random forest approach to improve multi-class classification performance of tobacco leaf grades coupled with NIR spectroscopy,” RSC Advances 6(36), 30353-30361. DOI: 10.1039/c5ra25052h
Brink, M., Mandenius, C. F., and Skoglund, A. (2010). “On-line predictions of the aspen fibre and birch bark content in unbleached hardwood pulp, using NIR spectroscopy and multivariate data analysis.” Chemometrics and Intelligent Laboratory Systems 103(1), 53-58. DOI: 10.1016/j.chemolab.2010.05.009
Cho, J. H., Kim, K. J., Park, S. B., and Eom, T. J. (2004). “Development of natural dispersant for Korean traditional papermaking (Ⅰ)-viscosity and papermaking characteristics of Hydrangea paniculata mucilage,” The Korea Forestry Energy Research Society 23(1), 38-44.
Diez, P. (2018). “Introduction,” in: Smart Wheelchairs and Brain-Computer Interfaces, Academic Press, San Juan, Puerto Rico, pp. 12-14. DOI: 10.1016/b978-0-12-812892-3.00001-7
Feng, X., Zhao, Y., Zhang, C., Cheng, P., and He, Y. (2017). “Discrimination of transgenic maize kernel using NIR hyperspectral imaging and multivariate data analysis,” SENSORS 17(8), 1894-1908. DOI: 10.3390/s17081894
Gromski, P. S., Muhamadali, H., Ellis, D. I., Xu, Y., Correa, E., Turner, M. L., and Goodacre, R. (2015). “A tutorial review: Metabolomics and partial least squares-discriminant analysis – A marriage of convenience or a shotgun wedding,” Analytica Chimica Acta 878, 10-23. DOI: 10.1016/j.aca.2015.02.012
Jeong, M. J., Kang, K. Y., Bacher, M., Kim, H. J., Jo, B. M., and Potthast, A. (2014). “Deterioration of ancient cellulose paper, hanji: Evaluation of paper permanence,” Cellulose 21, 4621-4632. DOI: 10.1007/s10570-014-0455-4
Lee, K. S. (2011). “Ⅲ Essays,” in: Conservation of Papers and Textiles, National Research Institute of Cultural Heritage Press, Deajeon, Korea, pp. 236-245.
Lee, S. U., Choi, H. S., Cha, K. J., and Chung, H. E. (2013). “Random forest as a potential multivariate method for near-infrared (NIR) spectroscopic analysis of complex mixture samples: Gasoline and naphtha,” Microchemical Journal 110, 739-748. DOI: 10.1016/j.microc.2013.08.007
Lee, L. C., Liong, C. Y., and Jemain, A. A. (2018a). “Partial least squares-discriminant analysis (PLS-DA) for classification of high-dimensional (HD) data: A review of contemporary practice strategies and knowledge gaps,” Analyst 143(15), 3526-3539. DOI: 10.1039/c8an00599k
Lee, S. Y., Mediani, A., Maulidiani, M., Khatib, A., Ismail, I. S., Zawawi, N., and Abas, F. (2018b). “Comparison of partial least squares and random forests for evaluating relationship between phenolics and bioactivities of Neptunia oleracea,” 110, 739-748. DOI: 10.1016/j.microc.2013.08.007
Mancini, M., Toscano, G., and Taavitsainen, V. M. (2019). “Comparison of three different classification methods performance for the determination of biofuel quality by means of NIR spectroscopy,” Journal of Chemometrics 33(7), 1-11. DOI: 0.1002/cem.3145
Mathur, A., and Foody, G. M. (2008). “Multiclass and binary SVM classification: Implications for training and classification users,” IEEE Geoscience and Remote Sensing Letters 5(2), 241-245. DOI: 10.1109/lgrs.2008.915597
Mitsui, K., Inagaki, T., and Tsuchikawa, S. (2008). “Monitoring of hydroxyl groups in wood during heat treatment using NIR spectroscopy,” Biomacromolecules 9(1), 286-288. DOI: 10.1021/bm7008069
Schwanninger, M., Rodrigues, J. C., and Fackler, K. (2011). “A review of band assignments in near infrared spectra of wood and wood components,” Journal of Near Infrared Spectroscopy 19(5), 287-308. DOI: 10.1255/jnirs.955
Seo, Y. B., and Jun, J. (2007). “Difference of calendering and dochim effects on paper surface properties,” Journal of Korea Technical Association of the Pulp and Paper Industry 39(5), 26-31.
Seo, J. H., and Kim, H. J. (2011). “Component Analysis of Paper Mulberry Bark for the Automation of Bark Peeling Process,” Journal of Korea Technical Association of the Pulp and Paper Industry 43(1), 74-82.
Statnikov, A., Wang, L., and Aliferis, C. F. (2008). “A comprehensive comparison of random forests and support vector machines for microarray-based cancer classification,” BMC Bioinformatics 9(1), 319-328. DOI: 10.1186/1471-2105-9-319
Sun, D. W. (2009). “Multivariate classification for qualitative analysis,” in: Infrared Spectroscopy for Food Quality Analysis and Control, Academic Press, Boston, MA, USA, pp. 83-104. DOI: 10.1016/b978-0-12-374136-3.00004-3
Teye, E., Huang, X., Takrama, J., and Haiyang, G. (2014). “Integrating NIR spectroscopy and electronic tongue together with chemometric analysis for accurate classification of cocoa bean varieties,” Journal of Food Process Engineering 37(6), 560-566. DOI: 10.1111/jfpe.12109
Tharwat, A. (2018). “Classification assessment methods,” in: Applied Computing and Informatics: Mobile Assistive Technologies. Published by Elsevier, Amsterdam, Netherlands, pp. 1-13.
Tsuchikawa, S., and Kobori, H. (2015). “A review of recent application of near infrared spectroscopy to wood science and technology,” Journal of Wood Science 61(3), 213-220. DOI: 10.1007/s10086-015-1467-x
Whei Miaw, C. S., Sena, M. M., Carvalho de Souza, S. V., Callao, M. P, and Ruisanchez, I. (2018). “Detection of adulterants in grape nectars by attenuated total reflectance Fourier-transform mid-infrared spectroscopy and multivariate classification strategies,” Food Chemistry 266, 254-261. DOI: 10.1016/j.foodchem.2018.06.006
Xia, J., Zhang, J., Zhao, Y., Huang, Y., Xiong, Y., and Min, S. (2019). “Fourier transform infrared spectroscopy and chemometrics for the discrimination of paper relic types,” Spectrochimica Acta Part A: Molecular and Biomolecular Spectroscopy 219, 8-14. DOI: 10.1016/j.saa.2018.09.059
Xu, J., Zhang, Y., and Miao, D. (2020). “Three-way confusion matrix for classification: A measure driven view,” Information Sciences 507, 772-794. DOI: 10.1016/j.ins.2019.06.064
Article submitted: June 25, 2020; Peer review completed: August 29, 2020; Revised version received: October 7, 2020; Accepted: October 8, 2020; Published: October 15, 2020.
DOI: 10.15376/biores.15.4.9045-9058
APPENDIX
Supplementary Material
- Category 1

- Category 4
- Category 3
- Category 2
Fig. S1. Confusion matrices of categories (a) 1, (b) 2, (c) 3, and (d) 4 using PLS-DA, SVM, and RF, respective