
Abstract
In the production of biofuel from biomass, the enzymatic hydrolysis potential (EHP) of feedstock plays a critical role in determining the process’s saccharification efficiency (SE) and economic feasibility. In this study, the artificial biomass of Eichhornia crassipes (EC) and sugarcane bagasse (SB), as well as the actual biomass of EC and SB pretreated by four different chemical methods, were subjected to enzymatic hydrolysis. A binary linear-regression equation (BLE), y=β1χ1+β2χ2, was derived to illustrate the relationship between the sugar yield (y) and the proportions of key components (cellulose and hemicellulose) (χ1, χ2) with different compositional contributions (β1 and β2) to y. The EC cellulose was found to make a greater contribution than SB cellulose, resulting in higher SE of EC. Furthermore, the SE of pretreated actual biomasses exhibited similar trends and positive correlation with the predictions, indicating good applicability of the BLE model and highlighting the superior EHP of EC. This study advances the understanding of roles played by key biomass components in the enzymatic hydrolysis process, which informs decisions on the EHP of different types of biomass, facilitating the screening of suitable biomass for enhanced SE and cost-effective biomass-to-energy conversion.
Download PDF
Full Article
Comparative Evaluation of Enzymatic Hydrolysis Potential of Eichhornia crassipes and Sugarcane Bagasse for Fermentable Sugar Production
Kai Xiao,a Wenbing Zhou,a,b,* Mingjian Geng,a,* Wei Feng,a Yanyan Wang,a Naidong Xiao,a,b Duanwei Zhu,a,b Feng Zhu,a and Guanglong Liu a
In the production of biofuel from biomass, the enzymatic hydrolysis potential (EHP) of feedstock plays a critical role in determining the process’s saccharification efficiency (SE) and economic feasibility. In this study, the artificial biomass of Eichhornia crassipes (EC) and sugarcane bagasse (SB), as well as the actual biomass of EC and SB pretreated by four different chemical methods, were subjected to enzymatic hydrolysis. A binary linear-regression equation (BLE), y=β1χ1+β2χ2, was derived to illustrate the relationship between the sugar yield (y) and the proportions of key components (cellulose and hemicellulose) (χ1, χ2) with different compositional contributions (β1and β2) to y. The EC cellulose was found to make a greater contribution than SB cellulose, resulting in higher SE of EC. Furthermore, the SE of pretreated actual biomasses exhibited similar trends and positive correlation with the predictions, indicating good applicability of the BLE model and highlighting the superior EHP of EC. This study advances the understanding of roles played by key biomass components in the enzymatic hydrolysis process, which informs decisions on the EHP of different types of biomass, facilitating the screening of suitable biomass for enhanced SE and cost-effective biomass-to-energy conversion.
Keywords: Eichhornia crassipes (EC); Sugarcane bagasse (SB); Artificial biomass; Binary linear-regression equation (BLE); Compositional contribution; Enzymatic hydrolysis potential (EHP)
Contact information: a: Lab of Eco-Environmental Engineering Research, College of Resources and Environment, Huazhong Agricultural University, Wuhan 430070, China; b: Collaborative Innovation Center for Sustainable Pig production (Hubei province), China;
*Corresponding authors: zhouwb@mail.hzau.edu.cn; mjgeng@mail.hzau.edu.cn
INTRODUCTION
Given the issue of energy security and the serious environmental problems caused by biomass waste, bioenergy technology has received significant attention. One promising solution to these issues is effectively converting biomass waste into clean renewable biofuel products. Most biomass waste consists of lignocellulosic materials, which are cheap and abundant renewable resources available worldwide. They are comprised of carbohydrates that can be utilized for the production of fermentable sugars and further converted into biofuel products on a large scale (Singh et al. 2016; Xiao et al. 2017).
The most common process for the transformation of lignocellulosic materials to biofuels consists of three critical steps: pretreatment, enzymatic hydrolysis, and fermentation (Balat 2011). Pretreatment is used to remove intractable components and degrade well-protected structures prior to enzymatic hydrolysis and fermentation (Li et al. 2016). There are a large number of studies that have focused on understanding alterations to the physicochemical properties of lignocellulose for a particular pretreatment technique (Shi et al. 2015). However, these studies pay less attention to the impacts of the heterogeneity of diverse lignocellulose on the sugar production, which can create challenges. A low yield of fermentable sugars creates a bottleneck in the industrial production of biofuels, impeding large-scale production (Xia et al. 2013). Moreover, pretreatment can account for the highest proportion of the total cost in the bioconversion process, thus presenting a great obstacle in the commercialization of biofuel production (Banerjee et al. 2010).
Screening of feedstock as suitable biomass for producing fermentable sugar will play a crucial role in maximizing industrial and economic benefits. Different types of plant straws exhibit different enzymatic hydrolysability, even if they follow the same pretreatment process (Guragain et al. 2011; Singh and Bishnoi 2013). The main reason for this phenomenon is that diverse lignocellulosic materials are composed of cellulose, hemicellulose, and lignin in a variety of proportions with diverse properties. After pretreatment, each compound retains its diverse physicochemical features and proportions that vary between species. This heterogeneity leads to differences in rigidity and recalcitrance of different biomasses for biotransformation (Szczerbowski et al. 2014; Vassilev et al. 2015). The enzymatic hydrolysis potential (EHP) of diverse biomasses is largely related to the behaviors of their components during enzymatic hydrolysis. To obtain suitable raw biomasses with excellent potential for simple enzymatic hydrolysis, it is necessary to clarify their composition and its effects on enzymatic saccharification.
Several models have been employed to investigate the enzymatic saccharification process when more than one independent variable is involved (Zhu et al. 2010). However, it is costly and time-consuming to combine the multitudinous variables using complex actual biomass under various pretreatment conditions, greatly reducing the applicability of these models. To address this problem, one may use artificial biomass to simulate actual biomass under various pretreatments. Moreover, a simplified model to formulate the relationships between sugar yield and the proportions of key components in diverse biomass types would be a promising approach to meet the demand for economically viable industrial application.
Additionally, the fermentation process using microbial strains which efficiently utilize glucose (mainly originating from cellulose) has been extensively engineered (Neves et al. 2016) while hemicellulose exhibits low fermentability in the most common industrial microbial strains (Zhang et al. 2016). Therefore, a study focused on the enzymatic hydrolysability of the celluloses is essential for further evaluation of the EHP of biomasses.
This study aimed to develop a tool to help screen for more suitable feedstock for use in a cost-effective bioconversion process, using Eichhornia crassipes (EC) and sugarcane bagasse (SB). The celluloses of EC and SB were extracted separately, and physical properties, including crystallinity index, degree of polymerization, and specific surface area were measured. Using these two types of extracted celluloses, commercial xylan (representing hemicellulose) and commercial lignin, artificial biomass samples of EC and SB, respectively, were synthetized with different weight proportions of three major components based on the simplex-lattice design. The artificial biomasses were then subjected to enzymatic hydrolysis. A simplified binary linear-regression equation (BLE), y=β1χ1+β2χ2, was derived to formulate the relationships between the sugar yield (y) and the proportions of key components (cellulose and hemicellulose) (χ1, χ2) in the artificial biomasses. This formulation was used to assess the different compositional contributions (β1 and β2) of the two types of artificial biomass to sugar yield, and thereby compare the EHP of the two types of artificial biomass. Additionally, the compositional analysis and the enzymatic hydrolysis of actual EC and actual SB were performed after their subjection to four commonly used pretreatments (acid, alkali, alkaline peroxide, and Fenton pretreatments). The BLE was also used to formulate the relationships between the sugar yield (y) and the proportions of key components (cellulose and hemicellulose) (χ1, χ2) in the pretreated actual biomasses, so as to assess their corresponding compositional contributions (β1 and β2) in actual situations. To verify the reliability of the artificial biomass in simulating the pretreated actual biomass, the assessments of the compositional contributions in the artificial biomasses were compared with those in the pretreated actual biomasses. Furthermore, to check the performance of the BLE from artificial biomasses in predicting actual situations, the saccharification efficiencies of the actual biomasses were compared and correlated with the predicted values. Finally, the potential explanations for deviations from the predictions were analyzed. The present research deepens the earlier study by Lin et al. (2010). The present work is distinct due to the utilization of plant-derived cellulose, which carries unique information of specific lignocellulosic materials, instead of commercial cellulose used by Lin et al.Furthermore, in this study, the theoretical sugar production performances of different biomasses predicted by the BLE model were correlated with the measured values for practical analysis, facilitating the guidance of actual application in screening of plant materials, which was not investigated in the previous work.
EXPERIMENTAL
Materials
Plant materials
In this study, EC and SB were selected as a typical aquatic invasive biomass (Feng et al. 2017) and a representative terrestrial waste biomass (Moretti et al. 2016), respectively, for waste-to-sugar research. The EC biomass used in this study was collected from a pond on the campus of Huazhong Agricultural University in Wuhan, China. Following removal of the roots, the samples were rinsed with distilled water, air dried for 5 d, and then dried in an oven at 70 ºC to a constant weight (i.e., mass ceased to change with additional drying time). The SB was obtained from a sugar cane mill in Wuhan, China, and washed with distilled water until no sugar remained; the DNS (3,5-dinitrosalicylic acid) method was used to check the total reducing sugar in the rinse water. The rinsed bagasse was then dried at 70 ºC to a constant weight. The dried plant straw was ground using a JXFM110 grinder (Saiba Precise Instrument Corporation, Shanghai, China) and sieved to produce samples with particle sizes ranging from 0.150 to 0.180 mm.
Table 1. Characteristics of Cellulose, Hemicellulose, and Lignin in the Artificial Biomasses

Generation of the artificial biomasses
Extraction of cellulose from EC and SB was performed using a method used previously (Haleem et al. 2014). The dried EC or SB straw was immersed in 25 wt.% NaOH scouring solution at 70 °C for 2 h and washed with distilled water till the pH of the washing water reached 7.0. Then it was bleached with 1.5 wt.% H2O2 in alkaline medium (0.9 wt.% NaOH) at 70 °C. The bleached sample was washed and dried, followed by treatment with 10 wt.% H2SO4 at 70 °C until the white suspension was formed. The suspension was separated from the liquid fraction and subjected to drying treatment. The obtained white powder was the plant derived cellulose.
It is difficult to directly separate hemicellulose from lignocellulose. Thus, xylan, which is the dominant component of hemicellulose in crop plants, was chosen to represent hemicellulose. The yellow powder form of commercial xylan and the brown powder form of commercial lignin were used for generation of the artificial biomasses. The characteristics of the cellulose, hemicellulose and lignin of the artificial biomasses are summarized in Table 1.
In the artificial biomasses, the weight proportions of cellulose, hemicellulose, and lignin were determined based on the simplex-lattice design (Gorman and Hinman 1962). To simulate any of the various proportions of each component in the two types of actual biomass subjected to pretreatments, 100 mg of artificial biomass was used in each sample. The sample compositions of the cellulose, hemicellulose, and lignin are shown in Fig. 1. In total, there were 30 recipes with 15 recipes for each artificial biomass.
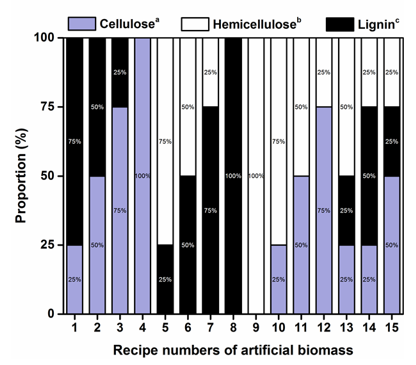
Fig. 1. Proportions of the cellulose, hemicellulose and lignin in the artificial biomass.
a Cellulose was extracted from the actual biomass.
b Hemicellulose was represented by the commercial xylan (β-D-xylopyranose[1→4], Table 1).
c Lignin was commercial lignin (alkali lignin, Table 1).
Determination of the Physical Properties of the Cellulose
The crystallinity index (CrI) of the celluloses of EC and SB were measured using a powder X-ray diffractometer (Bruker D8 Advance, Karlsruhe, Germany). The samples were scanned in the 2θ ranging from 5° to 40° at 2°/min, with a step size of 0.05°. The CrI was defined as the following equation (Li et al. 2014),
 (1)
(1)
where I002 is the maximum diffraction intensity of the crystalline peak at 2θ of 22.6° for cellulose I, and Iam is the intensity of diffraction for amorphous cellulose at a 2θ value of 18.7°.
The viscosity-based degree of polymerization (DP) of the celluloses of EC and SB were determined using capillary viscometry, according to the method from the ASTM D570-098 (2010). The procedure was performed at 25 °C for cellulose in a lithium hydrate/urea solution (4.2 wt.%/12 wt.%) using a Ubbelohde viscometer. The DP was calculated using the Mark–Houwink–Sakurada equation (Bari et al. 2015),
 (2)
(2)
where  represents the intrinsic viscosity.
The specific surface area (SSA) of the two types of cellulose was measured using the BET (Brunauer-Emmett-Teller) method and calculated based on the BET adsorption isotherm equation (Tian et al. 2011). High-purity nitrogen gas adsorption analysis was performed on a fully automatic specific surface and pore size distribution analyzer (Quantachrome Autosorb-1, Boynton Beach, USA). Samples were degassed at 110 °C for 3 h prior to analysis.
Pretreatments
In this study, the following four types of widely used pretreatment methods were performed for the actual EC and SB: H2SO4, NaOH, alkaline peroxide (AP), and the Fenton method.
For H2SO4 pretreatment, 5 g of dried mass was added to 50 mL of 1 wt.% H2SO4 solution. For NaOH pretreatment, 50 g of dried mass was immersed in 200 mL of 2% (w/v) NaOH solution. For AP pretreatment, 20 g of dried mass was added to 200 mL of 2 wt.% NaOH solution containing 1% (v/v) H2O2. Both the H2SO4 and NaOH pretreatment bottles were autoclaved at 120 ºC for 30 min. The AP pretreatment bottles were treated in a water bath at 90 ºC for 1 h. All were then cooled to room temperature.
For Fenton pretreatment, FeSO4·7H2O and H2O2 (30%, w/w) in a molar ratio of 1:50 were used as the Fenton reagent solution. Then, 5 g of dried mass was immersed in the 100 mL mixture of diluted Fenton media that contained 10 mL of the Fenton reagent solution and 90 mL of distilled water in a 250 mL Erlenmeyer flask. The reaction was performed for 12 h at 40 ºC and 200 rpm.
After the pretreatments, each pretreated solid was separated from the liquid fraction. The filtered solids were washed with distilled water until the pH reached 7.0. They were then dried to a constant weight at 105 ºC and stored at 4 ºC prior to the chemical composition analysis and enzymatic hydrolysis experiments.
Chemical Composition Analysis for Actual Biomasses
The specific carbohydrate and lignin contents of the untreated and pretreated actual biomass were determined by a standard analytical procedure (Sluiter et al. 2012). In this process, the carbohydrates were analyzed via high performance liquid chromatography (HPLC; Shimadzu LC-20AT, Kyoto, Japan), equipped with a refractive index detector (Shimadzu RID-10A) and a ZORBAX carbohydrate column (4.6 × 250 mm, Agilent Technologies, Waldbronn, Germany). The crude ash and total solids of the untreated and pretreated actual biomass were determined according to Sluiter et al. (2005, 2008). All analyses were performed in triplicate, and the means were calculated.
Enzymatic Hydrolysis
All enzymatic hydrolysis experiments (on both the artificial and pretreated actual biomasses) were conducted at the same low cellulase (T. reesei ATCC 26921, Sigma-Aldrich, USA) loading concentration of 14 FPU/g substrate at 50 ºC and 150 rpm. The reducing sugar yield was determined using the DNS method via a spectrophotometer (Li et al. 2014). All enzymatic hydrolysis experiments were conducted in triplicate, and the means were calculated. The reducing sugar yield is defined as shown in the following Eq. (3).
The saccharification efficiency is expressed as a percentage of the theoretical maximum reducing sugar yield of the pretreated substrate.Specifically, these values were calculated as follows (Xiao et al. 2017),
 (3)
(3)
 (4)
(4)
Modeling Approach for Assessing the Compositional Contributions to Sugar Yield
In this study, a general linear-regression equation was derived to fit the data collected from the simplex-lattice design for the artificial biomasses. The polynomial equation for the three major components can be written as (Lin et al. 2010),
 (5)
(5)
where χ1, χ2, and χ3 are the proportions of cellulose, hemicellulose and lignin of artificial biomass, respectively, and y is the reducing sugar yield (mg/g of substrate) from artificial biomass, which was measured using 15 recipes for each type (data not shown). Since in the two types of artificial biomass, the three components were independent, it was assumed that there were no interactions among them, thus cellulose and hemicellulose made no interactive contributions to y (β12=0), and lignin made no contributions to y(β3=0). Additionally, each component was thoroughly washed before utilization; thus there was no background sugar yield for the artificial biomasses (β0=0). In this case, the equation can be simplified to a binary linear-regression equation (BLE), as shown in Eq. 6.
 (6)
(6)
To obtain the contributions of cellulose and hemicellulose (i.e.regression coefficients of BLE—β1 and β2, respectively) to sugar yield (y), the fitting of BLE was conducted in MS Excel software (Microsoft, Redmond, WA, USA).
RESULTS AND DISCUSSION
Compositional Changes in the Actual Biomasses before and after Pretreatments
To investigate the compositional changes of the actual EC and actual SB samples under the H2SO4, NaOH, AP, and Fenton pretreatments, the proportions and removal of components in EC and SB before and after pretreatments were analyzed. Figure 2 shows that all the proportions of cellulose, hemicellulose, and lignin in these two types of actual biomass were within the coverage of simplex-lattice design, whether before or after pretreatments. This result indicates that the simplex-lattice design used for synthesizing artificial biomass highly satisfied practical cases. Additionally, the solid recoveries of H2SO4, NaOH, AP, and Fenton pretreated EC varied with different pretreatment methods (36.8%, 27.4%, 37.0%, and 67.2%, respectively). Meanwhile, different solid recoveries were also observed in 4 kinds of pretreated SB (34.8%, 34.6%, 39.9%, and 59.2%, respectively).
When subjected to H2SO4 or the Fenton reagent pretreatment, the hemicellulose, lignin, and crude ash removals from EC and SB were approximately the same, whereas the cellulose removals from EC were much lower than those from SB (2.5% vs. 29.1% for H2SO4pretreatment; 0.6% vs. 9.9% for Fenton pretreatment). These results indicate that EC was more suitable than SB for H2SO4 and Fenton pretreatments due to its higher cellulose preservation.
Following the NaOH or AP pretreatment, the cellulose proportions of EC and SB significantly increased, whereas the proportions of lignin and crude ash decreased to varying degrees. The lignin and crude ash proportions of NaOH-pretreated SB (NaOH-SB) and AP-pretreated SB (AP-SB) significantly decreased (from 13.4% to 2.0% and 3.0% for lignin; from 13.6% to 0.95% and 0.97% for crude ash, respectively). In contrast, those of NaOH-pretreated EC (NaOH-EC) and AP-pretreated EC (AP-EC) decreased slightly or even increased slightly (from 11.7% to 16.8% and 10.4% for lignin; from 16.2% to 12.0% and 10.0% for crude ash, respectively). In addition, the lignin and crude ash removals from NaOH-SB and AP-SB were much higher than those from NaOH-EC and AP-EC (94.8% vs. 60.5%, and 91.0% vs. 67.2% for lignin; 97.6% vs. 79.8%, and 97.2% vs. 51.7% for crude ash, respectively). Therefore, the SB suggests its greater compatibility than EC for NaOH and AP pretreatments, since more inhibitors (lignin and crude ash) of enzymatic hydrolysis reaction were removed from SB than from EC.

Fig. 2. Compositional changes of the Eichhornia crassipes and sugarcane bagasse samples before and after four kinds of pretreatments. Error bars represent standard deviations of triplicate tests.
a Values based on total glucan.
b Values based on the sum of xylose and arabinose.
c Klason (acid-insoluble) lignin
These findings emphasize the fact that not all of the plant straws are equally amenable to a particular pretreatment. Therefore, the optimization of the selection process for cost-competitive bioconversion techniques may strongly depend on the particular properties of a given feedstock.
Properties of Eichhornia crassipes Cellulose and Sugarcane Bagasse Cellulose
The CrI, DP, and SSA of cellulose are the crucial factors for enzymatic hydrolysis of biomass. These three properties of cellulose extracted from EC and SB are shown in Table 2. There were no apparent differences in the CrI and DP between the two types of extracted cellulose. However, the SSA of EC cellulose was significantly higher than that of SB cellulose (12.32 vs. 7.82), which may greatly induce the differences in the enzymatic hydrolysability between the two types of artificial biomass.
Table 2. Crystallinity index, Degree of Polymerization, and Specific Surface Area of Eichhornia crassipes Cellulose and Sugarcane Bagasse Cellulose

Assessment of the Compositional Contributions to Sugar Yield
Table S1 in Supplementary materials summarizes the analysis of variance and regression statistics for the fitting of BLE models on artificial biomasses. The P-value was used as a tool to check the significance of the regression coefficients (i.e., compositional contributions). The lower the P-value, the more significant was the correlation of sugar yield with the corresponding compositional contribution. For both BLEs, the independent parameters, such as cellulose and hemicellulose proportions, had significant effects on the sugar yield at the 95% confidence level, where most of the P-values were found to be less than 0.0001. In addition, high R2 values in both the BLEs (0.8807 to 0.9953 for EC artificial biomass; 0.8845 to 0.9858 for SB artificial biomass) imply that only few percentages for two types of artificial biomass of the total variations were not explained by the BLE model. Moreover, for both the BLEs, all the standard deviations were in reasonable argument (38.67 to 97.28 for EC artificial biomass; 39.68 to 85.09 for SB artificial biomass), indicating a solid performance for the BLE model. Therefore, the BLE is applicable in assessing the compositional contributions for the artificial biomasses.
The compositional contributions (β1 for cellulose and β2 for hemicellulose) of artificial biomasses are illustrated in Fig. 3A. Throughout the duration of the enzymatic hydrolysis, β1EC>β1SB, indicating the advantage of EC cellulose over SB cellulose in contributing to the sugar yield, primarily during the early stages of the hydrolysis process (0 to 24 h). This implies that EC cellulose hydrolyzed faster than SB cellulose, which can be attributed to the higher SSA of EC cellulose (Table 2). A high SSA of a substrate is known to enhance the hydrolase adsorption efficiency, thus having a promoting effect on the enzymatic conversion to sugar (Koo et al. 2012). However, similar values between β2EC and β2SB were observed. The sugar production contributions from hemicelluloses of EC artificial biomass and SB artificial biomass appeared nearly identical. In sum, artificial EC biomass showed a better EHP than artificial SB biomass.

Fig. 3. Compositional contributions of artificial biomasses (A) and those of pretreated actual biomasses (B) as a function of enzymatic hydrolysis time at the 95% confidence level. Error bars represent standard deviations.
a β1EC: the contribution of EC cellulose to sugar yield.
b β2EC: the contribution of EC hemicellulose to sugar yield.
c β1SB: the contribution of SB cellulose to sugar yield.
d β2SB: the contribution of SB hemicellulose to sugar yield.
To test the validity of the artificial biomass in simulating its actual biomass under different pretreatments, the BLE was also used to fit the data of pretreated actual biomasses. Here, χ1 and χ2 are the proportions of cellulose and hemicellulose in pretreated actual biomasses, respectively (Fig. 2), and y is the reducing sugar yield of pretreated actual biomasses. The analysis of variance and regression statistics for the fitting of BLE models on pretreated actual biomasses are summarized by Table S2 in Supplementary materials. In general, for both the BLEs, the high R2 values (all were 0.99) and the relative reasonable standard deviations (19.81 to 35.13 for pretreated actual EC, vs. 19.26 to 85.13 for pretreated actual SB) indicate the stability of the BLE model when it is used for pretreated actual biomasses, especially for their celluloses.
In contrast to Fig. 3A, Fig. 3B illustrates the compositional contributions of pretreated actual biomasses. Throughout the entire enzymatic hydrolysis process, β1EC was greater than β1SB, especially before 24 h. Meanwhile, based on a comprehensive consideration, no apparent disparities were observed between the sugar production contributions from hemicelluloses of pretreated actual EC and pretreated actual SB in the overall enzymatic hydrolysis process. These results reveal that actual EC biomass has a better EHP than actual SB biomass, which agree with the assessments from the artificial biomasses in Fig. 3A, indicating the reliability of the revelation from the artificial biomasses.
Specifically, the overall P-values of two types of pretreated actual biomasses (0.02662 to 0.04303 for EC; 0.05541 to 0.07624 for SB in Table S2) were higher than those of their respective artificial biomasses (<0.0001 for EC; <0.0001~0.0024 for SB in Table S1) throughout the entire enzymatic hydrolysis process, indicating that the BLE model is better suited for use in artificial biomasses. This result suggests that, for complex actual biomasses, besides the proportions of two key components (cellulose and hemicellulose), other factors, such as chemical linkages among each component, or the inhibitory effects of lignin and crude ash, have a smaller influence on enzymatic hydrolysis reaction.
Additionally, statistical significance of compositional contributions of pretreated actual biomasses was analyzed by Table S3 in Supplementary materials. For both types of pretreated actual biomasses, the P-values of cellulose proportion were lower than those of hemicellulose proportion throughout the entire enzymatic hydrolysis process. This implies cellulose plays a more decisive role than hemicellulose in the complex actual biomasses during fermentable sugar production.
These findings further the understanding that, in the complicated biomass-to-sugar process, the contribution of cellulose is the most crucial factor which qualitatively determines the level of EHP of actual biomass. The contribution from hemicellulose is a secondary factor, whereas the crossed interactions among each component and the negative role of lignin and crude ash (related to the pretreatment conditions) may only quantitatively influence the hydrolysis rate of actual biomass.
Comparison of the Predicted and Actual Saccharification Efficiency
To judge the validity of the BLE model for artificial biomasses in predicting the practical cases, reducing sugar yields and corresponding saccharification efficiencies were predicted for the pretreated-ECs and pretreated-SBs. Using the BLE: y = β1χ1 + β2χ2, the predicted reducing sugar yield (ypred) was calculated based on the compositional contributions of artificial biomasses (β1 and β2) as shown in Fig. 3A, and the proportions of cellulose and hemicellulose of pretreated actual biomasses (χ1 and χ2) as shown in Fig. 2. Using Eq. (4), the predicted saccharification efficiency (Spred) was calculated based on the ypred and carbohydrate proportions in the pretreated actual biomasses. Then, the reducing sugar yields and corresponding saccharification efficiencies measured in the experiments (yactual and Sactual) were compared with the predicted values. The results are shown in Figs. 4 through 7.
Both the yactual and Sactual of H2SO4-EC and Fenton-EC were higher than those of H2SO4-SB and Fenton-SB, respectively, throughout the entire enzymatic hydrolysis period. The trends are similar to the ypredand Spred of H2SO4-EC, Fenton-EC, H2SO4-SB, and Fenton-SB for the overall enzymatic hydrolysis process, respectively (Figs. 4 and 5). These results further demonstrate the superiority of EC over SB in EHP, as well as the sufficient precision of the BLE’s prediction, given H2SO4 or Fenton pretreatments.

Fig. 4. Reducing sugar yield and corresponding saccharification efficiency predicted from the BLE for the H2SO4-EC and H2SO4-SB compared to those measured in the empirical experiments. (A) and (C) were predicted results. (B) and (D) were actual results. Error bars represent standard deviations of triplicate tests.

Fig. 5. Reducing sugar yield and corresponding saccharification efficiency predicted from the BLE for the Fenton-EC and Fenton-SB compared to those measured in the empirical experiments. (A) and (C) were predicted results. (B) and (D) were actual results. Error bars represent standard deviations of triplicate tests.
As shown in Fig. 6A and Fig. 7A, the ypred of NaOH-EC and AP-EC were higher than those of the NaOH-SB and AP-SB for early stage of enzymatic hydrolysis process (from 0 to 36 h and from 0 to 48 h, respectively), which exhibited similar patterns to the yactual of NaOH-EC and AP-EC (Fig. 6B and Fig. 7B) (from 0 to 12h and from 0 to 24 h, respectively). In addition, the Sactual of NaOH-EC and AP-EC were higher than those of NaOH-SB and AP-SB during the overall hydrolysis process (Fig. 6D and Fig. 7D), which was highly similar to the predicted results (Fig. 6C and Fig. 7C). These results further demonstrate the faster hydrolysability of EC in the early stage of enzymatic saccharification process, as well as the reliability of the BLE’s prediction, given NaOH or AP pretreatments.
Therefore, the comparisons of ypred and Spred between two types of pretreated biomasses agreed with those of yactual and Sactual, respectively. This reveals the practicality of the BLE model to compare the EHP of different actual biomasses, given certain pretreatments.

Fig. 6. Reducing sugar yield and corresponding saccharification efficiency predicted from the BLE for the NaOH-EC and NaOH-SB compared to those measured in the empirical experiments. (A) and (C) were predicted results. (B) and (D) were actual results. Error bars represent standard deviations of triplicate tests.
Interestingly, the time when the changes occurred in the predictions (36 h for NaOH-biomasses in Fig. 6A; 48h for AP-biomasses in Fig. 7A) and the experiments (12 h for NaOH-biomasses in Fig. 6B; 24h for AP-biomasses in Fig. 7B) did not necessarily agree. This was likely related to the greater effectiveness of the NaOH and AP pretreatments in removing lignin and ash from SB than from EC (Fig. 2), which would promote the sugar production in actual situation but this was not accounted into the BLE model. These benefits from pretreatments contributed only a modest boost to SB’s sugar yield and did not have significant impacts on the assessments based on the artificial biomasses that EC biomass hydrolyzed faster than SB biomass (Fig. 3A).

Fig. 7. Reducing sugar yield and corresponding saccharification efficiency predicted from the BLE for the AP-EC and AP-SB compared to those measured in the empirical experiments. (A) and (C) were predicted results. (B) and (D) were actual results. Error bars represent standard deviations of triplicate tests.
These findings further support the knowledge that, compared to the pretreatment (which affects the extent of carbohydrate’s release), the natural properties of cellulose (as the most crucial factor to determine the level of biomass’s EHP) plays a more decisive role in the sugar production. This thereby highlights the advantage of this simplified model for comparing the EHP of different actual biomasses based on their respective artificial biomasses, over the conventional methods that use various costly and time-consuming pretreatments on diverse actual biomasses.
Correlation of the predicted and actual saccharification efficiency
Figure 8 shows scatter plots of predicted saccharification efficiencies versus actual saccharification efficiencies for the two types of pretreated biomasses. In general, the data of predicted and actual values were in close agreement for both pretreated-ECs and pretreated-SBs. All points were distributed relatively close to the diagonal line, and all of the Sactual values displayed a good positive relationship with their respective Spred values satisfied with the R2values higher than 0.9, given a certain pretreatment. Moreover, the slopes of the correlation lines for all of the pretreated-biomasses (ranging from 0.8328 to 1.046) were close to the slope of the diagonal line, i.e., 1.0, given a certain pretreatment. These results suggest that the BLE model adequately fitted the experimental data, and further indicate that the BLE’s predictions for the enzymatic saccharification based on the artificial biomasses significantly reflected the superiority or inferiority of different biomasses in the real enzymatic saccharification process.

Fig. 8. Correlations between the predicted and actual saccharification efficiencies for the two types of pretreated biomasses as a function of enzymatic hydrolysis time. Error bars represent standard deviations of triplicate tests.
As shown in Fig. 8, the points for the H2SO4-biomasses, NaOH-biomasses, and AP-biomasses are distributed above the diagonal line (Sactua/Spred >1), whereas those for the Fenton-biomasses are distributed near the diagonal line or slightly below it (Sactua/Spred ≤1). This implies that the Sactual values of the former three pretreated-biomasses are higher than their respective Spred values, whereas those of the Fenton-biomasses are near but slightly lower than their respective Spred. One possible reason for this may be the pretreatment temperature. The H2SO4, NaOH, and AP pretreatments were conducted at 120 ºC, 120 ºC, and 90 ºC, respectively. The high temperature was favorable for the swelling of cellulose and hemicellulose (Chen et al. 2008), which resulted in the enhancement of their SSA. This promoted saccharification compared with the artificial biomasses (room temperature) and the Fenton-biomasses (40 ºC). Considering the operational simplicity and economic viability of the model for large-scale industrial application, the variable of pretreatment temperature in the real conditions was not taken into account, and thus led to the slightly vertical discrepancies between the predicted and actual results.
However, given the same pretreatments, these vertical discrepancies did not affect the evaluation of the advantages or disadvantages of different biomasses in the entire enzymatic hydrolysis process. On the contrary, this reveals that the BLE model can be applied to any pretreatments which are not limited by temperature, indicating its wide applicability for large-scale industrial production.
Overall, this study discovered the predictable relationships between the saccharification efficiency of different pretreated actual biomasses and the proportions of key components (cellulose and hemicellulose) with their unique compositional contributions derived from their artificial biomasses. This new conceptual tool can be applied for the screening of suitable feedstock from various types of biomass for effective saccharification and cost-competitive biofuel production.
CONCLUSIONS
- Compared with sugarcane bagasse (SB) cellulose, Eichhornia crassipes (EC) cellulose contributed more to the fermentable sugar production in its artificial biomass.
- The pretreated ECs exhibited higher saccharification efficiencies than pretreated SBs, and both exhibited highly similar trends and positive correlations with the predictions from artificial biomass, thus highlighting the superior enzymatic hydrolysis potential (EHP) of EC versus SB.
- This study improves the understanding of the roles played by the key components of biomasses in the enzymatic hydrolysis process, which aids in comparison of the EHP of different biomasses.
- This study establishes a simple, economical and conceptual model to screen suitable biomass for effective saccharification and cost-competitive bioconversion.
ACKNOWLEDGMENTS
The authors are grateful for the support of the National Key Research and Development Plan, Grant No. 2017YFD0800804-01; Fundamental Research Funds for the Central Universities, Grant No. 2662017JC018; the China Agriculture Research System-Green Manure (CARS-22); and the Open Subject of the State Key Laboratory of Freshwater Ecology and Biotechnology of the Institute of Hydrobiology of the Chinese Academy of Sciences, Grant No. 2016FB19. The authors are grateful to Professor Hongwei Wu at the School of Chemical and Petroleum Engineering of Curtin University in Australia for his valuable contribution in revising the early version of this manuscript.
REFERENCES CITED
ASTM D570-98 (2010). “Standard test method for water absorption of plastics,” ASTM International, West Conshohocken, USA.
Balat, M. (2011). “Production of bioethanol from lignocellulosic materials via the biochemical pathway: A review,” Energy Conversion and Management 52(2), 858-875. DOI: 10.1016/j.enconman.2010.08.013
Banerjee, S., Mudliar, S., Sen, R., Giri, B., Satpute, D., Chakrabarti, T., and Pandey, R. A. (2010). “Commercializing lignocellulosic bioethanol: Technology bottlenecks and possible remedies,” Biofuels, Bioproducts and Bioresources 4, 77-93. DOI: 10.1002/bbb.188
Bari, E., Oladi, R., Schmidt, O., Clausen, C. A., Ohno, K., Nicholas, D. D., Daryaei, M. G., and Karim, M. (2015). “Influence of xylem ray integrity and degree of polymerization on bending strength of beech wood decayed by Pleurotus ostreatus and Trametes versicolor,” International Biodeterioration and Biodegredation 104, 299-306. DOI: 10.1016/j.ibiod.2015.06.019
Chen, H., Han, Y., and Xu, J. (2008). “Simultaneous saccharification and fermentation of steam exploded wheat straw pretreated with alkaline peroxide,” Process Biochemistry 43, 1462-1466. DOI: 10.1016/j.procbio.2008.07.003
Feng, W., Xiao, K., Zhou, W., Zhu, D., Zhou, Y., Yuan, Y., Xiao, N., Wan, X., Hua, Y., and Zhao, J. (2017). “Analysis of utilization technologies for Eichhornia crassipes biomass harvested after restoration of wastewater,” Bioresource Technology 223, 287-295. DOI: 10.1016/j.biortech.2016.10.047
Gorman, J. W., and Hinman, J. E. (1962). “Simplex lattice designs for multicomponent systems,” Technometrics 4, 463-487.
Guragain, Y. N., De Coninck, J., Husson, F., Durand, A., and Rakshit, S. K. (2011). “Comparison of some new pretreatment methods for second generation bioethanol production from wheat straw and water hyacinth,” Bioresouce Technology 102, 4416-4424. DOI: 10.1016/j.biortech.2010.11.125
Haleem, N., Arshad, M., Shahid, M., and Tahir, M. A. (2014). “Synthesis of carboxymethyl cellulose from waste of cotton ginning industry,” Carbohydrate Polymers 113, 249-255. DOI: 10.1016/j.carbpol.2014.07.023
Koo, B. W., Min, B. C., Gwak, K. S., Lee, S. M., Choi, J. W., Yeo, H., and Choi, I. G. (2012). “Structural changes in lignin during organosolv pretreatment of Liriodendron tulipifera and the effect on enzymatic hydrolysis,” Biomass and Bioenergy 42, 24-32. DOI: 10.1016/j.biombioe.2012.03.012
Li, K., Wan, J., Wang, X., Wang, J., and Zhang, J. (2016). “Comparison of dilute acid and alkali pretreatments in production of fermentable sugars from bamboo: Effect of Tween 80,” Industrial Crops and Products 83, 414-422. DOI: 10.1016/j.indcrop.2016.01.003
Li, L., Zhou, W. B., Wu, H. W., Yu, Y., Liu, F., and Zhu, D. W. (2014). “Relationship between crystallinity index and enzymatic hydrolysis performance of celluloses separated from aquatic and terrestrial plant materials,” BioResources 9, 3993-4005. DOI: 10.15376/biores.9.3.3993-4005
Lin, L., Yan, R., Liu, Y., and Jiang, W. (2010). “In-depth investigation of enzymatic hydrolysis of biomass wastes based on three major components: Cellulose, hemicellulose and lignin,” Bioresource Technology 101(21), 8217-8223. DOI: 10.1016/j.biortech.2010.05.084
Moretti, M. M., Perrone, O. M., Nunes C, C., Taboga, S., Boscolo, M., da Silva, R., and Gomes, E. (2016). “Effect of pretreatment and enzymatic hydrolysis on the physical-chemical composition and morphologic structure of sugarcane bagasse and sugarcane straw,” Bioresource Technology 219, 773-777. DOI: 10.1016/j.biortech.2016.08.075
Neves, P. V., Pitarelo, A. P., and Ramos, L. P. (2016). “Production of cellulosic ethanol from sugarcane bagasse by steam explosion: Effect of extractives content, acid atalysis and different fermentation technologies,” Bioresource Technology 208, 184-194. DOI: 10.1016/j.biortech.2016.02.085
Shi, J., George, K. W., Sun, N., He, W., Li, C. L., Stavila, V., Keasling, J. D., Simmons, B. A., Lee, T. S., and Singh, S. (2015). “Impact of pretreatment technologies on saccharification and isopentenol fermentation of mixed lignocellulosic feedstocks,” BioEnergy Resource 8(3), 1004-1013. DOI: 10.1007/s12155-015-9588-z
Singh, A., and Bishnoi, N. R. (2013). “Comparative study of various pretreatment techniques for ethanol production from water hyacinth,” Industrial Crops and Products 44, 283-289. DOI: 10.1016/j.indcrop.2012.11.026
Singh, R., Krishna, B. B., Kumar, J., and Bhaskar, T. (2016). “Opportunities for utilization of non-conventional energy sources for biomass pretreatment,” Bioresource Technology 199, 398-407. DOI: 10.1016/j.biortech.2015.08.117
Sluiter, A., Hames, B., Hyman, D., Payne, C., Ruiz, R., Scarlata, C., Sluiter, J., Templeton, D., and Wolfe, J. (2008). Laboratory Analytical Procedure: Determination of Total Solids in Biomass and Total Dissolved Solids in Liquid Process Samples (NREL/TP-510-42621), National Renewable Energy Laboratory, Golden, CO.
Sluiter, A., Hames, B., Ruiz, R., Scarlata, C., Sluiter, J., and Templeton, D. (2005). Laboratory Analytical Procedure: Determination of Ash in Biomass (NREL/TP-510-42622), National Renewable Energy Laboratory, Golden, CO.
Sluiter, A., Hames, B., Ruiz, R., Scarlata, C., Sluiter, J., Templeton, D., and Crocker, D. (2012). Laboratory Analytical Procedure: Determination of Structural Carbohydrates and Lignin in Biomass (NREL/TP-510-42618), National Renewable Energy Laboratory, Golden, CO.
Szczerbowski, D., Pitarelo, A. P., Zandona Filho, A., and Ramos, L. P. (2014). “Sugarcane biomass for biorefineries: comparative composition of carbohydrate and non-carbohydrate components of bagasse and straw,” Carbohydrate Polymers 114, 95-101. DOI: 10.1016/j.carbpol.2014.07.052
Tian, X. F., Fang, Z., Jiang, D., and Sun, X. Y. (2011). “Pretreatment of microcrystalline cellulose in organic electrolyte solutions for enzymatic hydrolysis,” Biotechnology Biofuels 4(1), 1-14. DOI: 10.1186/1754-6834-4-53
Vassilev, S. V., Vassileva, C. G., and Vassilev, V. S. (2015). “Advantages and disadvantages of composition and properties of biomass in comparison with coal: An overview,” Fuel 158, 330-350. DOI: 10.1016/j.fuel.2015.05.050
Xia, A., Cheng, J., Song, W., Yu, C., Zhou, J., and Cen, K. (2013). “Enhancing enzymatic saccharification of water hyacinth through microwave heating with dilute acid pretreatment for biomass energy utilization,” Energy 61, 158-166. DOI: 10.1016/j.energy.2013.09.019
Xiao, K., Yuan, Y., Xiao, N., Zhou, W., Yang, Q., Feng, W., and Zhu, D. (2017). “Enzymatic saccharification responses of Eichhornia crassipes, sugarcane bagasse and Metasequoia glyptostroboides to two oxidation pretreatments for biofuel production,” Industrial Crops and Products 107, 22-29. DOI: 10.1016/j.indcrop.2017.05.017
Zhang, B., Zhang, J., Wang, D., Han, R., Ding, R., Gao, X., Sun, L., and Hong, J. (2016). “Simultaneous fermentation of glucose and xylose at elevated temperatures co-produces ethanol and xylitol through overexpression of a xylose-specific transporter in engineered Kluyveromyces marxianus,” Bioresource Technology 216, 227-237. DOI: 10.1016/j.biortech.2016.05.068
Zhu, L., O’Dwyer, J. P., Chang, V. S., Granda, C. B., and Holtzapple, M. T. (2010). “Multiple linear regression model for predicting biomass digestibility from structural features,” Bioresource Technology 101, 4971-4979. DOI: 10.1016/j.biortech.2009.11.034
Article submitted: November 20, 2017; Peer review completed: March 17, 2018; Revised version received and accepted: April 6, 2018; Published: May 14, 2018.
DOI: 10.15376/biores.13.3.4897-4915
APPENDIX
Supplementary Materials
Table S1. Analysis of Variance and Regression Statistics for the Fitting of BLE Models on Artificial Biomasses at the 95% Confidence level as a Function of Enzymatic Hydrolysis Time

Table S2. Analysis of Variance and Regression Statistics for the Fitting of BLE Models on Pretreated Actual Biomasses at the 95% Confidence Level as a Function of Enzymatic Hydrolysis Time

Table S3. Level of Statistical Significance of Compositional Contributions of Pretreated Actual Biomasses Determined by P-value at the 95% Confidence Level as a Function of Enzymatic Hydrolysis Time
