
Abstract
The use of screen-printed electrodes in different monitoring applications, e.g., polluted water, biotechnology, agriculture, industrial process control, and other applications, are continuously being developed. New cheap and open-source potentiostats have been recently emerging, in addition to the commercial and proprietary solutions on the market. In this study, paper-based, screen-printed electrodes were utilised as an alternative solution for ceramic-based electrodes and were tested with two potentiostats (proprietary and low-cost open-source running on wireless 64 bit Linux system installed on Raspberry Pi 3+). Unique paper substrates made from invasive plant papers and one commercial product were used for screen electrode printing. Ink layer thicknesses variations and mechanical grinding were applied, and cyclic voltammetry measurements were conducted. The variation in cyclic voltammetry measurements could be attributed to two sources: the potentiostats showed differences in their sensibility and signal values, and paper surface and structure also contributed to differences. Simultaneously, the additional processing steps, e.g., mechanical grinding, introduced additional measurement variations and differences in the measurement process.
Download PDF
Full Article
Comparison of Cyclic Voltammetry Measurements of Paper-Based Screen Printed Electrodes via Proprietary and Open Source Potentiostats
Igor Karlovits,a Urška Kavčič,a Špela Trafela,b and Kristina Žužek Rožman b,c
The use of screen-printed electrodes in different monitoring applications, e.g., polluted water, biotechnology, agriculture, industrial process control, and other applications, are continuously being developed. New cheap and open-source potentiostats have been recently emerging, in addition to the commercial and proprietary solutions on the market. In this study, paper-based, screen-printed electrodes were utilised as an alternative solution for ceramic-based electrodes and were tested with two potentiostats (proprietary and low-cost open-source running on wireless 64 bit Linux system installed on Raspberry Pi 3+). Unique paper substrates made from invasive plant papers and one commercial product were used for screen electrode printing. Ink layer thicknesses variations and mechanical grinding were applied, and cyclic voltammetry measurements were conducted. The variation in cyclic voltammetry measurements could be attributed to two sources: the potentiostats showed differences in their sensibility and signal values, and paper surface and structure also contributed to differences. Simultaneously, the additional processing steps, e.g., mechanical grinding, introduced additional measurement variations and differences in the measurement process.
Keywords: Screen-printed electrodes; Paper properties; Cyclic voltammetry
Contact information: a: Pulp and Paper Institute, Bogišićeva 8, Ljubjana 1000 Slovenia; b: Jožef Stefan Institute, Department for Nanostructured Materials, Jamova cesta 39, Ljubljana SI-1000 Slovenia; c: Jožef Stefan International Postgraduate School, Jamova cesta 39, Ljubljana SI-1000 Slovenia; *Corresponding author: igor.karlovits@icp-lj.si
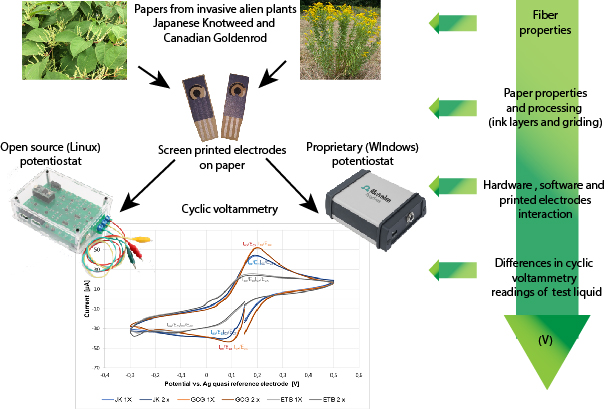
GRAPHICAL ABSTRACT
INTRODUCTION
Electrochemistry research is helpful in many different applications, ranging from life sciences to environmental and medical sciences. Cyclic voltammetry (CV) is a widely used electrochemical measurement method that provides values of redox reactions energetics, electron transfer dynamics, and rates of coupled chemical reactions. The measurement consists of scanning the applied potential on the working electrode and measuring the resulting current flow. The working electrode’s potential is cycled between two potential limits, inducing the oxidation and reduction of electroactive substances dissolved in the sample or absorbed at the working electrode surface (Foster et al. 2019). Cyclic voltammetry is a powerful but straightforward generic method for the electrochemical characterization of trace amounts of substances in water and deposits on conductive surfaces. Over the past few decades, screen-printed electrodes (SPEs), which are used as inexpensive electrochemical substrates, have experienced significant changes in their format and printing materials. Screen-printed electrodes have been successfully used for the rapid in situ studying of environmental toxins due to their favourable material properties, e.g., biodegradability, simplicity, and rapid reactions. The electrodes for portable devices have been primarily produced on ceramic surfaces; however, several studies have used paper substrates for electrode printing (Oh and Chow 2015; Yáñez-Sedeño et al. 2020). The interaction of paper substrates, which have porous hydrophilic surfaces, has not been thoroughly studied in terms of the papers’ properties and their influence with different electronics setups. The knowledge obtained from these interactions can be valuable in improving further usage of disposable and recyclable electrodes in fieldwork applications, especially in the environmental protection field. Besides using paper-like substrates for single-use measurement electrodes, e.g., in fieldwork, there has also been a noticeable trend in developing open-source potentiostats in the last few years. Since potentiostats have been primarily expensive benchtop versions for decades, this new development with the advent of microelectronics enables new applications and mobility. The influencing factors, of course, are the potentiostat elements and the sensing systems (printed electrodes). The potentiostats differ in their usage of signal microprocessors, voltage amplifiers, current to voltage converters, operational amplifiers, and other elements necessary to convert the signals into CV readings. With the ability to connect through different networking protocols (internet of things (IoT), 4G, WiFi), the use of CV can be expanded in terms of fieldwork, which is vital for sustainability preservation. The use of cheap screen-printed electrodes on low-cost paper substrates in conjunction with entirely open-source potentiostats that can connect through different network systems can lead to new applications. Besides, this combination can provide easy access for students and individuals to use CV or other electrochemical techniques in their research and measurements. According to a study by Dryden and Wheeler (2015), the circuits of the open potentiostats fall into four categories: (1) tiny instruments intended for implantation or wearable use; (2) low-cost instruments developed to feature extreme cost savings or field-portability (with a lower level of performance); (3) multiplexed instruments designed and developed for specialised applications involving arrays of electrodes; or (4) bench-scale instruments constructed around “virtual instrument” frameworks (which are useful for prototyping, but are expensive and lack robustness and portability).
Some of the solutions that can be prototyped or bought and upgraded include the Rodeostat (Long 2020), built as a potentiostat shield around the teensy 3.2 development board and has online P.C. Linux software packages with open-source documentation and hardware libraries. Recently, more than one cheap open source potentiostat has been built around this board. Glasscott et al. (2020) designed and developed SweepStat, capable of performing voltammetry amperometry. The device had the additional benefit of using ultramicroelectrodes (UME). The authors reported that cyclic voltammetry and amperometry measurements at macrodisk electrodes and UMEs offer high-quality data that corresponds to literature reported values, commercially available electrochemical workstations finite-element simulation packages. Another solution is the Dstat, which is built around the ATxmega 256A3U microcontroller and its additional circuitry (Dryden and Wheeler 2015). The authors have also tested the electrochemical performance of DStat with CheapStat (another open-source solution) and the performance of PalmSens via potassium hexacyanoferrate(III) and 4-aminophenol measurements. The three potentiostats produced the expected double peak-shaped cyclic voltammograms and similar values for the square wave voltammograms; however, there were individual measurement variations in the measurement data between the instruments.
The DStat and EmStat displayed almost identical voltammograms, characterised by smooth noise-free responses; variations in individual electrodes likely caused the slight differences between them. In contrast, the CheapStat potentiostat voltammograms were considerably different; the cyclic voltammogram had vast peak separation and reduced peak heights, and its square wave voltammogram peak was asymmetric, with substantial background current. Inspired and built with the Dstat, the ABE-Stat is capable of conducting routine electrochemical analyses, including cyclic voltammetry (CV), differential pulse voltammetry (DPV), and high impedance potentiometric measurements, as well as having wireless options through an Android interface (Jenkins et al. 2019). It has been claimed as the first fully open-source potentiostat capable of evaluating electrochemical impedance spectroscopy (EIS) across a broad frequency spectrum (0.1 Hz to 100 kHz) user-selectable amplitude and bias. The novelty, compared to DStat, was the incorporation of a network analyser chip (AD5933, Analog Devices, Norwood, MA) and reconfiguration of the control amplifier network to enable EIS across the spectrum (0.1 Hz to 100 kHz), with arbitrary bias and any of the four pre-programmed A.C. amplitudes.
Single CV and DPV scans were recorded for a three-electrode cell in an electrolyte solution containing equimolar concentrations of K4[Fe(CN)6], and K3[Fe(CN)6] were performed to validate the voltammetric functions of the ABE-Stat. Cyclic voltammograms
resulted in similar measurements obtained with a reference instrument with larger redox current peaks for bare gold wire electrodes than electrodes coated in polyethyleneimine. Also, DPV scans resulted in expected characteristic shapes of redox current curves, with substantial correction for the background currents from dielectric charging at the boundary layers and more prominent current peaks on bare wires. All the performed scans were symmetric, showing the high reversibility of the selected redox reaction.
The PSoC-Stat is another solution where an open-source potentiostat was made with a commercially available integrated circuit (I.C.), which does not need external electronic components to perform electrochemical experiments (Lopin and Lopin 2018). This result was achieved by using the Programmable System’s capabilities on a Chip (PSoC®) by Cypress Semiconductor, which integrates all of the necessary electrical components. This step eliminates the process of having to make a printed circuit board and soldering on electronic components. A graphical user interface (GUI) was developed in the python programming language to control the instrument. However, the authors point out some limitations regarding the noise optimisation of the offset voltage. This model has been tested against EmStat3 (a commercially available potentiostat) by using potassium ferricyanide (K3[Fe(CN)6]) and an additional test of lead determination in water and glucose measurements. Performing cyclic voltammetry on a five mM ferricyanide solution with 1 M KCl with a scan rate of 10 mV/s showed the characteristic oxidation and reduction peaks. There were slight differences between the traces, which could be due to electrochemical variations and temporal changes in the electrodes.
Two other solutions further upgrade the possibilities; enabling the use of mobile phones together with the potentiostat, e.g., UWED (universal wireless electrochemistry detector) (Ainle et al. 2018) and KAUStat (Ahmad et al. 2019), which the authors declare as a wireless wearable open-source potentiostats for electrochemistry measurements. The UWED has an RFduino microcontroller which contains a 32-bit ARM processor, memory, and peripheral components, i.e., a BLE for communication, a I2 C bus for interfacing with DAC, digital outputs for switches, and a 10-bit ADC with a conversion time of 70 μs for the measurement of the input signals. The authors used a commercial screen-printed three-electrode cell (DRP-110CNT-GNP, DropSens, Llanera, Spain) for performing C.A., SWV, and CV on ten μM to 10 mM of ferricyanide. In a comparison experiment, the cyclic voltammograms (C.V.s) of ferricyanide at three different concentrations, 10.0 mM, 0.1 mM (scan rate of 100 mV/s), and 1.0 mM (scan rates of 20 mV/s to 300 mV/s), were recorded; the UWED and the commercial potentiostat (Autolab) had similar peak shapes, peak potentials, and peak currents. The authors of KAUStat demonstrated the efficiency of the KAUSTat with three solutions: (1) a phosphate buffer saline (PBS) solution containing 137 mM of sodium chloride (NaCl); (2) a sodium hydroxide (NaOH) solution; and (3) a hexacyanoferrate probe (5 mM [Fe(CN)6]3-/4- and 0.1 M KCl) solution. All the CV measurements were conducted using platinum (Pt) as the counter, Ag/AgCl as a reference, and glassy carbon electrodes (GCE) as the working electrodes. In the PBS buffer, both the CV curves of KAUSTat and Emstat were comparable 80% of the chosen measurement period) set by the application. The difference in the clock timing explained the slight difference in peak heights. All of the comparisons between the open-source and newly developed potentiostats were primarily made with laboratory type electrodes or commercially available non-paper-based (ceramic type electrodes).
Paper Properties for Screen-Printed Electrodes (SPEs)
The other electrochemistry reading element is the electrode, especially if they are printed on substrates like paper. Due to its properties, paper has been a suitable and usable substrate for the past’s printed electrodes. For example, different biosensor applications have been used to analyse water samples with different kind of papers holders in a study by Peixoto et al. (2019), where cellulose filter paper, cellulose chromatography paper, nitrocellulose membrane, and printing paper were described and compared. In an article by Honeychurch and Hart (2003), similar paper substrates used in biosensing applications were accentuated and reviewed. All these reviewed articles primarily described the paper substrates’ material composition with no further details on the absorption or chemical interaction with the inks. Besides, the paper layers needed to be modified or pre-treated for some applications, e.g., with a spin coating to achieve additional functional property (Honeychurch and Hart 2003). The use of invasive plant papers for these purposes has not been widely studied except by Kavčič and Karlovits (2020). The combination of ink printing techniques and the influence of the paper is well known (Brodnjak et al. 2017), but newly developed materials (paper substrates) need to be tested due to the inherent influence of the fibre composition and surface sizing or coating, which can influence the absorption and ink spreading mechanism.
When printing electronics, to achieve excellent and accurate results, the screen-printed electrodes must have consistent quality regarding their ink film thickness and formation on the paper, as well as other characteristics; these are governed by the substrate ink interaction, after which the functional part of the process (the electrochemistry part) performs the reaction part. In this research, the authors have tested invasive plant species-based papers as electrode substrates, which were analysed via a commercially available potentiostat using the Windows operating system on P.C., and an open-source potentiostat was operated via a portable Raspberry Pi 3+ system running Linux. The portability of the Raspberry Pi system combined with the WiFi connection protocol enabled low costs, complete portability, and effortless transfer of technology into real-world applications outside the laboratory with a good signal reading quality.
EXPERIMENTAL
Methods and Materials
The screen-printed electrode (SPEs) samples were printed on three different printing materials; two were produced from invasive plant species, and one was commercially available cardboard.
Fallopia japonica (Japanese knotweed) (Pulp and Paper Institute, Ljubljana, Slovenia) is an invasive plant, which was made into cardboard from their fibres (JK 240 g/m2). Solidago gigantea (giant goldenrod) and Solidago canadensis (Canadian goldenrod) are also invasive species made into cardboard from their fibres (Pulp and Paper Institute, Ljubljana, Slovenia) (GCG 240 g/m2). Excellent top brown (ETB), which is commercially available cardboard (MM Karton, Vienna, Austria), in which 250 g/m2, made from 95% virgin fibres (chemical and mechanical pulp as well as 5% of the surface treatment), were used as the SPE carriers.
A handheld roughness tester (TR200) was used, and the average roughness (Ra), with a 0.8 mm cut-off length, was determined. For ink vehicle absorption, the authors used the K.N. ink absorption test based on the SCAN-P 70:09 ink absorbency test. The authors also used an internal test to determine the paper substrates’ micro-and macro-porosity, which governs the ink vehicle absorption. Also, the authors performed surface free energy measurements with water and formamide using a Fibrodat 1100 instrument.
To be compatible with the chosen commercial potentiostat measurement systems, screen-printed working electrodes (WE) with a 4 mm diameter were developed. A semi-automatic screen-printing system (GTO EVO 570) was used for printing, and the electrodes were screen-printed to achieve additional functions in three distinct layers with three different printing inks. In the first printing run, electrode connections and a quasi-reference electrode (RE) were printed with silver printing ink. The working (WE) and auxiliary electrodes (A.E.), printed with carbon printing ink, were added. Finally, dielectric printing ink was overprinted to determine the testing area. The working electrodes were also printed in one and two ink layer depositions. As an additional step, the authors mechanically grounded the working electrodes, as this was shown to be beneficial and to improve the electrochemical response (Pravda et al. 2001; Cumba et al. 2016; Lee et al. 2016; Kavčič and Karlovits 2020). The printed electrodes and the processing steps are presented in Fig. 1.

Fig. 1. Screen-printed electrode parts and processing steps: (a) one ink layer deposition; (b) two ink layer deposition; (c) grinding of the working electrode
Grinding removes the binder surface and opens up the silver particles in the ink layer. The grinding was performed with a fixed mechanical setup, and the same grinding stone was used for all samples. The technical parameters of the printing process and the used printing inks are presented in Table 1.
Table 1. Printing and Curing Conditions Used for Sample Printing

The samples’ electrochemical behaviour was characterised after the samples were printed using a DropSens μStat 300 Bipotentiostat (DropSens, Oviedo, Spain). For the cyclic voltammetry measurements, 100 μL of 2.5 mM potassium ferricyanide K3[Fe(CN)6] (Merck, Darmstadt, Germany) in 0.1 M KCl was used, and the cyclic voltammograms of six to ten samples were calculated for each paper form. The following cyclic voltammetry parameters were used for the measurements: Ebegin 0.15 V; Evtx1 -0.3 V; Evtx2 0.5 V; Estep 0.002 V; Scan rate 0.05 V/s; and the scan number was 1.
The other open-source potentiostat was the I.O. Rodeo (RSTAT-01) potentiostat, a fully functional open-source (hardware and software) potentiostat designed as an expansion board for the popular Teensy 3.2 development board. The current measurement range of the used open source potentiostat was: ± 1 uA, 10 uA, 100 uA, and 1000 uA, while the output voltage range is ± 1 V, 2 V, 5 V, and 10 V vs an Ag quasi-reference electrode. For the readings of the cyclic voltammetry measurements, there are two solutions (web-based and local computer-based solution). The open-source software was adjusted for a Linux 64-bit system and was installed on a Raspberry Pi 3+ system. The data collection were monitored through a web application available at the address http://stuff.iorodeo.com/apps/rodeostat/ (I.O. Rodeo Blog 2020). The authors conducted the measurements at values determined as having good cycling values (closed loops). After establishing this value as optimal instead of OCP and extremes, it was used for all other samples on this type of potentiostat based on trial and error.
RESULTS AND DISCUSSION
Ink deposition and the theory of ink spreading or ink slumping in screen printing can be divided into several parameters which can influence the printing. This study tested one of the high-value parameters which influence the fast-spreading mechanism and two of the slow-spreading mechanisms. The surface tension and surface free energy induces rapid spreading of the applied ink; when the surface tension is low, the ink viscosity is high (Abbott 2018).
Surface Roughness
The surface roughness values obtained via stylus profilometry were as follows: Japanese knotweed – the base paper had an average surface roughness value of 4.28 µm, and the working electrode had a Ra value of 2.53 µm; the goldenrod (giant and Canadian) had Ra = 6.06 µm, the working electrode had Ra = 2.36 µm, the ETB sample had Ra = 2.97 µm, and the printed working electrode had Ra = 1.42 µm. From these results, it can be seen that the invasive based papers (Japanese knotweed, giant goldenrod, and Canadian goldenrod) had higher surface roughness values due to a lack of coating and calendaring; after ink levelling was performed, the electrodes had similar roughness values. The ETB board had lower initial values since it was a smoother substrate, and thus the working electrode also had lower roughness values after printing and drying.
Surface Free Energy of the Substrates
The paper samples’ surface energy was measured using the harmonic contact angle method with two testing liquids (water and formamide) on a Fibrodat 1100 contact angle measurement device. The ETB carboard had a surface energy of 56.24 mJ/m2, the Japanese knotweed (J.K.) sample had surface energy of 78.3 mJ/m2, and the giant/Canadian goldenrod (GCG) sample had surface energy of 53.15 mJ/m2. All of the paper was in a suitable range that enables excellent printability. The differences in surface energy are important also regarding potential problems with adhesion, which is dependent on the surface energy of the printing inks.
Ink Absorbency
The ink oil absorbency test was carried out via a SCAN- P 70:09 ink absorbency test, in which a porosimetric ink (IGT Testing Systems, Almere, Netherlands) was applied to the paper surface, and after 2 min the excess ink was wiped off. The ink absorbency value was calculated from the measured reflectance values of the stained papers and the paper’s intrinsic reflectance value via a spectrophotometer. The results indicated that the ETB cardboard had a low absorbency value (69.08%), while the J.K. sample had an absorbency value of 88.62%, and the GCG sample had an absorbency value of 87.20%. The two paper types made from invasive plant species had similar oil absorbency values, while the ETB sample had more closed surfaces than the other samples; therefore, the ink vehicle was expected to hold out longer on the ETB paper surface.
Micro- and Macro-porosity
As the micropores (in this article defined as under 2 µm) primarily absorb the ink vehicle and the liquids, e.g., water, are primarily absorbed by macropores, the porosity parameters were determined using the micro-macro porosity test method described in (Karlovits et al. 2018). The differences in the paper samples’ porosity could influence the screen-printing ink deposition, while the macro-porosity could govern the absorption during the paper substrate’s measurement. The micro- and macro-porosity values are unitless and are presented in Table 2. The micro-porosity governs the ink resin filtration and the ink levelling of the deposited conductive inks.
Table 2. Micro- and Macro-porosity Values

As shown in Table 2, the ETB had a low micro-and macro-porosity index, which correlates with the ink absorbency value, while the J.K. and GCG samples had relatively similar micro-porosity values and significant differences in the macropores. These results mean that it is expected that the oil-like components will absorb more quickly in the J.K. and GCG paper samples (in addition to high ink absorbency values), while water and similar liquids will penetrate the J.K. sample in more significant amounts due to a greater number of open larger pores on the surface.
Cyclic Voltammetry Results
Cyclic voltammetry was applied to the different screen-printed electrodes, produced with J.K., GCG, and ETB materials, using a [Fe(CN)6]󠇅3-/4- redox standard, which exhibits a conjugated pair of peaks corresponding to the one-electron transfer of the redox couple, i.e., [Fe(CN)6]󠇅3-/[Fe(CN)6]󠇅4- (Cardoso et al. 2007; Rodriguez et al. 2009; Galicia et al. 2014). The cyclic voltammogram responses are shown in Figs. 2 through 7.

Fig. 2. The cyclic voltammetry results of the J.K. -, GCG-, and ETB-based papers with two different ink film thicknesses (all observed with a Dropsens commercial potentiostat)
A couple of well-defined redox peaks were observed at each cyclic voltammogram with distinct cathodic peak currents (Ired) and distinct anodic peak current (Iox) values. The cathodic peak currents (Ired) with negative values were observed at the potential of Ered, which can be attributed to the reduction reaction: [Fe(CN)6]󠇅3– + e- [Fe(CN)6]󠇅4-. The anodic peak currents (Iox) were reached when the surface concentration of [Fe(CN)6]󠇅4- was depleted, causing the anodic peak current (Iox) (Kissinger and Heineman 1983; Pečko 2014; Trafela 2020). The anodic peak currents (Iox) with positive values were observed at the potential of Eox, which can be attributed to the oxidation reaction: [Fe(CN)6]󠇅4- [Fe(CN)6]󠇅3- + e- (Cinti et al. 2017; Elgrishi et al. 2018).
First, cyclic voltammetry was applied to the 1x and 2x layer J.K., GCG, and ETB screen-printed electrodes. These cyclic voltammograms are shown in Fig. 2 and demonstrate one-electron redox behaviour, i.e., the oxidation of [Fe(CN)6]󠇅3- to [Fe(CN)6]󠇅4- in the cathodic region and the reduction of [Fe(CN)6]󠇅4- to [Fe(CN)6]󠇅3- in the anodic region, at a scan rate of 50 mV/s.
The redox peak potentials of the [Fe(CN)6]󠇅3-/4- system were not appreciably different between the 1x and 2x ink printed layers. The anodic peak (Eox)/cathodic peak (Ered) potentials were 0.15 V/0.05 V for ETB 1x and ETB 2x, 0.17 V/0.07 V for JK 1x and JK 2x, and 0.2 V/0.1 V for GCG 1x and GCG 2x, respectively. The peak-to-peak separation (ΔE = Eox–Ered) was calculated using 50 mV/s as the scan rate; the resulting peak separation was comparable among all the investigated electrodes. The results were as follows: approximately 100 mV for ETB 1x and ETB 2x, approximately 1.1 mV for J.K. 1x and J.K. 2x, and approximately 1.2 mV for GCG 1x and GCG 2x. As stated by Cinti et al. (2017), ΔE provides a qualitative estimation of the electron transfer rate due to the [Fe(CN)6]󠇅3-/[Fe(CN)6]󠇅4- redox process at the electrode surface. Hence, it appears evident that using different inks (ETB, J.K., or GCG) does not drastically influence the electrode reaction kinetics (Cinti et al. 2017; Elgrishi et al. 2018). The oxidation peak currents of the redox behaviour of Fe3+ to Fe2+ obtained with Dropsens commercial potentiostat were approximately 44.5, 44.5, 51.6, 51.6, 25.4, and 23.8 µA for the JK 1X, JK 2X, GCG 1X, GCG 2X, ETB 1X, and ETB 2X, respectively. The current responses for the reduction peak were -40.4, -40.4, -43.7, -43.7, -34.1, and -34.4 µA for the JK 1X, JK 2X, GCG 1X, GCG 2X, ETB 1X, and ETB 2X, respectively. The results generally showed that the smallest current intensity for the oxidation and reduction process in the ETB (1x and 2x) paper samples was due to the smoothest surface and the smallest electrode area with the lowest oil ink absorbency and micro-and macro-porosity. Once the roughness of the paper increased, the output current intensity also increased. The highest current intensity for the oxidation and reduction process was observed in the GCG (1x and 2x) samples, i.e., the paper with the highest surface roughness, ink absorbency, and micro-porosity. Furthermore, the additional reduction peak at -0.28 V and the oxidation peak at 0.02 V were observed in the ETB samples (ETB 1x and 2x), indicating a complex reaction mechanism, implying a molecular hydrogen interaction (cathodic adsorption and anodic desorption) with C-based ink.
Also, the CV behaviour of all three paper samples, with both ink film thicknesses, was studied using Rodeostat (an open-source potentiostat). Figure 3 shows the CVs of the 1x and 2x layer J.K., GCG, and ETB screen-printed electrodes obtained from a [Fe(CN)6]󠇅3-/4- redox system at a scan rate of 50 mV/s. The differences in the anodic-cathodic peak potentials (ΔE = Eox–Ered) were approximately 100 mV for all six samples, which indicated similar electrode reaction kinetics. Furthermore, the oxidation peak currents observed with open-source potentiostat are approximately 41.5, 42.0, 38.8, 34.0, 34.4, and 28.9 µA for the JK 1X, JK 2X, GCG 1X, GCG 2X, ETB 1X, and ETB 2X, respectively. The current responses for the reduction peaks were -40.4, -39.2, -40.3, -34.9, -32.8, and -33.1 µA for the JK 1X, JK 2X, GCG 1X, GCG 2X, ETB 1X, and ETB 2X, respectively. With the differences in the current intensities for the oxidation and reduction process being minor between the JK, GCG substrates, and ETB films compared to the CV measurements observed with a commercial potentiostat.

Fig. 3. The cyclic voltammetry results of the J.K. -, GCG-, and ETB-based papers with two different ink film thicknesses (all observed with an open-source potentiostat)
One of the possible sources of the CPU unit’s differences was the fact that the digital signal processor of the open-source potentiostat is not as powerful as the commercial one. As seen from Fig. 3, an apex was observed at a starting potential -0.3 V, which most probably represented a complete reduction reaction of [Fe(CN)6]󠇅3- to [Fe(CN)6]󠇅4- at the surface of the working electrode, since the highest current values were observed. However, in the case of the commercial potentiostat (as shown in Fig. 2), the surface species ([Fe(CN)6]󠇅3-) were reduced via potential scanning towards -0.3 V in a cathodic scan, which was later oxidised in the reversed/anodic scan.
Furthermore, the influence of grinding was tested to study electrode sensitivity. The CV profiles obtained from the [Fe(CN)6]󠇅3-/4- system with the commercial potentiostat are presented in Fig. 4 (one ink layer) and Fig. 5 (two ink layers). The CV profiles obtained from the [Fe(CN)6]󠇅3-/4- system with the open-source potentiostat are presented in Fig. 6 for (one ink layer) and Fig. 7 (two ink layers).
As shown in Figs. 4 and 5, the redox peak potentials and the current values of the ground samples from the [Fe(CN)6]󠇅3-/4- system were not appreciably different between 1 or 2 layers of printed ink. The oxidation peak currents for the ground samples JK 1X G, JK 2X G, GCG 1X G, GCG 2X G, ETB 1X G, and ETB 2X G were observed with DropSens commercial potentiostat as follows: 38.0, 36.7, 59.3, 59.4, 32.6, and 32.7, respectively. The current responses for the reduction peaks obtained with commercial potentiostat were -36.6, -34.0, -54.9, -54.1, -33.6, and -33.6 µA for the JK 1X G, JK 2X G, GCG 1X G, GCG 2X G, ETB 1X G, and ETB 2X G, respectively.

Fig. 4. The cyclic voltammetry results of the J.K., GCG, and ETB-based papers with one layer-ink thickness and one layer-ink thickness with additional grounding (Dropsens commercial potentiostat)

Fig. 5. The cyclic voltammetry results of the J.K., GCG, and ETB-based papers with two layer-ink thickness and two layer-ink thickness with additional grounding (Dropsens commercial potentiostat)
The difference between the anodic peak and cathodic peak potentials (ΔE = Eox – Ered) did not change after the grinding process for any of the samples (ETB 1x G, ETB 2x G, J.K. 1x G, J.K. 2x G, GCG 1x G, and GCG 2x G) (Arduini et al. 2012). However, the CV measurements observed using a commercial potentiostat (as shown in Figs. 4 and 5) indicated that the grinding process changed the electrodes’ surfaces, i.e. electrode areas reflected in the CVs as changes in the peak current values and a shift of the potential peak values. The grinding process caused an increase in the peak intensity of the anodic and cathodic currents for the GCG 1x G, GCG 2x G, ETB 1x G, and ETB 2x G samples. The increase in the peak intensity can be ascribed to the increased electrode surface areas of the GCG and ETB-based electrodes, as the grinding process increased the roughness of surfaces. The mechanical grinding process polished away the outer-ink-layer ridges of the printed ink, thus increasing the micro-level surface roughness of the inner-ink-layer’s carbon particles (Arduini et al. 2012; Kavčič and Karlovits 2020).
In contrast, the peak intensity of the anodic and cathodic currents for the JK 1x G and JK 2x G samples decreased after the grinding process. While the grinding process was performed manually with the same setup as the ETB and GCG electrode samples, the reason for a lower electrochemical response, i.e., the current values, could be either of the following. The J.K. ink-printed working electrodes had the highest surface roughness before the grinding process compared to the ETB and GCC samples. Hence, the JK-based working electrode samples’ mechanical grinding could level out some of the macro-level roughness and consequently decrease the anodic and cathodic current values (Foster et al. 2019). As the peak intensity of the anodic and cathodic currents for the J.K. 1x and 2x based electrode samples (J.K. 1x G and J.K. 2x G) decreased after undergoing the grinding process, the use of samples that were not ground, i.e., the J.K. 1x and J.K. 2x samples, could make the same platform more suitable to be used in the development of electroanalytical devices (Wong et al. 2012).
The grinding process shifts the oxidation and reduction peak potentials, which may arise from experimental error due to small changes in the Cl– ions concentration in the electrolytes (Harris et al. 2013). Even a tiny change in the Cl– concentration of the testing solution has been known to shift the electrode potential, as the reference electrode on the screen-printed electrodes is a quasi-reference and not a standard reference, i.e., a controlled inner filling solution and a salt bridge, e.g., Ag/AgCl (Cinti et al. 2017). Hariss et al. (2013) suggested that the separation of the quasi-reference electrode via a membrane or coating could be a solution for removing the quasi-reference electrode potential shift effect. Furthermore, from Figs. 4 and 5, the additional reduction peaks at -0.28 (Fig. 4, ETB 1X), -0.22 V (Fig. 4, ETB 1X G), -0.28 (Fig. 5, ETB 2X), and -0.22 V (Fig. 5, ETB 2X G), and the additional oxidation peaks at 0.01 V (Fig. 4, ETB 1X), 0.05 V (Fig. 4, ETB 1X G), 0.01 (Fig. 5, ETB 2X), and 0.05 V (Fig. 5, ETB 2X G) were observed in the ETB samples. The additional reduction and oxidation peaks in the CV curves indicate an additional redox process occurring, most probably due to cathodic hydrogen adsorption and the anodic hydrogen desorption, on the surface of the ETB electrodes (Mushrin et al. 2010; Stevens and Dahn 2003) . The presence of the additional reduction peak for hydrogen adsorption and oxidation peak for hydrogen desorption on the JK and GCG electrodes was not observed, which may suggest a significantly high energy barrier for those processes. Alternatively, the effect could be due to the unwillingness of the carbon support to accept the H-atoms in the case of JK-/GCG-based inks (Mushrin et al. 2010; Stevens and Dahn, 2003). Besides, it can be seen from Table 3 that the ratio of the peak current at the anode to the peak current at the cathode response (Iox/Ired) on the ETB electrodes diverge from 1, indicating a quasi-reversible or irreversible electron transfer in [Fe(CN)6]󠇅3-/4- which can be attributed to interfering (adsorption/desorption) reaction.
The CV measurements observed using the open-source potentiostat (as shown in Figs. 6 and 7) showed more significant overall differences in the current intensities for both the oxidation and reduction processes, which are due to different digital signal processing steps in the potentiostats. The oxidation/reduction peak currents obtained with open-source potentiostat were 50.5/-47.7, 44.2/-45.9, 42.7/-45.2, 52.7/-45.5, 27.5/-30.2, and 25.2/-31.4 µA for the JK 1X G, JK 2X G, GCG 1X G, GCG 2X G, ETB 1X G, and ETB 2X G, respectively. As shown in Figs. 6 and 7, the grinding process increases the electrochemical response, i.e., increases the current.

Fig. 6. The cyclic voltammetry results of the J.K., GCG, and ETB-based papers with one layer-ink thickness and one layer-ink thickness with additional grounding (open-source potentiostat)

Fig. 7. The cyclic voltammetry results of the J.K., GCG, and ETB-based papers with two layer-ink thickness and two layer-ink thickness with additional grounding (open-source potentiostat)
Also, the grinding process causes an increase in the peak intensity of the anodic and cathodic currents for the GCG 1x G, GCG 2x G, J.K. 1x G, and J.K. 2x G samples. The increase in the peak intensity can be ascribed to the increased surface roughness and with it connected to larger electrode area of the GCG and JK-based electrodes; the mechanical grinding process polishes away the outer-ink-layer ridges of the printed ink and increases the surface area of the carbon particles present in the inner-ink-layer (Rodriguez et al. 2009; Kavčič and Karlovits 2020). However, the anodic and cathodic currents’ peak intensity for the ETB 1x G and ETB 2x G samples decreased after undergoing the grinding process. The observed decrease in the electrochemical response can be attributed to the polishing process, i.e., the grinding process probably levelled out some of the macro-level surface roughness and consequently decreased the anodic and cathodic current (Kavčič and Karlovits 2020).
To explore the reversibility of the electron transfer process, the peak current ratio (Table 3), i.e., Iox/Ired, rather than the individual peaks current values was compared. It was found that the JK and GCG-based electrode reactions can be referred to as a reversible electron transfer reaction as the Iox/Ired for Commercial Potentiostat is 10.18 and Iox/Ired for Open Source Potentiostat is 10.05. For the ETB electrodes, the electron transfer processes between [Fe(CN)6]󠇅3- and [Fe(CN)6]󠇅4- reactions are referred to as a quasi-reversible or irreversible electron transfer reaction. As already described, the ETB electrodes are showing different CV behaviour in [Fe(CN)6]󠇅3-/4- electrolyte in comparison to JK and GCG electrodes, as the additional reduction peak at -0.28 V and the oxidation peak at 0.02 V were observed, indicating more complex electron transfer reaction mechanisms.
Furthermore, the CV measurements made with the open-source potentiostat (as shown in Figs. 6 and 7) indicated that the grinding process caused a slight shift in the anodic and cathodic peak potentials values (towards the positive values). The observed shift is attributed to experimental error, i.e., the small changes in Cl– ion concentration in the electrolytes, as explained above (Harris et al. 2013). The differences in the anodic-cathodic peak potentials are presented in Table 3.
Table 3. Anodic and Cathodic Peak Potential Difference

Table 3 includes the calculated peak current ratio (Iox/Ired) for Commercial (Dropsens) and Open Source Potentiostats (Rodeostat). Table 3 also shows that the open-source potentiostat had a more significant overall anodic and cathodic peak potential difference for almost all samples, and the grinding process further increased the difference between the potential difference measurements for the two potentiostats.
CONCLUSIONS
- By using unique paper-based substrates made from invasive plant fibre papers, SPEs were manufactured. The measured data on mobile commercial (black box) and open-source potentiostats, one with wireless options and one with a Linux operating system, found that the tested potentiostats yielded different measured values.
- While the voltammetry shapes were similar, the commercial potentiostat showed more significant variations in the measurements due to the paper samples’ properties; when measured on the open-source potentiostat, these differences, while similar, were smaller. This difference was probably due to the electrical setup and hardware components employed in the potentiostats.
- Another variable factor was the use of different kind of paper substrates. The surface and absorption differences of the substrates were also observed in the potentiostat measurements. These differences have not been thoroughly studied in terms of electrochemical measurements. This study’s findings indicate that the paper sample with the lowest surface roughness and porosity and a surface free energy of 56.24 mJ/m2 had the slightest variations and changes due to additional grinding. The other two papers carriers made from invasive plant species had greater surface roughness values and higher porosity values (macro and micro) with a massive difference in surface energy.
- The papers’ surface roughness influenced the peak values and resulted in different values when the ink film for the working electrode was varied. With improved surface smoothness, which would close the macropores, the invasive plant papers could be used as viable disposable and more sustainable electrodes carrier.
- These results indicate that the variation in the cyclic voltammetry measurements is twofold, i.e., the potentiostats have differences in their sensibility and signal values. At the same time, the properties of the paper samples (especially surface roughness and surface free energy), as well as additional processing steps, e.g., mechanical grinding (which can change the peak intensity of the anodic and cathodic peak potentials), can introduce additional measurement variations and differences in the measurement process.
ACKNOWLEDGMENTS
The authors are grateful for the Slovenian Research Agency’s support for providing funding (No. J2-8182).
REFERENCES CITED
Abbott, S. (2018). Printing Science: Principles and Practice, Creative Commons Co., Los Angeles, CA.
Ahmad, R., Surya, S. G., Sales, J. B., Mkaouar, H., Catunda, S. Y. C., Belfort, D. R., Lei, Y., Wang, Z. L., Baeumner, A., Wolfbeis, O. S., et al. (2019). “KAUSTat: A wireless, wearable, open-source potentiostat for electrochemical measurements,” in: Proceedings of the 2019 IEEE SENSORS, Montreal, Canada. pp. 1-4.
Ainle, A., Mousavi, M. P. S., Tsaloglu, M.-N., Redston, J., Bell, J. G., Fernández-Abedul, M. T., and Whitesides, G. M. (2018). “Open-source potentiostat for wireless electrochemical detection with smartphones,” Analytical Chemistry 90(10), 6240-6246. DOI: 10.1021/acs.analchem.8b00850
Arduini, F., Nardo F. D., Amine, A., Micheli, L., Palleschi G., and Moscone D. (2012). “Carbon black‐modified screen‐printed electrodes as electroanalytical tools,” Electroanalysis 24(4), 743-751. DOI: 10.1002/elan.201100561
Brodnjak, V. U., Muck, D., Tomc, H. G., Karlovits, I., Gregor-Svetec D., and Starešinić M. (2017). “Printed smart labels in packaging,” in: Printed Electronics 1st Edition, K. Yvon, and N. Fabrice (ed.), Nova Science Publishers New York, NY, pp. 1-80.
Cardoso, J. L., Fontes, M. B., and Gongoro-Rubio, M. R. (2007). “Development of an Integrated System for electrochemical detection,” ECS Transactions 4(1), 179-190. DOI: 10.1149/1.2813490
Cinti, S., Mazzaracchio, V., Cacciotti, I., Moscone, D., and Arduini, F. (2017). “Carbon black-modified electrodes screen-printed onto paper towel, waxed paper and parafilm M®,” Sensors 17(10), 2267-2279. DOI: 10.3390/s17102267
Cumba, L. R., Foster, C. W., Brownson, D. A. C., Smith, J. P., Iniesta, J., Thakur, B., do Carmo, D. R., and Banks, C. E. (2016). “Can the mechanical activation (polishing) of screen-printed electrodes enhance their electroanalytical response?” Analyst 141(9), 2791-2799. DOI: 10.1039/C6AN00167J
Dryden, M. D. M., and Wheeler, A. R. (2015). “DStat: A versatile, open-source potentiostat for electroanalysis and integration,” PloS One 10(10), 1-17. DOI: 10.1371/journal.pone.0140349
Elgrishi, N., Rountree, K. J., McCarthy, B. D., Rountree, E. S., Eisenhart, T. T., and Dempsey, J. L. (2018). “A practical beginner’s guide to cyclic voltammetry,” Journal of Chemical Education 95(2), 197-206. DOI: 10.1021/acs.jchemed.7b00361
Foster, R. J., Walsh, D., Adamson, K., and Spain, E. (2019). “Voltammetry | Overview,” in: Encyclopedia of Analytical Sciences (3rd Edition), P. Wordsfold, A. Townshend, C. Poole, and M. Miró (eds.), Elsevier, Amsterdam, Netherlands, pp. 209-217.
Galicia, M., Li, X., and Castaneda, H. (2014). “Interfacial characterisation of single-and multi-walled CNT-doped chitosan scaffolds under two flow conditions,” Journal of the Electrochemical Society 161(12), 751-761. DOI: 10.1149/2.0611412jes
Glasscott, W. M., Verber, D. M., Hall, R. J., Pendergast, D. A., McKinney, J. C., and Dick, E. J. (2020). “SweepStat: A build-it-yourself, two-electrode potentiostat for macro electrode and ultramicroelectrode studies,” Journal of Chemical Education 97(1), 265-270. DOI:10.1021/acs.jchemed.9b00893
Harris, A. R., Zhang, J., Cattrall, R. W., and Bond, A. M. (2013). “Applications of voltammetric ion-selective electrodes to complex matrices,” Analytical Methods 5(16), 3840-3852. DOI: 10.1039/c3ay40769a
Honeychurch, C. K., and Hart, P. J (2003). “Screen-printed electrochemical sensors and biosensors for monitoring metal pollutants,” TrAC Trends in Analytical Chemistry 22(7), 456-469. DOI: 10.1016/S0165-9936(03)00703-9
IO Rodeo Blog (2020) “Rodeostat Web app”, <https:// http://stuff.iorodeo.com/apps/rodeostat/>( 30.nov.,2020)
Jenkins, D. M., Lee, B. E., Jun, S., Reyes-De-Corcuera, J., and McLamore, E. S. (2019). “ABE-Stat, a fully open-source and versatile wireless potentiostat project including electrochemical impedance spectroscopy,” Journal of the Electrochemical Society 166(9), B3056-B3065. DOI: 10.1149/2.0061909jes
Karlovits, I., Lavrič, G., and Nemeš, T. (2018). “The influence of micro and macroporosity of paper on wet repellence mottling in offset printing,” Journal of Graphic Engineering and Design 9(2), 21-26. DOI: 10.24867/JGED-2018-2-021
Kavčič, U., and Karlovits, I. (2020). “The influence of process parameters of screen-printed invasive plant paper electrodes on cyclic voltammetry,” Nordic Pulp & Paper Research Journal 35(2), 299-307. DOI: 10.1515/npprj-2019-0070
Kissinger, P. T., and Heineman, W. R. (1983). “Cyclic voltammetry,” Journal of Chemical Education 60(9), 702-706. DOI: 10.1021/ed060p702
Lee, J., Arrigan, D. W. M., and Silvester, D. S. (2016). “Mechanical polishing as an improved surface treatment for platinum screen-printed electrodes,” Sensing and Bio-Sensing Research 9, 38-44. DOI: 10.1016/j.sbsr.2016.05.006
Li, Y. C., Melenbrink, E. L., Cordonier, G. J., Boggs, C., Khan, A., Isaac, M. K., Nkhonjera, L. K., Bahati, D., Billinge, S. J., Haile, S. M., et al. (2018). “An easily fabricated low-cost potentiostat coupled with user-friendly software for introducing students to electrochemical reactions and electroanalytical techniques,” Journal of Chemical Education 95(9), 1658-1661. DOI: 10.1021/acs.jchemed.8b00340
Long, J. (2020). “Open source potentiostat features,” (https://blog.iorodeo.com/open-source-potentiostat-features), Accessed 27 July 2020.
Lopin, P., and Lopin, K. V. (2018). “PSoC-Stat: A single-chip open source potentiostat based on a programmable system on a chip,” PloS One 13(7), 1-21. DOI: 10.1371/journal.pone.0201353
Mushrin, H. S., Rey, A. D., and Peslherbe, G. H. (2010). “Energetics and dynamics of hydrogen adsorption, desorption and migration on a carbon-supported palladiumcluster,” J. Mater. Chem. 20(46), 10503-10510. DOI: 10.1039/C0JM01559H
Oh, J., and Chow, K. (2015). “Recent developments in electrochemical paper-based analytical devices,” Anal. Methods 7(19), 7951-7960. DOI: 10.1039/C5AY01724F
Pečko, D. (2014). Electrochemical Study and Synthesis of Fe-Pd Ferromagnetic Nanowires for Future Magnetic Applications, PhD. Dissertation, Institut Jožef Štefan, Ljubljana, Slovenia.
Peixoto, S. P., Machado, A., Oliveira, H. P., Bordalo, A. A., and Segundo, M. A. (2019). “Paper-based biosensors for analysis of water,” in: Biosensors for Environmental Monitoring, T. Rinken, and K. Kivirand (ed.), Intech Open, London, United Kingdom.
Pravda, M., O’Meara, C., and Guilbault, G. G. (2001). “Polishing of screen-printed electrodes improves IgG adsorption,” Talanta 54(5), 887-892. DOI: 10.1016/S0039-9140(01)00347-2
Presa, M. J. R., Gassa, L. M., Azzaroni, O., and Gervasi, C. A. (2009). “Estimating diffusion coefficients of probe molecules into polyelectrolyte brushes by electrochemical impedance spectroscopy,” Analytical Chemistry 81(19), 7936-7943. DOI: 10.1021/ac9009808
Stevens, D. A., and Dahn, J. R. (2003). “Electrochemical characterization of the active surface in carbon-supported platinum electrocatalysts for PEM fuel cells,” J. Electrochem. Soc. 150, A770 DOI: 10.1149/1.1573195
Trafela, Š., Zavašnik, J., Šturm, S., and Rožman K. Ž. (2020). “Formation of a Ni(O.H.)2/NiOOH-Ni active redox couple on nickel nanowires for formaldehyde detection in alkaline media,” Electrochimica Acta 309, 346-353. DOI: 10.1016/j.electacta.2019.04.060
Yáñez-Sedeño, P., Campuzano, S., and Pingarrón, J., (2020). “Screen-printed electrodes: promising paper and wearable transducers for (bio)sensing,” Biosensors 10(7), 76. DOI: 10.3390/bios10070076
Wong, C. H. A., Ambrosi, A., and Pumera, M. (2012). “Thermally reduced graphenes exhibiting a close relationship to amorphous carbon,” Nanoscale 4(16), 4972-4977. DOI: 10.1039/c2nr30989k
Article submitted: December 2, 2020; Peer review completed: March 20, 2021; Revised version received and accepted: April 11, 2021; Published: April 15, 2021.
DOI: 10.15376/biores.16.2.3916-3933