
Abstract
International markets for U.S. forest products continue to make a significant contribution to the national economy; sustaining growth in production and job creation as demand from domestic markets is still yet to match that observed during the early 2000s. In this context, industry, government, and academia remain focused on procuring better market shares in foreign markets. The goal of this research is to help hardwood mills to improve their understanding of the needs of potential clients abroad and thus helping them to develop a competitive advantage. An exploratory study based on text mining of questionnaire data was conducted following a competitive criteria-based model on the major foreign markets for U.S. hardwood products. From a sample of buyers attending trade shows in Asia and Europe, this work has identified a series of factors for manufacturers to consider in future export ventures. It was determined that price and quality play multiple roles in developing a competitive advantage. Color-consistency and an adequate stock of the right mix of species are considered minimum requirements to compete in those markets. In contrast, certain time-compression dimensions are perceived as opportunities to add value and, therefore, to stay ahead of the competition.
Download PDF
Full Article
Competitive Strategies for International Marketing of Hardwood Products Based on the Mining of Open Questionnaire Data
Edgar Arias,a,* Henry Quesada,b,* and Robert L. Smith c
International markets for U.S. forest products continue to make a significant contribution to the national economy; sustaining growth in production and job creation as demand from domestic markets is still yet to match that observed during the early 2000s. In this context, industry, government, and academia remain focused on procuring better market shares in foreign markets. The goal of this research is to help hardwood mills to improve their understanding of the needs of potential clients abroad and thus helping them to develop a competitive advantage. An exploratory study based on text mining of questionnaire data was conducted following a competitive criteria-based model on the major foreign markets for U.S. hardwood products. From a sample of buyers attending trade shows in Asia and Europe, this work has identified a series of factors for manufacturers to consider in future export ventures. It was determined that price and quality play multiple roles in developing a competitive advantage. Color-consistency and an adequate stock of the right mix of species are considered minimum requirements to compete in those markets. In contrast, certain time-compression dimensions are perceived as opportunities to add value and, therefore, to stay ahead of the competition.
Keywords: Forest products; Hardwood products; Competitiveness; Manufacturing strategy; Text data mining; Exports
Contact information: a: Resource Development Unit, South Carolina Forestry Commission, 5500 Broad River Road, Columbia, SC 29212 USA; b: Department of Sustainable Biomaterials, Virginia Tech, 1650 Research Center Drive (0503), Blacksburg, VA 24060 USA; c: Department of Sustainable Biomaterials, Virginia Tech, 230 Cheatham Hall (0323), Blacksburg, VA 24061 USA;
* Corresponding authors: earias@scfc.gov; quesada@vt.edu
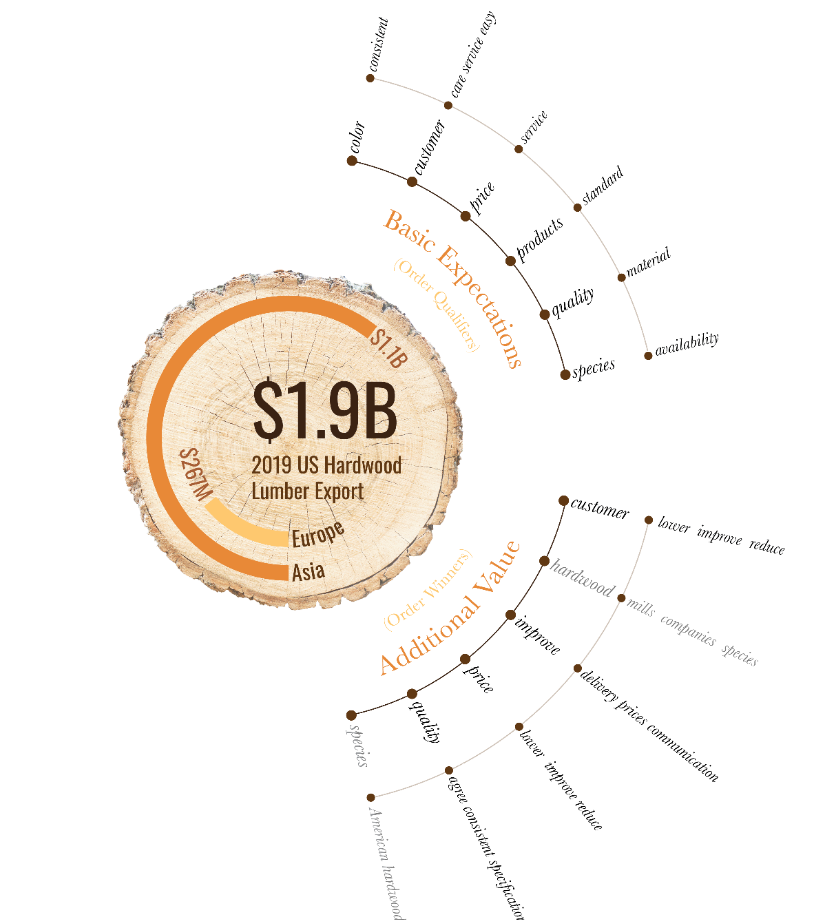
GRAPHICAL ABSTRACT
INTRODUCTION
The U.S. hardwood lumber industry saw a dramatic reduction in its production levels in the early 21st century because of the collapse of the domestic housing market in 2006, and the overall economic recession that followed. Sawmill closures, an almost 40 percent reduction in employment in wood manufacturing, and a 52 percent decrease in production are just some of the challenges the industry faced through 2012 (Howard and Westby 2009; Howard and McKeever 2014, 2016; Bureau of Labor Statistics 2019). The U.S. domestic housing starts, a critical economic driver for the forest products industry, began to decline in 2006. It fell from a historical record of 2.1 million starts in 2005 to almost half a million in 2009, the lowest level observed in the last 40 years (IBISWorld 2019). Sawmills and wood product manufacturers in general have greatly benefited from growing residential and commercial construction markets over the past five years to 2019 (Lifschutz 2018; Le 2019), but recovery to pre-recessionary is not expected anytime soon. These conditions have provided strong incentives to companies for turning their sights to international markets, in order to replace some of the demand lost after the 2008 economic meltdown. Exports of U.S. hardwood products have increased almost 104%, from 1.9 billion USD in 2009 to 3.9 billion USD in 2018, accounting for almost 20% of the nation’s lumber production, and observing a decade of almost uninterrupted growth (Food and Agriculture Organization of the United Nations 2019). Even though today’s demand for exports have not come to raise the industry’s production levels to match the 1999 records, they have indeed become a key driver for short and long-term growth, and thus there is no questioning the growing importance of international markets. Understanding the criteria and process followed by foreign buyers to evaluate and select their wood products suppliers is critical for mills to formulate appropriate market strategies. The literature on export performance is extensive in the factors studied and varied in the industries addressed. However, new efforts to study the specific aspects of the U.S. hardwood industry are still required for the current business environment. As previous research highlights, it is a growing concern for companies to stay up to date on the aspects that drive competitiveness in the top geographic export regions. The goal of this research is to help hardwood mills on improving their understanding of the needs of potential clients abroad and thus developing a competitive advantage.
An exploratory study based on text mining of questionnaire data was conducted following the competitive criteria-based model developed by the London School of Business. This study was conducted based on the major foreign markets for U.S. hardwood products. The following section is a review of central works on the concepts of competitiveness, value creation, and the customer order-qualifying and order-winning criteria, along with previous applications in the forest products industry. The methodology section presents research design decisions made on the instruments for data collection and analysis. Careful attention was given to text data analytics techniques. The results to the first six questions of the survey were used to build a profile of wood importers and it is followed by factors concerned with the evaluation and selection of suppliers. Finally, the last two sections offer a discussion of the results in light of the order-qualifying and order-winning criteria.
LITERATURE REVIEW
Competitiveness and Value Creation
In order to move an organization from its current state to a new and stronger one, business strategies need to be formulated to improve the organization’s competitiveness (Feurer and Chaharbaghi 1994). Competitiveness is defined as an organizations ability to persuade a customer to prefer its products or services over the competition. Thus, to understand these capabilities and competencies required to deliver a competitive advantage, the organization needs to be analyzed in parts. The organization needs to be regarded as a collection of discrete activities, which are performed in alignment with the organization’s business strategies. The value chain is a concept designed to systematically divide a firm into its “strategically relevant” activities, analyze their behavior and interaction, and determine their importance in the implementation of business strategies (Porter 1985). The term value is utilized in this context to denote the potential of these activities to deliver the firm’s value proposition (Kaplan and Norton 2000). According to this model, value is created by incorporating built-in features within the product or service so that customers are willing to pay the price. Under this paradigm, the value of the characteristics of products and services may vary from one context to another (e.g., by region or stage in the product life cycle). Hence, the importance of studying the drivers of competitive advantage for forest products companies entering international markets.
Forest Products Companies
Hoff et al. (1997) studied the available literature on sources of competitiveness for secondary wood product firms in 1997. They found that in order to improve their performance in international markets, U.S. firms need to be able to assess their relative competitive position in the market and understand how to influence their strategic determinants. According to Hoff, previous research indicates that such determinants correspond to the following: the firm’s processes, the external market, and government policy.
The primary forest products industry has also been the subject of multiple studies on competitiveness, which derived a series of critical factors for export ventures. However, as stated previously, there are still opportunities for understanding the relative importance of those critical factors within a firm’s strategic plan. Bush and Sinclair conducted a study to classify one hundred of the largest U.S. hardwood lumber producers, according to Porter’s three generic strategies: differentiation, focus, and cost leadership (Porter 1985; Bush and Sinclair 1991). In order to achieve a competitive advantage in domestic markets, Porter, Bush, and Sinclair’s studies suggest larger firms were moving away from traditional cost and production-oriented strategies, and more towards product differentiation.
Idassi et al. (1994) conducted a gap analysis between a southern hardwood lumber company and 14 of its customers to test discrepancies or gaps in expectations between the producer and customers. Personal interviews were carried out with the firm’s executives, and a mail survey was conducted for its customers. This study indicates that at least ten non-product related attributes were crucial in creating value from the customer’s perspective. The top five of these attributes were found to be service-related and include: accurate communication, personal relationship, supplier’s reputation, promptness of delivery, and competitive pricing.
A survey study conducted in 2002 addressed the relationship between value as perceived by customers, and the following factors: product, service, and price (relative to that of the competition) (Smith 2002). The non-statistical sample consisted of 460 U.S. purchasers of hardwoods, which were selected from a list of customers and prospects of two lumber production firms located in the upper Midwest of the United States (the total usable responses were 110). This research pointed out some difficulties in differentiating from “important” attributes and “value-added” attributes. For instance, consistent thickness and competitive price were found to be top attributes, but they proved to be of little help in influencing the customers’ value perception of the supplier. Conversely, the study highlighted that service-related attributes, such as species availability, were the most critical elements in improving customer value.
In 1992, Hammett et al. conducted a study that involved surveying nine hundred hardwood lumber manufacturers in the southern United States. In this study, logistical regression was utilized to model the relationship between firms’ characteristics and their participation in export markets. Their results suggest that production levels positively influence export participation, as well as the oak species produced, access to marketing-intelligence, covered-storage capacity, and the education level of the sales manager.
Bumgardner et al. (2004) found that surveyed firms believe in better product quality and more accurate delivery times to customers as fundamental characteristics of firms dominant in domestic markets. Schuler et al. (2001) suggests that for the U.S. wood furniture companies to remain competitive, it is necessary to establish the firm’s competitive advantages in terms of: “product quality, product line, customer service, price, [and] distribution…” among others.
Parhizkar (2008) studied the transportation and competitiveness practices of U.S. hardwood lumber exporters in Mexico, Asia, and Europe. In his study, a logistical regression of survey data was used to determine the factors that increased the firm’s involvement in international markets. It was found that specific transportation modes, hardwood species, marketing practices, and taking advantage of the government assistance programs had a positive effect on developing a high involvement in export markets.
Over the last decade of forest product research on competitiveness, a strong focus on country-level economic studies has prevailed against examining business-level performance, and the business-level focus is even less for solid wood products. The work from Korhonen et al. (2018), compiles some of the critical research on the latter, in a meta-analysis of 48 publications from 1986 through 2016, across multiple forest products sectors (e.g., woodpulp, paper, and solid wood). The authors identified more than a hundred drivers of competitiveness in the literature, which were categorized in “firm-level strategic decision making,” “firm characteristics and capabilities,” and “external influences.” While the study highlights the recurrence of strategies based on innovation and differentiation in the studied literature, it also asserts the need for additional research to understand the relative importance of different kinds of drivers.
In general, these studies confirm that firms in the forest products industry need to focus their resources on enhancing the value of critical aspects of their products and services to remain competitive both in domestic and international markets. However, the relative importance of such factors and the consequent prioritization that should be given through the firm’s strategic and tactical planning processes remain undetermined. Moreover, those companies serving international markets will benefit from further exploration of the comparative relevance of their products and services present in different geographies.
Order Winners and Qualifiers: A Manufacturing Strategy Framework
There is a critical connection between the manufacturing function and corporate success. Competitive strategies derive into corporate objectives, which once in the form of marketing strategies and plans, place particular demands on the manufacturing function (Skinner 1969). Market strategies are crucial in manufacturing as Hill explains in his 1986 article, Teaching Manufacturing Strategy. According to Hill, “manufacturing’s task is to provide those criteria which win orders in the marketplace better than its competitor’s manufacturing functions are able to do”. Hence, understanding how to position a firm’s manufacturing skills vis-à-vis its competitors is critical in establishing a long-term competitive advantage (Fine and Hax 1985).
Wickham Skinner (1969), a pioneer in defining manufacturing strategy, proposed that manufacturing policy decisions should be addressed at the strategic level of the organization, rather than the tactical and operational. The intention of this proposal is to exploit this function into a competitive weapon. In other words, manufacturing strategy exists in a series of decisions over a period, which leads to the desired set of manufacturing structure, infrastructure, and capabilities. Achieving success in manufacturing is by doing “the basic things a little better, every day, over a long period” (Hayes and Wheelwright 1984).
A manufacturing system cannot achieve high marks on every performance criterion at the same time, given the limitations intrinsic in any system with physical, technical, information, and human dimensions. The purpose of manufacturing strategy is to identify performance objectives based on these limitations, understand their relationship, assess conflicts, and choose the appropriate trade-offs (Skinner 1996). The concept of competitive priorities or competitive criteria has been coined to identify these manufacturing objectives (Dangayach and Deshmukh 2001). Previous research has identified a predominant set of competitive criteria repeatedly found in manufacturing strategy literature: quality, dependability of delivery, speed of delivery, cost, and flexibility (Leong et al. 1990). Alternative models found in later studies generally start from the same essential criteria (Spring and Boaden 1997).
In order to support corporate goals and create a competitive advantage, manufacturing and marketing strategies should be tightly integrated by properly addressing these tradeoffs (Kerr and Greenhalgh 1991). Market’s needs are determined by customers’ expectations from the industry; therefore, it is an essential task of the top executives of the company to match manufacturing capabilities to the needs of the target markets (Gerwin 1993). Nevertheless, companies have difficulties in realizing the effect tradeoffs have in winning orders (Hill and Chambers 1991).
The competitive criteria-based model developed at the London School of Business by Hill (1986, 1993) departs from other manufacturing strategy literature by providing the manufacturing-marketing link. The manufacturing-marketing link is a central role in his conceptual framework and planning-focused process, in which he introduces the concept of order-winning and order-qualifying criteria to bring closer the two functions (Spring and Boaden 1997). Per Hill’s model, an order qualifier (OQ) is an aspect of a product or service required for a customer to consider buying it. The order winners (OW) on the other hand, are characteristics that position the product or service above those of the competition. As stated by Hill, manufacturing strategy involves providing the qualifying criteria to enter or stay in the marketplace, understanding how orders are won, and developing the appropriate support strategy to deliver the winning criteria.
Multiple applications of Hill’s model are found in the manufacturing strategy literature. For forest products, notable examples are provided by Berry et al. (1995) who built a case for customer-driven manufacturing via the order-winner criteria by studying the U.S. furniture industry. Vickery et al. (1995) studied the effect of time-compression in performance of furniture companies, suggesting that delivery speed was becoming more of an order qualifier than an order winner. Also, in a later study, the author explored the dimensions of manufacturing competitive strength in the furniture industry, identifying innovation a crucial order winner (Vickery et al. 1997). Morash et al. (1996) conducted a survey among U.S. furniture firms with gross revenue above $10 million to assess the impact on the performance of demand-oriented versus supply-chain-oriented logistic capabilities. The study suggested that delivery speed, reliability, responsiveness, and low-cost distribution could represent true order-winners. A similar study carried out among Chinese companies highlighted aspects such as quality and flexibility as order winners, due to their strong relationship with financial performance (Robb and Xie 2003). Bozarth and Berry (1997) presented a methodology to measure marketing-manufacturing congruence based on Hill’s concepts of order winners and qualifiers, which served to profile a furniture firm’s manufacturing strategy.
Further exploration of order-winning criteria in the primary wood products sectors is yet to be conducted. The dynamism and complexity of global wood fiber markets, fragmentation of the U.S. forest products industry and rapid development of high-impact sectors such as biofuels, make it more necessary to align manufacturing and marketing functions in such a way that customers’ needs are addressed cost-effectively. This study incorporates Hill’s order-winning criteria to characterize hardwood lumber markets in Western Europe and Asia to help manufacturing firms formulate appropriate strategic plans and contribute to the industry’s growth.
EXPERIMENTAL
Research Instruments
An exploratory study based on survey methodology was designed following the survey research process and guidelines for questionnaire construction proposed by Vaske (2008) and further addressed by Babbie (2010). Visual design, question-wording, and implementation procedures were developed around the “Tailored Design Method” formulated by Dillman et al. (2009). The decision to constrain the study to an exploratory level, as explained earlier, was based on the absence of previous research on order-winning criteria in the primary wood products sectors. For this purpose and given the advantages highlighted by Fowler (2009) for such measurement instruments, open-ended questions were deemed appropriate by the authors to allow the possibility of capturing unanticipated answers. The resulting set of nine questions addressed three main groups of variables of interest (Fig. 1): demographic characteristics of the respondent’s firm and its suppliers, basic expectations from demanded wood products and services, and perceived opportunities to create additional value. More specifically, the last three questions were used to explore the criteria observed by participating companies in evaluating their current hardwood products suppliers, and more importantly, the criteria followed to select new vendors.

Fig. 1. Questionnaire Design
Sampling
The focus of this study was on the major foreign markets for U.S. hardwood products: China, East Asia, and Western Europe (U.S. Census Bureau 2019). As a group, solid wood product importers in these markets were considered the population of interest, and individually, they constituted the units of study. Given the costs and logistical challenges of adhering to strict probability sampling, a rather economical non-probabilistic approach for sampling was followed. This method was followed by relying on industrial forums where units of study congregate naturally. A series of trade fairs were selected based on their target audiences and historic attendance numbers. Three fairs were visited over the summer and fall of 2013: the 14th International Furniture Fair (IFF) in Chengdu, China, the 11th Vietnam International Woodworking Industry Fair (VIWIF) in Ho Chi Minh City, Vietnam, and Interzum in Cologne, Germany. Exhibitor directories were consulted beforehand to formulate the sampling frame, which consisted of a list of potential buyers of hardwood logs, lumber, and panels among others.
Data Collection
Potential respondents were approached at their exhibit spaces by the interviewer who first self-introduced as student or faculty at the Dept. of Sustainable Biomaterials at Virginia Tech. The interviewer then provided a scripted explanation of the goals and mechanics of the interview, uses of collected data, and the policy for the protection of confidentiality and anonymity. The research team conducted one interview per confirmed hardwood buying company. Procurement specialists or managers were selected when possible, but representatives from other functions such as sales, marketing, and manufacturing were also considered due to the availability of respondents. Being that visited fairs were planned for international audiences, it was possible to conduct the fieldwork in English. The interview followed the sequence of questions illustrated in Fig. 1. Interviewers kept a record of answers on printed forms which were later transferred to a Microsoft Excel spreadsheet for data processing and analysis.
Data Analysis Methods
The answers to questions one through six were treated as categorical variables, and thus the analysis focused on the distribution of measurements, comparison of proportions in the form of contingency tables, and testing independence as described by Agresti (2002, 2007). Given the number of participating companies, Fisher’s exact tests for small samples were conducted while also following Agresti’s implementation. The alpha level was set at 0.01 instead of 0.05 to reduce the chance of a Type I error (Ott and LongNecker 2008). These steps were accomplished using the R programming language, with the support of the dplyr package for data transformation, ggplot2, ggalluvial, and treemapify for data visualization, and stats for testing independence (Wickham et al. 2016, 2019; Brunson 2018; R Core Team 2019; Wilkins 2019).
On the last three questions of the survey, text analytic techniques were implemented to identify the criteria observed by participating firms in evaluating and selecting their suppliers as patterns in the dataset with their responses. The structure of this work follows the framework for data mining projects proposed by Han and Kamber (2011) and the generic architecture for text mining systems recommended by Feldman and Sanger (2007). The work follows those frameworks for document pre-processing and the core mining operations and presentation. These were implemented for the R programming language by adopting the models by Silge and Robinson (2017), Wickham and Grolemund (2016), and Welbers et al. (2017). First, digital records with responses were imported from a Microsoft Excel file into a raw text corpus in R, one row per respondent (i.e., observation) and one column per question (i.e., variable/dimension) with each as a string vector. Then, data preparation consisted of a series of string operations to remove any punctuation and unnecessary spacing characters. Pre-processing operations were conducted in three phases: tokenization, normalization, and stop-words removal. Tokenization is the process of breaking string vectors into smaller parts called tokens. A token may consist of a single word (“unigram”), or consecutive sequences of words, called n-grams (such as pairs of words or “bigrams”). Normalization of tokens was achieved by making all text lowercase, and by applying Porter’s stemming algorithm to reduce tokens to their morphological base forms (stems) (Porter 1980). Common words in the English language are not useful for the analysis and were thus filtered out by matching them to a predefined list of “stop-words,” provided by the tidytext R package (Silge and Robinson 2016). Analysis of text was conducted on the resulting dataset following a bag of words (BOW) approach, in which only the frequencies of tokens per text are used, disregarding any syntax and word order (Boumans and Trilling 2016). This work was carried out via term frequency-driven techniques for text summarizing (Aggarwal and Zhai 2012). The answers for questions seven through nine were each summarized by calculating the relative frequency of tokens (i.e., term frequency) for unigrams and bigrams. This approach was applied to each question individually. In order to compare and contrast answers from questions seven and nine, which focused exclusively on new-supplier-selection, these were modeled using Latent Dirichlet Allocation (LDA). LDA is a generative statistical model popular for topic discovery on discrete text data, as defined by Blei et al. (2003) and implemented for R by Grün and Hornik (2011). When BOW techniques are used to represent the content of responses, each token is interpreted as a separate topic or dimension. To further the analysis, it is ideal to pursue a lower-dimensional representation of the content present in such texts. The literature on dimension reduction techniques is extensive, and those within the topic modeling category provide a statistical framework to achieve this goal. Such is the case for LDA, which follows a generative approach for statistical pattern recognition, thus reducing the number of parameters to learn in the process (Aggarwal and Zhai 2012; Sugiyama 2015). Like clustering on numeric data, LDA finds natural associations of terms by treating each document as a combination of topics, and each topic as a combination of words (Silge and Robinson 2017). For this study, a two-topic model fitting was conducted on questions 8 and 9 using the variational expectation-maximization (VEM) algorithm, treating each as independent sequences of words (i.e., documents) (Grun and Hornik 2011). The analysis focused on interpreting the probabilities per word and topic (β, beta), and the probabilities per document and topic or Dirichlet (γ, gamma) parameters (Blei et al. 2003; Aggarwal and Zhai 2012; Silge and Robinson 2017). More specifically, the gamma values were used to determine a topic’s presence on a given survey question. The topics addressed were “order qualifiers” and “order winners,” and the sum of their γ values equal one per question. On the other hand, the beta values showed the frequency of a given product or service-related factor as either order qualifier or winner. The goal here was to identify those with the highest values per topic.
RESULTS AND DISCUSSION
Wood Importers Profile
The pre-screening of the list of exhibitors in all three targeted trade shows resulted in an initial sample of 39 wood products companies, which were later filtered into a group of 29 companies that imported and utilized hardwood species in their manufacturing processes. Ten of them were from IFF, twelve from Interzum, and seven from VIWIF (Fig. 2). All the companies in the sample for IFF corresponded to hardwood importers and were therefore included in the final sampling frame, whereas only 86% and 64% of the firms from Interzum and VIWIF fell in this category, respectively. Job positions of interviewed company representatives (i.e., respondents) were coded into 14 distinct categories. The top three were “sales specialist” (24% of the sample), “sales manager” (21%), and “procurement specialist” (10%). These 14 job categories were further collapsed into four functional areas: “sales,” “procurement,” and “marketing” which accounted for 52%, 18.5%, and 11% of the final sample respectively. Departments grouped in the “others” category accounted for the remaining 18.5%.

Fig. 2. Distribution of respondents by trade show, location of main manufacturing site, and suppliers
Regarding the interviewed firms’ central manufacturing locations, eleven countries were represented in the sample and distributed by region as follows: 59% from Asia, 34% from Europe, and 7% chose not to disclose their location. The highest concentration of these firms corresponded to China, Germany, and France, which accounted for 41%, 17%, and 7% of the sample, respectively. While most of the companies interviewed in IFF were based in China (80%), a greater regional diversity was observed on those sampled at Interzum and VIWIF. The ratio of Asian to European firms at the former was 1:3, and 6:1 at the latter. Most of the wood used by these companies was procured by vendors in the USA, which was identified as the top partner country by 55% of respondents. Suppliers in Asia and Europe accounted for 20.7% and 10.3% of the instances, respectively. Other regions accounted for the balance of 14%. Trade of at least 20 different hardwood species was also reported by respondents, most of which corresponded to varieties of oak (28%), walnut (12%), ash (11%), and maple (7%). Figure 3 shows the distribution of the top seven hardwood species groups by the respondents’ location. More than half of the participating companies identified lumber as their top forest product import (52.2%), logs and veneers followed in importance by accounting for 19.6% and 17.4% of answers, respectively, whereas other commodities represented 10.8%.

Fig. 3. Top wood species by respondent location
Strategic Factors: Supplier Selection
Questions one through six were designed to build a profile of participating firms and their trade flows. The last items in the questionnaire addressed the criteria followed by respondents in their supplier selection processes, from primary considerations to opportunities for creating additional value. Again, text mining was used to process natural-language responses to these open-ended questions.
Evaluation of suppliers with existing contractual relationship
In order to begin with the exploration of factors involved in the supplier selection process, participating companies were asked about issues of concern in their relationship with existing vendors, and their answers were later separated into individual terms for text analysis. The relative frequencies for terms in the top 20th percentile are highlighted in Fig. 4. It should be noted that as an effect of the application of Porter’s stemming algorithm, the termination for some of the tokens changed (e.g., from “y” to “i“). For the sake of this report’s clarity, figures display those terms as such but will be addressed by the appropriate English termination in the narrative. To gain additional insight on the meaning of the most commonly used words: companies, price, supplier, quality, competition and products, further analysis of their relationships with other terms was conducted by examining their tendency to co-occur throughout the text dataset. Table 1 shows the relative frequencies for the top six sets of words: the Term 1 corresponded to one of the aforementioned top terms, which in combination with Term 2 showed the highest pairwise tf values. At least three observations can be made from the table. First, most of the pairs of words were combinations of two of the top six individual terms. Second, despite being the most common term, companies do not seem to constitute an evaluation factor of current suppliers. Also, more than half of these combinations include the terms price or quality. Fisher’s exact test for small samples was conducted against questions one through six, rejecting the hypothesis of independence only against trade show location (Table 2).

Fig. 4. Question 7: Term frequencies for issues with existing vendors (top 30 tokens)
Table 1. Question 7, Pairwise Relative Frequencies: Evaluation of Existing Suppliers

Table 2. Question 7: Fisher’s Exact Test of Independence

Selection factors for new suppliers: basic criteria
In question eight, respondents were asked to identify factors of concern in the selection of a wood products supplier. Text pre-processing of their answers initially resulted in 394 individual unigrams (i.e., single-word tokens or terms), but these were later reduced to a pool of 201 terms after stop-words were removed and normalization applied. The analysis of term frequencies identified a set of 105 different terms, with price and quality being the most common with relative frequencies of 7.96% and 7.46% respectively. When put together with customers, products, color, and species, the cumulative frequency amounted to 29.3%. The top 30 terms (relative cumulative frequency of 63.2%) are depicted in Fig. 5.

Fig. 5. Question 8: term frequencies for basic supplier selection factors (top 30 tokens)

Fig. 6. Question 8: Network diagram of bigrams for basic supplier selection factors
Further examination of the relationships between words was conducted for two-term combinations (i.e., bigrams), following the same steps described for unigrams. The network diagram presented in Fig. 6 depicts individual terms represented by nodes and their relationships by connecting lines, and the bigrams with highest frequencies are also listed in Table 3. The unigrams with highest term-frequency (tf) are highlighted in red. Both the visual inspection of the plot and the analysis of frequencies of the bigrams indicated the presence of clusters in the neighborhoods around the top 6 unigrams. Moreover, the top five relative tf values for all pairwise combinations corresponded to the set’s quality-price, customers-service, products-quality, species-availability and term-relationship, which amounted to 4.0% in the first case, and 2.7% in the following cases respectively. Finally, independence tests conducted between question 8 and respondents profile factors addressed in the previous section did not reveal any significant dependency for the top six terms identified here.
Table 3. Question 8, Pairwise Relative Frequencies: Basic Supplier Selection Factors

Selection factors for new suppliers: Opportunities to add value
The last question of the study was intended to capture opportunities for new suppliers to create additional value to their products and services. This time again, responses were split into individual terms, yielding a dataset of 242 words. A total of 138 different terms were identified in the analysis of frequencies, the top 12 accounting for 30% of the dataset. Here the most common terms corresponded to prices, quality, hardwood, customer, improve, and species, with relative tf values amounting for 4.96%, 4.96%, 3.31%, 2.48%, and 2.07% for the last two respectively (Fig. 7). Additional context to help with the interpretation was provided by the analysis of relationships between terms, which are depicted by the network diagram in Fig. 8. The bigrams with highest frequencies are also listed in Table 4. In order to simplify the analysis, it is first noted that the terms hardwood and species do not directly address any product or service-related features, despite being common in the narrative used by respondents. The top bigrams for price indicate a common interest among participating companies in seeking opportunities for cost reduction, whereas those for quality suggest a concern with improving consistency in meeting product specifications. The relative term-frequencies found for the customer and improve bigrams show the respondents’ interest in customer-service and customer-education. They also show interest on improving delivery, prices, and communication. The independence tests conducted against questions one through seven did not reveal any significant associations.

Fig. 7. Question 9: term frequencies opportunities to add value (top 30 tokens)

Fig. 8. Question 9: network diagram of bigrams of opportunities to add value
Table 4. Question 9, Pairwise Relative Frequencies: Opportunities to Create Additional Value

Topic modeling: Primary vs. Advanced supplier selection factors
The Latent Dirichlet Allocation algorithm was used to fit a two-topic model from a dataset containing responses to questions seven and nine. Per question per topic (gamma) values indicate that contribution of question eight to topic A was close to 100%, but almost zero to topic B (Table 5). The opposite was also observed for question nine, because its contribution to topic A was almost zero. However, it was very close to 100% for topic B. Figure 9 shows the top 10 terms per topic with their corresponding (beta) probabilities. Here, at least four terms were found to be shared between both topics: price, quality, customers, and species, which also amounted to the highest values for each subset. Also, as it was noted in previous analyses, terms such as supplier, broker, hardwood, and companies are frequent in respondents’ narrative but do not necessarily refer to supplier selection factors. Consequently, the principal contrast between topics is found on two subsets of terms: for topic A, products, color, and availability, and topic B, improve, time, dimensions, and lower. Previously, it was established that the term products was mainly associated with quality, and availability with species. It was also determined that the term improve was highly related to delivery and prices, and time to delivery as well.
Table 5. Per-question-per-topic (gamma) Probabilities for Questions Eight and Nine


Fig. 9. LDA: ten most common terms by topic/question (beta values)
DISCUSSION
Participating companies seemed to share concerns about the quality of the products, pricing, and payment conditions from their hardwood products suppliers. These issues appeared to be indifferent to the location of suppliers, products, and wood species procured. Exceptions were found based on trade show location, where VIWIF exhibitors showed the highest proportion of firms concerned about pricing and competition. Those at Interzum had the most considerable group of firms interested in quality, and payment conditions drove more attention at IFF. Such contrasts were not observed when the survey shifted its focus to new supplier selection. For question 8, surveyors asked companies to share their priorities at the time of recruiting new suppliers of hardwood products. Here again, price and quality remained as the primary considerations, as it was also remarked by Smith (2002) for the Midwest U.S. lumber market. Bush and Sinclair (1991) also recognized the need to maintain competitive prices as the base for other strategies, when they studied the 100 largest U.S. hardwood lumber producers. More recently, studies by DeLong et al. (2007), and Lähtinen and Toppinen (2008) on the Canadian and Finnish lumber markets provided additional evidence for the rationale behind cost-strategies. However, question 8 also provided insights into the expectations of products and services. It was confirmed that offering color consistency remains critical in the business and a new dimension was introduced; customer service, in the form of species availability. Similarly, the studies by Smith (2002) and Bumgardner et al. (2004) identified dimensions related to product quality as necessary to establish the firm’s competitive advantages. Nevertheless, Smith also points out that previous research has faced some difficulties in assessing the impact these dimensions have on the customer’s value perception. Here, the last question of the survey (nine) asked again for considerations for new suppliers, but this time by adding the concept of value-added to help in differentiating from basic expectations. Here, the term “improve” was found to be central in the respondents’ narrative. Participating firms seemed to be interested in improvements in pricing and product quality, but also on on-time-delivery, order lead times, and the language spoken in communications with suppliers. Questions 8 and 9 were intended to address two different concepts respectively, to capture order-qualifiers (OQ) or minimum expectations to be considered by potential clients, and order winners (OW) to identify opportunities to separate from the competition, as an application of Hill’s model (1986, 1993). The gamma probabilities obtained through topic modeling confirmed that indeed answers to both questions represent separate topics. Common factors such as price and quality seem to operate at two levels: competitive pricing and adequate quality are required to stand next to the competition, but additional improvements may provide better positioning. The rest of the OQ and OW factors consisted of a combination of product and service-related attributes. As LDA highlights, color consistency and species availability are the main product and service-related OQ attributes, respectively. In order to achieve differentiation, on the other hand, it is necessary to focus on shorter lead-times, improving consistency on product dimensions, and increasing on-time-delivery (OW). This is consistent with the observations made by Vickery et al. for the U.S. furniture industry in 1995, which led them to assert the importance of “time-compression” dimensions, including production lead time and delivery speed. However, contrary to their prediction that such variables would migrate from OW to OQ status for furniture, this study, which captures buyer’s attitudes towards solid wood products, still places them as opportunities to achieve further value. Further, the work by Vickery et al. focused on U.S. suppliers, whereas this study approaches firms overseas too. Morash et al. (1996), which also studied the U.S. furniture industry, concluded that delivery speed, and delivery reliability (i.e., on-time delivery), could be considered true order-winners and pillars in the strategic planning as they displayed strong correlations with a firm’s financial performance. Bumgardner et al. (2004) specifically pointed out the importance of achieving accurate delivery times to assert (domestic) market domination.
Companies entering new markets would benefit from focusing on establishing the appropriate cost structures to face competition in such ventures. Government agencies such as the U.S. Commercial Service, the Foreign Agricultural Services at the U.S. Dept. of Agriculture, and trade associations such as the American Hardwood Export Council (AHEC), have the infrastructure in place to help firms in researching this and other aspects for new markets of interest. This step is particularly critical to meet the expectations of potential customers on product quality, as the prevalent standard dimensions and grading rules in the U.S. might differ from those in the target markets. Moreover, developing a proper understanding of the size of these markets and their demand outlook may facilitate supply and capacity-related decisions needed to maintain appropriate inventory availability. Also, as the results of the study suggest, careful design and implementation of adequate logistics strategies may help in optimizing delivery lead-times and controlling on-time-delivery performance.
CONCLUSIONS
- This study aimed to identify drivers of competitive advantage for U.S. hardwood lumber companies from the perspective of buyers overseas; and establish a level of priority among such drivers. It was determined that price and quality play a dual role: they open the door to those in the U.S. hardwood export cluster for entering the competition, but they may also place them ahead of their rivals. It should be noted that the term “quality” encompasses multiple dimensions of a transaction, and further attention should be placed on the markets served by lumber buyers.
- Companies entering the lumber markets in Asia and Europe need to recognize the importance of achieving color-consistency on their shipments and keeping the adequate stock of the right mix of species, as they remain basic expectations in those markets.
- The path for those exporters with the capabilities to meet basic expectations of price, quality, and service should lead them to further their efforts on quality, price, shortening their lead times, or improving their on-time-delivery performance.
- This exploratory work has identified a series of product and service-related factors for hardwood product manufacturers to consider in the strategic planning of any future export ventures through a relatively small and diverse sample of companies. The use of open-ended questionnaires allowed participating firms to build their answers not limited by the previous research, but rather by experience and training. The selected text data analytic techniques helped develop an understanding of the topics addressed by respondents, less-dependent on intuition, and format-ready for quantitative analysis.
- Hill’s competitive criteria model helped assess the level of relevance for the factors observed, an aspect lacking in previous studies. Further research with a focus on specific wood commodities will help in addressing the particularities of such industries’ operating conditions. Considerations to emerging markets should be considered, given the current state of the country’s international trade. The use of text mining techniques will prove valuable in conducting more extensive studies based on unstructured data and in facilitating a more in-depth analysis of previous research.
ACKNOWLEDGMENTS
The authors are grateful for the support of the U.S. Federal-State Marketing Improvement Program, Grant FY2011; and of the Republic of Costa Rica, Ministry of Science and Technology Fellowship. The comments and questions provided by the three anonymous reviewers and the editor are also gratefully acknowledged.
REFERENCES CITED
Aggarwal, C. C., and Zhai, C. (2012). Mining Text Data, Springer-Verlag, New York.
Agresti, A. (2002). Categorical Data Analysis (2nd Ed.), Wiley-Interscience, Hoboken, New Jersey.
Agresti, A. (2007). An Introduction to Categorical Data Analysis (2nd Ed.), Wiley-Interscience, Hoboken, New Jersey.
Babbie, E. R. (2010). The Practice of Social Research (Vol. 12th), Wadsworth Cengage, Belmont, CA, USA.
Berry, W. L., Hill, T. J., and Klompmaker, J. E. (1995). “Customer-driven manufacturing,” International Journal of Operations & Production Management 15(3) 4-15. DOI: 10.1108/01443579510080517
Blei, D. M., Ng, A. Y., and Jordan, M. I. (2003). “Latent dirichlet allocation,” Journal of Machine Learning Research 3(Jan), 993-1022.
Boumans, J. W., and Trilling, D. (2016). “Taking stock of the toolkit: An overview of relevant automated content analysis Approaches and techniques for digital journalism scholars,” Digital Journalism 4(1), 8-23. DOI: 10.1080/21670811.2015.1096598
Bozarth, C. C., and Berry, W. L. (1997). “Measuring the congruence between market requirements and manufacturing: A methodology and illustration,” Decision Sciences 28(1), 121-150. DOI: 10.1111/j.1540-5915.1997.tb01305.x
Brunson, J. C. (2018). “ggalluvial: Alluvial Diagrams in “ggplot2.”,” (https://cran.r-project.org/package=ggalluvial), Accessed 17 June 2019.
Bumgardner, M., Buehlmann, U., Schuler, A., and Christianson, R. (2004). “Domestic competitiveness in secondary wood industries,” Forest Products Journal 54(10), 21-28.
Bureau of Labor Statistics (2019). “Economic Releases, Series Report for Wood Products (CES3132100001), Washington, DC,” (https://data.bls.gov/cgi-bin/srgate), Accessed 22 July 2019.
Bush, R. J., and Sinclair, S. A. (1991). “A multivariate model and analysis of competitive strategy in the United States hardwood lumber industry,” Forest Science 37(2), 481-499. DOI: 10.1093/forestscience/37.2.481
Dangayach, G. S., and Deshmukh, S. G. (2001). “Manufacturing strategy: Literature review and some issues,” International Journal of Operations & Production Management, 21(7), 884-932. DOI: 10.1108/01443570110393414
DeLong, D., Kozak, R., and Cohen, D. (2007). “Overview of the Canadian value-added wood products sector and the competitive factors that contribute to its success,” Canadian Journal of Forest Research 37(11), 2211-2226. DOI: 10.1139/X07-027
Dillman, D. A., Christian, L. M., and Smyth, J. D. (2009). Internet, Mail, and Mixed-mode Surveys: The Tailored Design Method. (3rd Ed.), Wiley & Sons, Hoboken, NJ, USA.
Feldman, R., and Sanger, J. (2007). The Text Mining Handbook: Advanced Approaches in Analyzing Unstructured Data, Cambridge University Press, Cambridge, UK.
Feurer, R., and Chaharbaghi, K. (1994). “Defining competitiveness: A holistic approach,” Management Decision 32(2), 49-58. DOI: 10.1108/00251749410054819
Fine, C. H., and Hax, A. C. (1985). “Manufacturing strategy: A methodology and an illustration,” Interfaces 15(6), 28-46. DOI: 10.1287/inte.15.6.28
Food and Agriculture Organization of the United Nations (2019). “Forestry Production and Trade,” (http://www.fao.org/faostat/en/#data/FO), Accessed 22 July 2019.
Fowler, F. J. (2009). Survey Research Methods (4th ed.), Sage Publications, Thousand Oaks, CA.
Gerwin, D. (1993). “Manufacturing flexibility: A strategic perspective,” Management Science 39(4), 395-410. DOI: 10.1287/mnsc.39.4.395
Grun, B., and Hornik, K. (2011). “Topicmodels: An R package for fitting topic models,” Journal of Statistical Software 40(13), 1-30. DOI: 10.18637/jss.v040.i13
Hammett, A. L., Cubbage, F. W., and Luppold, W. G. (1992). “A logistical regression-model of southern hardwood lumber export participation,” Wood and Fiber Science 24(3), 315-329.
Han, J., and Kamber, M. (2011). Data Mining: Concepts and Techniques (3rd ed.), Morgan Kaufmann, Burlington, MA.
Hayes, R. H., and Wheelwright, S. C. (1984). Restoring our Competitive Edge: Competing Through Manufacturing, Wiley and Sons, Hoboken, NJ, USA.
Hill, T. (1993). Manufacturing Strategy: The Strategic Management of the Manufacturing Function, Macmillan, United Kingdom.
Hill, T., and Chambers, S. (1991). “Flexibility – A manufacturing conundrum,” International Journal of Operations & Production Management 11(2), 5. DOI: 10.1108/EUM0000000001266
Hill, T. J. (1986). “Teaching manufacturing strategy,” International Journal of Operations & Production Management 6(3), 10-20. DOI: 10.1108/eb054762
Hoff, K., Fisher, N., Miller, S., and Webb, A. (1997). “Sources of competitiveness for secondary wood products firms: A review of literature and research issues,” Forest Products Journal 47(2), 31.
Howard, J. L., and McKeever, D. B. (2014). U.S. Forest Products Annual Market Review and Prospects 2010-2014, United States Department of Agriculture, Madison, WI.
Howard, J. L., and McKeever, D. B. (2016). 2016. U.S. Forest Products Annual Market Review and Prospects, 2012-2016, United States Department of Agriculture, Madison, WI.
Howard, J. L., and Westby, R. (2009). U.S. Forest Products Annual Market Review and Prospects, 2005-2009, United States Department of Agriculture, Madison, WI.
IBISWorld. (2019). “IBISWorld Business Environment Profile: Housing Starts,” (www.ibisworld.com), Accessed 23 July 2019.
Idassi, J. O., Young, T. M., Winistorfer, P. M., Ostermeier, D. M., and Woodruff, R. B. (1994). “A customer-oriented marketing method for hardwood lumber companies,” Forest Products Journal 44(7), 67-73.
Kaplan, R. S., and Norton, D. P. (2000). “Having trouble with your strategy? Then map it,” Harvard Business Review 78(5), 10.
Kerr, R. M., and Greenhalgh, G. R. (1991). “Aspects of manufacturing strategy,” Production Planning & Control 2(3), 194-206. DOI: 10.1080/09537289108919347
Korhonen, J., Hurmekoski, E., Hansen, E., and Toppinen, A. (2018). “Firm-level competitiveness in the forest industries: Review and research implications in the context of bioeconomy strategies,” Canadian Journal of Forest Research 48(2), 141-152. DOI: 10.1139/cjfr-2017-0219
Lähtinen, K., and Toppinen, A. (2008). “Financial performance in finnish large-and medium-sized sawmills: The effects of value-added creation and cost-efficiency seeking,” Journal of Forest Economics 14(4), 289-305. DOI: 10.1016/j.jfe.2008.02.001
Le, T. (2019). “IBISWorld Industry Report: 32111 sawmills & wood production in the US. Strong roots: Low unemployment and high corporate profit will drive growth,” (www.ibisworld.com), Accessed 23 July 2019.
Leong, G. K., Snyder, D. L., and Ward, P. T. (1990). “Research in the process and content of manufacturing strategy,” Omega 18(2), 109-122. DOI: 10.1016/0305-0483(90)90058-H
Lifschutz, M. (2018). “IBISWorld Sector Report 23 – Construction in the US. Building trust: Improvements in the commercial construction subsector will boost industry demand,” (www.ibisworld.com), Accessed 22 July 2019.
Morash, E. A., Droge, C. L. M., and Vickery, S. K. (1996). “Strategic logistics capabilities for competitive advantage and firm success,” Journal of Business Logistics 17(1), 1-22. DOI:
Ott, R. L., and Longnecker, M. (2008). “Inferences about population central values,” in: An Introduction to Statistical Methods and Analysis, (6th Ed.), Cengage Learning, California.
Parhizkar, O. (2008). Identifying Impact Factors on Successful Exporting of the United States Hardwood Industries to Mexico, Asia, and Europe., Ph.D. Dissertation, Virginia Tech, Blacksburgh, VA, USA.
Porter, M. E. (1985). Competitive Advantage: Creating and Sustaining Superior Performance, Free Press, New York.
R Core Team. (2019). “A language and environment for statistical computing,” R Foundation for Statistical Computing, Vienna, Austria, (https://www.r-project.org/), Accessed 9 November 2018.
Robb, D., and Xie, B. (2003). “A survey of manufacturing strategy and technology in the Chinese furniture industry,” European Management Journal 21(4), 484-496. DOI: 10.1016/S0263-2373(03)00079-3
Schuler, A., Taylor, R., and Araman, P. A. (2001). “Competitiveness of U.S. wood furniture manufacturers – Lessons learned from the softwood moulding industry,” Forest Products Journal, 51(7), 14-20.
Silge, J., and Robinson, D. (2016). “tidytext: Text mining and analysis using tidy data principles in R,” The Open Journal, 1(3). DOI: 10.21105/joss.00037
Silge, J., and Robinson, D. (2017). Text Mining with R: A Tidy Approach, O’Reilly Media, Inc. Publisher, California, United States
Skinner, W. (1969). “Manufacturing-missing link in corporate strategy,” Harvard Business Review, 47(3), 136-145.
Skinner, W. (1996). “Manufacturing strategy on the “S” curve,” Production and Operations Management 5(1), 3-14. DOI: 10.1111/j.1937-5956.1996.tb00381.x
Smith, T. M. (2002). “Exploring customer value in the hardwood lumber industry,” Wood and Fiber Science 34(1), 2-13.
Spring, M., and Boaden, R. (1997). “One more time: How do you win orders?: A critical reappraisal of the Hill manufacturing strategy framework,” International Journal of Operations & Production Management 17(8), 757-779. DOI: 10.1108/01443579710175547
Sugiyama, M. (2015). Introduction to Statistical Machine Learning (T. Green & A. Invernizzi, Eds.), Elsevier Inc. Publisher, Florida, United States
U.S. Census Bureau. (2019). “USA Trade Online,” (https://usatrade.census.gov/), Accessed 24 July 2019.
Vaske, J. J. (2008). “The Science of survey research,” in: Survey Research and Analysis: Applications in Parks, Recreation and Human Dimensions, Colorado State University, Fort Collins, CO, USA.
Vickery, S. K., Droge, C. L. M., Yeomans, J. M., and Markland, R. E. (1995). “Time-based competition in the furniture industry,” Production & Inventory Management Journal 36(4), 14.
Vickery, S. K., Dröge, C., and Markland, R. E. (1997). “Dimensions of manufacturing strength in the furniture industry,” Journal of Operations Management 15(4), 317-330. DOI: 10.1016/S0272-6963(97)00012-0
Welbers, K., Van Atteveldt, W., and Benoit, K. (2017). “Text analysis in R,” Communication Methods and Measures 11(4), 245-265. DOI: 10.1080/19312458.2017.1387238
Wickham, H. (2016). “ggplot2: Elegant graphics for data analysis,” (https://ggplot2.tidyverse.org), Accessed 9 November 2018.
Wickham, H., François, R., Henry, L., and Müller, K. (2019). “dplyr: A grammar of data manipulation,” (https://cran.r-project.org/package=dplyr), Accessed 9 November 2018.
Wickham, H., and Grolemund, G. (2016). R for Data Science: Import, Tidy, Transform, Visualize, and Model Data, O’Reilly Media, Inc., California, United States
Wilkins, D. (2019). “treemapify: Draw treemaps in ggplot2,” (https://cran.r-project.org/package=treemapify), Accessed 30 August 2019.
Article submitted: Friday, September 10, 2019; Peer review completed: November 9, 2019; Revised version received and accepted: August 24, 2020; Published: August 31, 2020.
DOI: 10.15376/biores.15.4.7872-7892