
Abstract
Download PDF
Full Article
Design and Development of Logistics Models for Residential and Commercial Biomass Pellets for Heat and Power Generation in the U.S.
Ulises Lacoa,a Guillermo Velarde,b Michael Kay,c Edgar Blanco,d and Daniel Saloni b,*
The U.S. is an important wood pellets producer for Europe, but in recent years there is special attention in the domestic market. This project developed mathematical logistics models in MatLab® that estimate distribution channels, transportation, and volumes for the domestic wood pellet demand. The models consider only demand in the northeastern U.S. based on current production in the Southeast. Two cases were studied: distribution to power plants and distribution to retail stores. Once the market needs were identified, logistics engineering principles and models were run to predict the distribution to different markets. Tools used in facility location and freight transportation analysis were run to provide an estimated logistic cost. One bulk pellet with 2 scenarios and 3 bagged pellet models (RISI 2016; 2017; 2018) with 2 scenarios were developed. After analyses for each model, it was concluded that wood pellet industry should direct its efforts to negotiate lower transport rates, which could represent a 70% cost reduction. While the wood pellet industry volume is smaller than the coal and chemical industries, the considerable cost difference indicates an opportunity to negotiate lower rates. The models developed can be used as tools to minimize the cost of distributing wood pellets to the northeast.
Keywords: Wood pellet; Logistics; Bioenergy; Biomass
Contact information: a: Chainalytics, Atlanta, GA 30312; b: Department of Forest Biomaterials, NCSU, Box 8005, Raleigh, NC 27695; c: Edward P. Fitts Department of Industrial and System Engineering, NCSU, Box 8005, Raleigh, NC 27695; d: MIT Center for Transportation and Logistics, Cambridge, MA 02139; *Corresponding author: desaloni@ncsu.edu
INTRODUCTION
World energy demand has been continuously increasing, and there is no indication that it will decline in the coming years. There is an imperative need for cleaner, sustainable, renewable energy sources that can be locally produced. Biomass can be part of a long-term plan to reduce the dependency on imported energy, as a national security strategy and a more sustainable and environmental friendly approach. One of the many pathways to utilize biomass as a source of energy is to create solid fuels by densifying biomass.
Energy densification is accomplished by a variety of technologies, including the processing of wood by-products such as sawdust, slabs, chips, etc. into uniform sized particles, which are then compressed into wood-based fuel products (Hassler 1990). The main advantage of wood densification is its ability to increase the bulk and energy density relative to non-densified materials such as chips, shavings, and sawdust. For example, the density of wood chips is about 200 to 350 kg/m3 at 30 to 50% moisture content, while the bulk density of wood briquettes and pellets ranges between 550 and 700 kg/m3 at 10% moisture content (European Biomass Industry Association (EUBIA) 2007; Karlhager 2008). The increased bulk and energy density obtained through compaction provides benefits including reduced storage volume, easier handling, lower transportation costs, and more homogeneous composition of the densified products (Hakkila 1989; EUBIA 2007) as well as less transport of water and oxygen. Studies have reported on the energy efficiency of converting wood residues into densified products, and subsequent combustion of these densified products is 30% better than the combustion of non-densified wood (Świgoń and Longauer 2005). In addition, densification increases the heating value of the wood per unit of volume and lowers the moisture content, producing a more complete and efficient burning, with lower particulate emissions, compared with that of firewood and other biomass sources (Ryu et al. 2006; Spelter and Toth 2009).
Over the past few years, wood pellets for combustion and electrical generation have been one of the most rapidly growing biomass products. These pellets are now traded internationally, and the production rate exceeded 6.2 million tons in 2009 (Mani 2006; Savolainien 2007; Bergman and Zerbe 2008; Junginger et al. 2008; Hess and Jacobson 2009; Spelter and Toth 2009).
Ekstrom (2014) discussed that after two quarters of double-digit growth, wood pellet export volumes to Europe increased just two percent in the 3Q/13. In addition, Ekstrom (2014) showed that the higher pellet demand and increased costs for wood raw-material pushed residential pellet prices upward in the German domestic market in 2013. Finally, pellet prices in the three major markets in Europe—Sweden, Germany, and Austria—have converged over the past four years. Projections by Savolainen (2007) and Walker (2013) for pellet consumption worldwide show considerable growth in the domestic pellet demand in the forthcoming years. There are two different projection models for the future domestic demand of biomass pellets in the U.S. Despite the fact that both models differ from the final projection quantities, from the most conservative to the most aggressive, both models project considerable growth in domestic pellet demand.
However, pellet prices for domestic consumption range from $165 per ton to $600 per ton depending on the location. This indicates that logistics represents an important concept to study and model in order to better predict and face the challenges for the future.
The aim of the present work is to provide U.S. pellet manufacturers as well as the heat and power users a better understanding of the main logistic considerations when distributing biomass pellets from the southeastern to the northeastern U.S.
This research assessed the wood pellet supply chain from the production of wood pellets to its conversion into heat and power. This was performed for commercial and residential customers by developing a logistic model for the forthcoming challenges. Cost structures were also reviewed and modeled.
This project designed and developed mathematical logistic models in MatLab® that replicated distribution channels, transportation routes, and volumes for the domestic wood pellet increasing demand, as discussed previously. For this research, the model only considered the demand of the northeastern United States based on the current production in the Southeast. Two cases were studied: bagged pellets for residential heating and bulk pellets for power generation plants.
This project presents the first step for a comprehensive model of the logistics of distributing wood pellets from the Southeast U.S. (currently the largest production of wood pellets in the world and is projected to continue to be the largest in the years to come) to the Eastern U.S., as representing the most appropriate domestic customer.
Production and Supply
Wood pellets are the product of a relatively simple mechanical process that relies on pressure to form wood fiber into a pellet. The raw material arrives in a variety of partially processed states (chips, shavings, sawdust, stripped bark, etc.), which must be dried and ground into a uniform size. The order of the pre-processing steps of drying and grinding does not matter. Once the raw material is dry and uniform in size, it is forced through a press under a very high pressure to create pellets. The pellets are then cooled to allow the natural bonding agents to set. Once the pellets have hardened, any loose material is screened out and fed back into the pelletizing process. The pellets are then ready to be distributed to the market (Peksa-Blanchard et al. 2007).
On the supply side in the United States, according to a study of the International Energy Agency Bioenergy (Hess et al. 2014), the current U.S. capacity of wood pellet production is about 6 MMT. The predominant sources of wood pellets are reportedly saw mill residues, wood chips, and round wood. Most of the produced saw residues are already being used for the production of pellets, partly because the forest product industry is shrinking. The U.S. forestry sector sees opportunity in pellet production, as production forests need to be maintained and harvested, and because pellet production will bring new revenues to the sector. The Renewable Energy and Energy Efficient Export Initiative (RE41), subsequent to the National Export Initiative (NEI), targeted wood pellets as one of the most promising export markets and indicated that the USDA would expand its analysis of exporting wood pellets and chips to other countries. Another export potential are pellets produced from agricultural wastes, such as crop residues. In the United States the availability of agricultural pellets is estimated at 157 MMT (Hess et al. 2014). However, the sustainability of U.S. wood pellets is limited by U.S. federal laws as enforced by the Environmental Protection Agency (EPA) that protect the forest land. In addition, the U.S. forestry industry established Best Management Practices (BMPs). About 20% of the forests are certified in the United States. In Georgia, 50% of the wood pellets are produced from the Sustainable Forestry Initiative (SFI) and the American Tree Farm System (ATFS) certified forests (Enviva 2011). SFI and ATFS are national programs endorsed by the Program for the Endorsement of Forest Certification (PEFC). Wood pellet production in the United States generally has a positive GHG savings balance, as wood resources and pellet production are situated close to ocean ports, with barge shipping being more efficient than road transportation (Flach et al. 2013).
Pellet fuel manufacturers should secure their supply of feedstock years in advance to avoid price fluctuations due to dips in feedstock availability and increases in use, such as during a cold snap. This will also enable pellet mills to stabilize their product supplies so consumers feel confident relying on this fuel source as a viable alternative to electricity, propane, and fuel oil (Washington State University 2012).
Transportation and Distribution of Pellets
Pellets can be distributed in bulk form by truck, rail, or ship or bagged in smaller quantities. Pellets can be purchased either bagged or in bulk and price can be calculated per total weight according to the moisture content. Bulk delivery of pellets is very similar to a delivery of home heating oil and is carried out by the truck driver blowing the pellets into the storage space, while a suction pump takes away any dust. Storage solutions include underground tanks, container units, silos, and storage within the boiler room (Peksa-Blanchard et al. 2007).
Demand for wood pellets has been progressively increasing (Pirraglia et al. 2010b) worldwide as wood pellets are considered carbon-neutral and renewable. Well-built transport logistics for wood pellets have been the key to their widespread use around the globe. Wood pellets are distributed in consumer-bags, big-bags, tank trucks, containers, railcars, and ocean vessels, depending upon the end user needs. Shipments in railcars and ocean vessels over long hauls have become the dominant transportation mode, as a response to the power generation industry needs. Pellets can be directly distributed to the end consumer by the producer’s particular transport and distribution system or by an intermediary system. Both methods may also be used. Independent of the distribution method applied, the access of moisture has to be inhibited to avoid problems for the conveying and combusting of the wood pellets. Supply to the end consumer can be managed by the producer or an intermediary, in bags or loose. In markets that are dominated by the use of pellets in the residential heating sector, loose transport is preferred. (Obernberger and Thek 2010).
Pellets are transported from the production location to an intermediary location by trucks, rail, and ships. Shipping, transport by truck, and transport by rail are all cost-saving because of the densified material in comparison to the transport of unidentified biomass fuels (Obernberger and Thek 2010).
U.S. domestic ocean transportation is limited by the Merchant Marine Act of 1920, also kown as, the Jones Act. Ocean transportation from and to a domestic port requires a ship built in the U.S., flying the U.S. flag, and staffed by mostly U.S. citizen. For this reason, ocean transport is not an area of study within the domestic wood pellet market (Lacoa et al. 2014).
Previous works (Gonzalez et al. 2011) studied the supply chain and delivered cost models for numerous feedstocks in the southern United States (loblolly pine, Eucalyptus, natural hardwood, switchgrass, Miscanthus, sweet sorghum, and corn stover).
Pirraglia et al. (2010a) carried a techno-economical analysis of wood pellet production for U.S manufacturers. The research considered the most important technical and financial factors that affect pellet production. The pellet production cost according to this study was $185, being profitable for both producers and distributors for selling prices higher than $219 per ton.
There have been several studies (Pirraglia et al. 2010b; Goh et al. 2013; Lacoa et al. 2014) on the export of wood pellets mainly to Europe. The present research provides additional knowledge regarding the strategy for the distribution of U.S. wood pellets.
Pellet Transportation
Transportation modes have been studied in North America for the export market in Europe. A combination of the availability of wood sources and existing infrastructure of ports, rail, and roads is a main factor for Southern US pellet producers to achieve competitive prices (Norris 2011).
Truck Transport
Trucks are commonly used for transportation distances less than 100 km. From an economic standpoint, pellet transportation might become unprofitable when exceeding a trucking distance of 60 to 100 km (Qiam and McDow 2013). Trucks are used to access areas of the production sites where train or ship infrastructure is not available, or flexibility is required for multiple small production sites. The shorter truck distances are compensated by the higher costs for using trains. Cost does not depend much on the type of transport but is more sensitive to the bulk density and moisture content of the transported cargo. Hoque et al. (2006) stated that trucks can be used for three cases of supply logistics of wood pellets:
- Transport from the production site to a terminal
- Transport from the terminal to the export harbor
- Transport from the import harbor to the energy plant
The first two cases are influenced by the distance and type of truck used. Hamelinck et al. (2005) showed that local transport to a central gathering point, harbor, or conversion facility takes place by truck, while long-distance transport is handled by train or ship.
Average speed and transfer time have also been studied given their importance in truck transport. According to Suurs (2002), trucks can be loaded or unloaded at a rate of two truckloads per hour – a value of 260 m3/h for pellets. All trucks are considered to travel at an average speed of 65 km/h.
Train Transport
Train transport is used for longer distances, greater than 100 km. Trains carry a volume of 2500 m3 and mass of 1000 t (Suurs 2002) at an average speed of 75 km/h. The number of trains necessary and the amount of time between two transports can be determined.
If North America follows the same renewable energy mandates as Europe, this could represent a huge opportunity for the railroad industry. Rail is definitely the most efficient way to transport wood pellets for the envisioned transit between the US southeast and northeast because of the massive tonnage capacity. It would take 200 to 300 trucks to move the same volume of wood pellets that can be transported by one intermodal train (Lowe 2009).
Qian and McDow (2013) described three principal ways to deliver wood pellets from a plant to a port: truck, rail, and barge. Road transportation is the most common method to deliver wood products, given its flexibility. Several large pellet producers use rail and barge instead. The southeastern U.S. can offer wood pellets at a competitive price mainly because of the existing infrastructure of ports, rail, and roads to deliver wood pellets to nearby deep-water ports. For example, Green Circle uses trains to run their freight from the plant (Cottondale, FL) to the Panama City Port at a contract rail rate not more than $7/ton (Norris 2011). Georgia Biomass is also transporting wood pellets by rail car to the Savannah port to limit FOB (Free On Board) cost. Wood pellets from Enviva’s Amory facilities are shipped by barge through the Tombigbee River and stored in the barge until they are loaded to a maritime shipping vessel. Under the scenario of transporting by truck, the delivery cost would range from $7.5 to $15/tonne pellet when the distance of transportation increases from 50 to 100 miles (Qiam and McDow 2013).
Logistics
Wood pellets are produced economically and stored in bag or loose form depending on the end user’s need, type, and supply system. For a short distance supply, truck transport is more realistic. Two possibilities are taken into account concerning long distance transport. For ship transport, pellets are transported to a nearby harbor from where they are shipped to the destination country’s import terminal. For train transport it is assumed that the biofuels are directly transferred on a freight train. In the destination country the pellets are delivered to an energy plant or other end-user from the harbor to the end-user if ship transport is employed.
Wood pellet transport systems can have a number of transfer points, depending on the location of the end-users. Previous studies have described the logistical and transportation system of exporting pellets from British Columbia, Canada to Sweden or the Netherlands (Hoque et al. 2006), where four possible transfer points were assumed: the production site, two transport terminals (export and import), and the end user (energy plant in Sweden or the Netherlands). An example is shown in Fig. 1.
Other studies (Hamelinck et al. 2005) included an extra gathering point between the production sites and the terminals. Local transport to a central gathering point, harbor, or conversion facility takes place by truck. Long-distance transport is done by train or ship. Some key operational variables when transporting pellets are the transport distance, capacity, product weight, product volume, fuel consumption, load factor, and transfer time and cost. Magelli et al. (2009) studied the logistics of transporting the product from Prince George to Vancouver, in which wood pellets were loaded onto a CN (Canadian National) train, and then transported to New Westminster before arrive at the Vancouver Port using the BNSF railway connection. This study showed that up to 40% of the energy content is consumed in producing and transporting wood pellets from Canada to Europe.
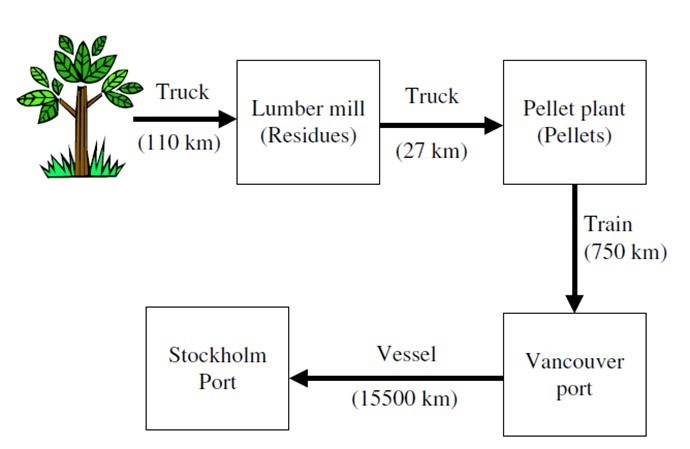
Fig. 1. Production and transportation logistics of wood pellets from the Canadian forest to the European market (Magelli et al. 2009)
Logistics models were also studied by Floden and Williamsson (2015) by means of a case study for Sweden. They investigate the use of intermodal transportation in integrated supply chains. The authors showed the scientific value of this type of studies. A domestic study was also performed in Tennessee to determine optimal logistics configurations for a collection/distribution hub market for bioenergy. The study showed the importance of analyzing feedstock logistics pathways to determine viable solutions for the bioenergy market (Chugh et al. 2016).
Storage
Pellet producers must have suitable storage and be equipped to maintain high inventory levels at times of peak demand. The demand for pellets is seasonal, and therefore a pellet plant supplying a local market may require an extensive area for the final product, as shipments to foreign markets are often in quantities of 5000 to 20,000 tons and require large areas of storage (Urbanowski 2005). Some pellet producers maintain storage space for up to 40% of their annual production. Some producers have arranged for storage at the site of their customers, and they bill the customer upon usage. Some producers give discounts in the off season to reduce inventory cost. Additional research has been done to understand and improve the wood pellet supply chains in the European market. Sikkema et al. (2010) identified three main markets within the European pellet market. For each of these markets, one illustrative case study was selected:
- Non-industrial bulk for heating: an average volume of about 15 to 20 tons of pellets is delivered to a district heating plant. This market type is most common in Sweden, where in 2008 1.1 million tons of pellets (60% of the total market) were used for district heating plants.
- Non-industrial pellets in small bags: small consumers buy small bags (15 to 25 kg) at a retail store and use them in small-scale heaters at home (about 5 tons per year). The average transported volume is about 0.25 tonnes. This market is typical of Italy, where about 600,000 tonnes of wood pellets were used in 2008 for residential heating (70% of the total market).
- Industrial bulk for electricity production for large-scale consumers with an annual demand higher than 3000 tonnes of pellets. This market type can be illustrated by the pellet market in the Netherlands, where about 875,000 tonnes of wood pellets were used in 2008 for power production. The majority of these pellets were imported from Canada.
EXPERIMENTAL
This project developed a mathematical logistics model in MatLab® to study distribution channels, transportation, and volumes for the domestic wood pellet increasing demand as discussed previously. For this, only the demand for the Northeast United States was modeled based on the current production in the Southeast. Two cases were studied: bulk pellets for power plants and bagged pellets for residential heating.
Bulk Pellets for Power Plants
Retrieve pellet mill data
The information for the pellet producers was obtained from Biomass Magazine (2014a) and included plant name, city, state, feedstock, and capacity (tons/year). The study was limited to the plants located in the South Atlantic region, which accounts for 34 plants in 6 states. After gathering this data, the longitude and latitude of the site was required for the model. Google Refine Application was used for the retrieval of the location coordinates by providing the plants’ street address through a Google Maps API. The locations of the 34 plants are shown in Fig. 2.
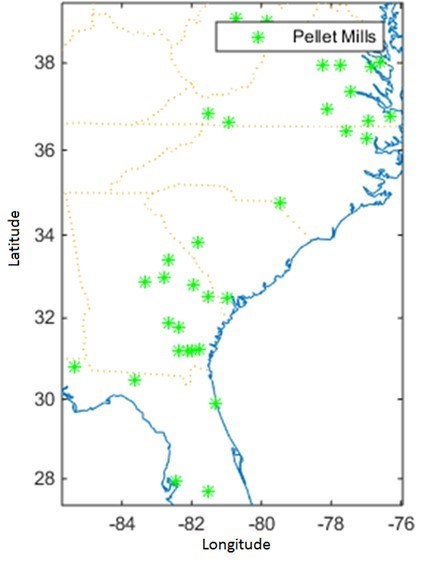
Fig. 2. Locations of the 34 pellet mills used in this study (U.S. South Atlantic region)
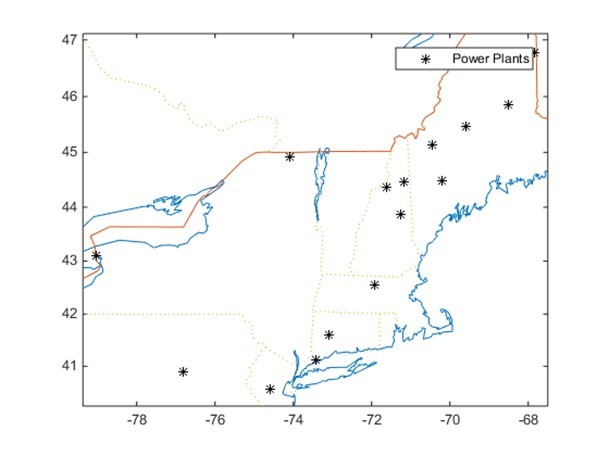
Fig. 3. Locations of the 16 power plants used in this study (U.S. North East region)
Retrieve Power Plant Data
The information for the biomass power plants was obtained from Biomass Magazine (2014b) and included plant name, city, state, feedstock, and capacity (MW). The study was limited to the plants located in the Northeast region, which accounts for 16 plants in 6 states. Similarly, the Google Refine Application was used to obtain the longitude and latitude coordinates. A conversion rate of 6709.7 tons per MW per year (Georgia Forestry Commission 2014) was estimated to obtain the pellet requirements for each plant. The locations of the 16 plants are shown in Fig. 3.
Build Railroad Network
The CTA Railroad Network is a representation of the North American railroad system that contains every railroad route in the US, Canada, and Mexico that has been active since 1993. It is intended for logical network programming, traffic analyses, and mapping applications. The corporate structure, a key to the simulation of routing, is explicitly temporal, allowing historical studies and comparisons. Supporting data on the interlines and corporate ancestry allow the construction of routable networks for a specific target date. The network is an extension of the Federal Railroad Administration’s strategic network (Railroad Network 2011).
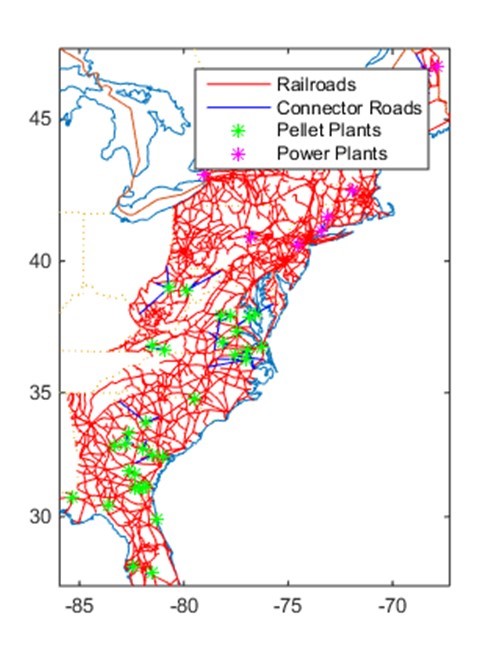
Fig. 4. Links and nodes in the railroad network (U.S East region)
Some of the data used to build this network were taken from Oak Ridge National Laboratory (2003). The data included node ID, location (longitude and latitude), as well as link ID, length, one-way flag (indicating if the link allows traffic to flow in both ways), and A and B nodes (indicating connecting nodes). The railroad network was only developed for the regions relevant for this project, i.e., Northeast and South Atlantic regions, according to the U.S. Census Bureau (2000). Figure 4 shows the geographical location of the links and nodes in the network.
An algorithm was developed for the creation of this network. Connector Roads were included in the network by using the addconnector function (Kay 2014b). Once the origin and destination points were included in the network, the shortest distance routes were identified by implementing the dijk function/dijkstra algorithm (Kay 2014b).
Transportation Problem
Once the shortest routes were identified, the minimum-cost set of flows over all the links was determined, such that demand was met and plant capacities were not exceeded. The trans function (Kay, Matlog Reference, 2014b) was used to solve this problem.
Shipment Construction
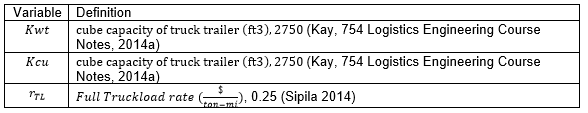
The formulas and definitions were included in the shipment structural array as shown in Table 1.
Table 1. Variables in the Shipment Structural Array
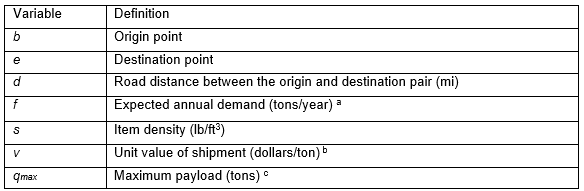
a output from the transportation problem
b A value of $220 per ton is considered for this model (The U.S. Endowment for Forestry 2014)
c The maximum payload for a shipment is the maximum size of each truckload and is determined by whether a trailer is constrained by weight or cubic volume.
Maximum Payload (tons)
The maximum payload qmax (tons) was calculated using Eq. 1:
![]() (1)
(1)
where s represents the item density (lb/ft3), Kwt represents the weight capacity of the truck trailer (tons), and Kcu represents the cube capacity of the truck trailer (ft3). A density of 40.5 was assumed for the wood pellets (Master Loggers 2014), 101 tons for Kwt (Canadiam National 2014), and 4000 ft3 for Kcu (Canadiam National 2014).
Kcu was calculated using Eq. 2:
 (2)
(2)
The revenue per loaded car per mile r ($/mile) was calculated using Eq. 3 (Association of American Railroads 2014),
![]() (3)
(3)
where rcl represents the full carload rate ($/ton/mile) and was assumed to be 0.15 (AAR 2014). The r was therefore calcualted to be 12.5 $/mi.
Total Logistics Costs
The total annual logistics cost (TLC) for shipments is given by the sum of the transportation cost (TC) and the cycle inventory costs (IC) at the origin and destination, as calculated by Eq. 4,
![]() (4)
(4)
where r represents the average shipment size (tons), q is the average shipment size (tons), α is the average inter-shipment inventory fraction at origin and destination, and h is the inventory carrying rate represented as the cost per dollar of inventory per year (1/yr).
Similar to the approach used in another work (Ravindran and Warsing 2013), it was assumed that, in the interest of “maximum efficiency”, full truckload capacities were shipped, meaning that Eq. 4 could be simplified with respect to q:
 (5)
(5)
It was also assumed that dock-to-rail yard transportation is included in the rail carrier’s freight charge. The in transit inventory is not included in the cost, even though it is known that this mode implies a significant transport time.
Bagged Pellets for Residential Heating
Retrieve pellet mill data
Similar to the first model, the data regarding pellet producers was obtained from Biomass Magazine (2014b). This information included plant name, city, state, feedstock, and capacity (tons/year). The location for the 34 plants is shown in Fig. 2.
Retrieve Retail Stores Data
The retail store information was obtained for Lowe’s (2014) and Home Depot (2014). This information included store, city, and address. The study was limited to the stores located in the Northeast region, which accounts for 608 stores in 6 states. Similarly, the Google Refine Application was used to obtain longitude and latitude coordinates. The location for these stores is shown in Fig 5.
Retail Store Demand
To estimate the demand for each retail store, the uszip3 function (Kay, Matlog Reference, 2014b) was used to get the 3-digit zip code centroid as well as its population. The demand for each state (U.S. Energy Information Administration 2014) was distributed to each retail store according to the population served by each of them.
Identify Warehouse Candidates
The intermodal network (Oak Ridge National Lab 2014) was used to identify the terminals connecting the railroad and truck networks. A map of this network is shown in Fig 6.
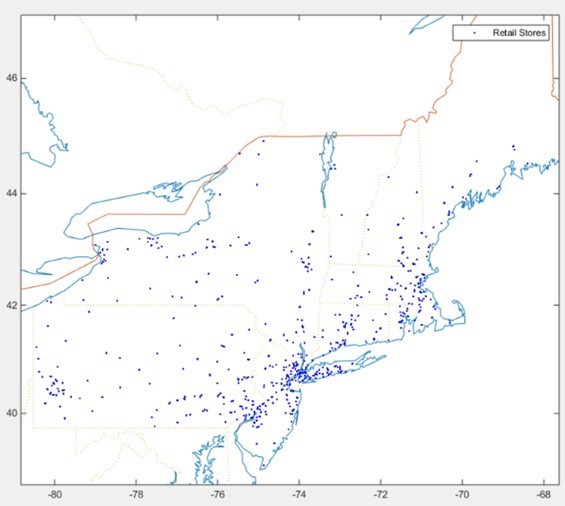
Fig. 5. Locations of the 608 retail stores used in this study (U.S. North East region)
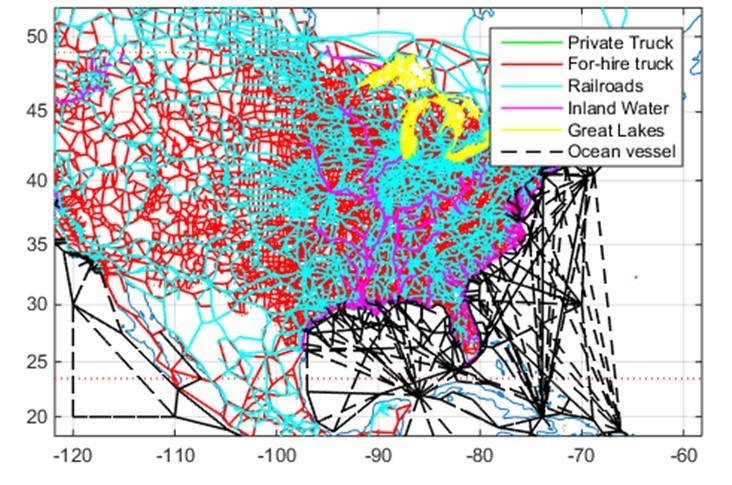
Fig. 6. Map of the intermodal network used in this study (North American region)
Each terminal is considered a potential warehouse candidate. This selection resulted in 587 warehouse candidates for the Northeast region. The locations of these terminals are shown in Fig. 7.
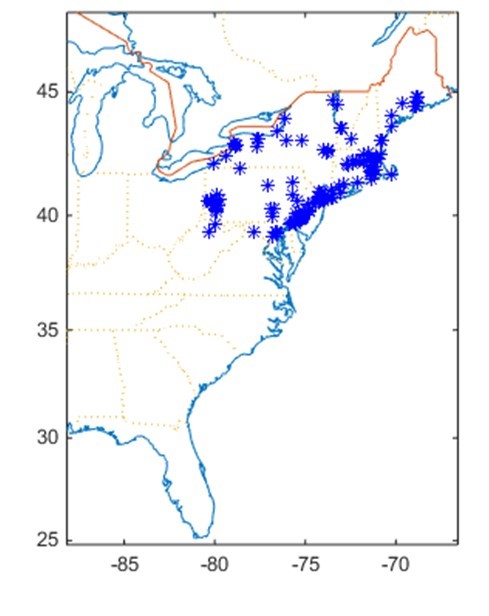
Fig. 7. Locations of the terminals and warehouse candidates (U.S. Eastern region)
Build Highway Network
The Oak Ridge National Highway Network contains approximately 500,000 miles of roadway in the U.S., Canada, and Mexico, including virtually all rural arterials and urban principal arterials in the U.S. Geographic accuracy is generally 100 m in the U.S., with geography mostly derived from USGS Digital Line Graphs and digitization. It includes a large attribute set relevant to routing (Oak Ridge National Laboratory 2014).
Some of the data used to build this network were taken from usrdlink and usrdnode (Kay 2014a) containing node ID, location (longitude and latitude), as well as link ID, length, one-way flag (indicating if the link allows traffic to flow in both ways), and A and B nodes (indicating connecting nodes). The railroad network was only developed for the regions relevant for this project, i.e., Northeast region (U.S. Census Bureau 2000). Figure 8 shows the geographical location of the links and nodes in the network.
Connector Roads were included in the network by using the addconnector function (Kay 2014a). Once the origin and destination points were included in the network, the shortest distance routes were identified by implementing the dijk function/dijkstra algorithm (Kay 2014b).
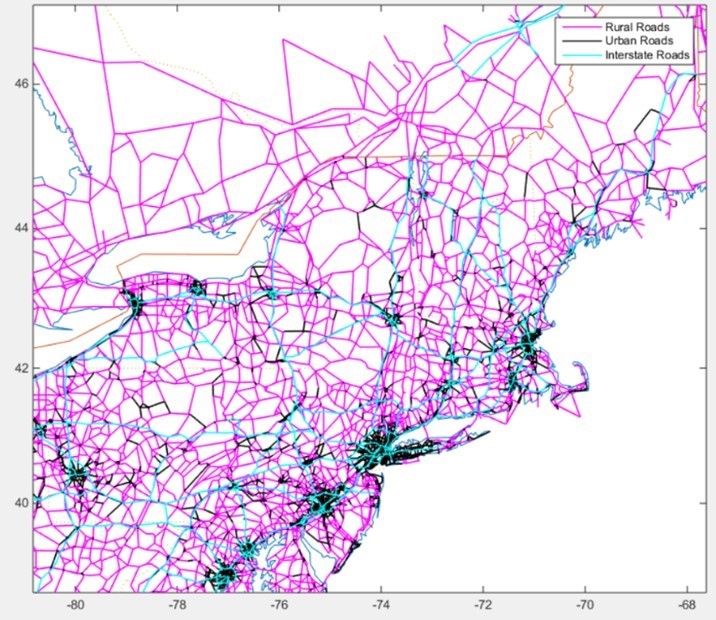
Fig. 8. Map of the highway network (U.S. North East region)
Warehouse Location
Given m EFs (existing facilities) and n sites at which NFs (new facilities) can be established, the uncapacitated facility location (UFL) problem was formulated by the mixed-integer linear programming (MILP) problem shown in Eq. 5,
![]() (5)
(5)
which is subject to,
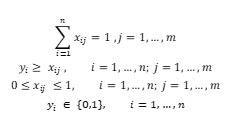
where ki is the fixed cost of establishing a NF at site i, Cij is the variable cost to serve all of EF j’s demand from site i, yi is 1 if NF is established at site i (otherwise yi is 0), and xij is the fraction of EF j’s demand served from NF at site i.
Transportation Problem
The railroad network was used again to connect and find the shortest routes from the pellet mills to the warehouses. Once the shortest routes were identified and the warehouse capacity was obtained by solving the UFL problem, the minimum-cost set of flows over all the links could be determined, such that warehouse demand is met and plant capacities are not exceeded. The trans function (Kay 2014b) was used to solve this problem.
Shipment Construction
The shipment was separated into two parts: the first shipments deliver wood pellets by train to the warehouses and the second part ships pellets by truck from the warehouses to the railroad network. The following additional formulas and definitions where included in the shipment truck array (Table 2).
Table 2. Variables in the Shipment Structural Array
Total Logistics Costs
The total annual logistics cost (TLC) for carload (CL) and truckload (TL) shipments is given by the sum of the transportation cost (TC) and the cycle inventory costs (IC) at the origin and destination. Equation 4 is used once again to calculate the carload and truckload logistics cost. Similar to the approach used by Ravindran and Warsing (2013) it was assumed that, in the interest of “maximum efficiency”, shipments were full carload or truckload capacities. As previously discussed, several scenarios were developed (Table 3).
Table 3. Model Description
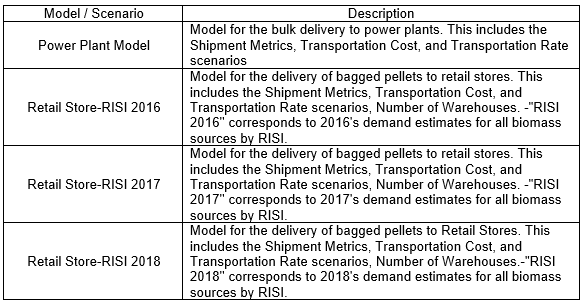
Model and Scenario Development
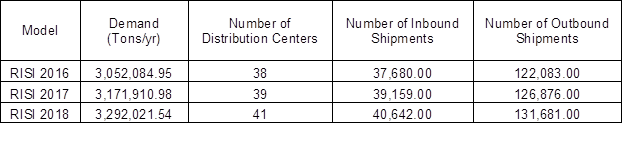
The Power Plant Model covers the 3,542,710 tons/year requirements to fulfill the energy consumption for power generation plants. RISI 2016, 2017, and 2018 represent the different projections described by RISI for the specified year, with an annual demand of 3,052,084.95, 3,171,910.98, and 3,292,021.54 tons, respectively. The scenarios generated for this study are the combination of transportation modes, rates, and demand requirements for the two main wood pellet markets.
Table 4 describes the transportation modes and rates used in each scenario.
Table 4. Transportation Rates Description
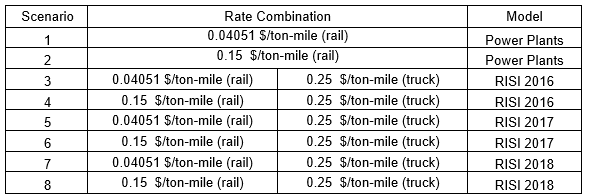
The two rail rates are from industry averages and wood pellet producer interviews. This transportation mode is for the delivery to power plants and the inbound shipments to warehouses. One trucking rate is reflected for the transportation from the warehouses to retail stores. Table 4 also shows the different scenarios according to the transportation and distribution model selected.
RESULTS AND DISCUSSION
Bulk Pellets for Power Plants
Figure 9 shows the pellet mills that supply the power plants located in the Northeast region and the lanes connecting the origin-destination pairs. There are 218 Origin-Destination (O-D) pairs in this model to deliver 3,542,710 tons out of the 8,307,569 tons of capacity per year, which translates into a 42.6 % utilization of the available production. The model selected the closest, regardless of size, plants and leaving the farthest plants such as the JCE Group AB (660,000 tons/year) plant out of the optimal solution model. Most of the production comes from closer plants such as Enviva’s Northampton and Southampton with a capacity of 551,155 tons each, serving 14 and 16 power plants, respectively.
Figure 10 shows the model cost results for Scenario 1 and Scenario 2, which correspond to transportation rates of 0.04051 and 0.15 $/ton-mile, respectively. The transportation and inventory costs are presented for each scenario.
The logistics cost difference between Scenarios 1 and 2 due to transportation rates is $322,387,824 per year. Scenario 1, which uses the average rail rate, represents 30.16% of the current wood pellet industry rate shown in Scenario 2.
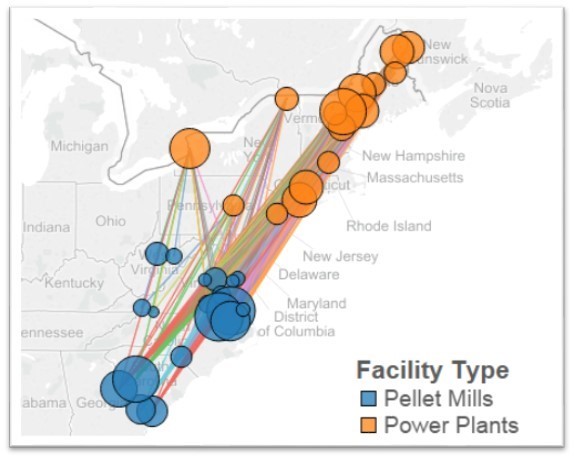
Fig. 9. Lanes that connect the pellet mills and the power plants
The difference in cost between the two scenarios per ton is presented in Fig. 11 as well as the production capacity for the pellet mills. The difference in the transportation rates translates into $91.00 per ton. Considering the production cost from the studies cited in the literature review ($184.8 per ton), the total cost for Scenarios 1 and 2 would be $224.08 and $315.08 per ton on average, respectively.
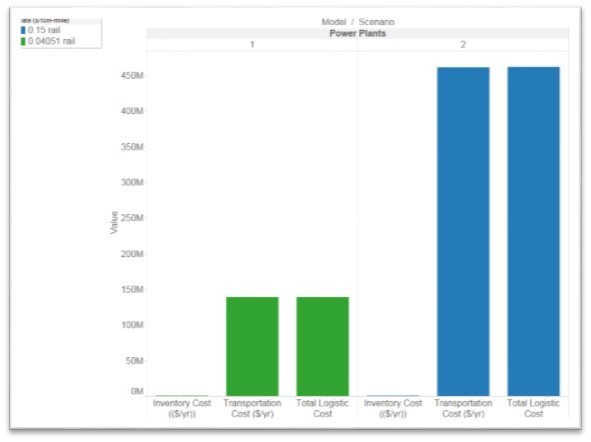
Fig. 10. Total logistics cost for Scenarios 1 and 2
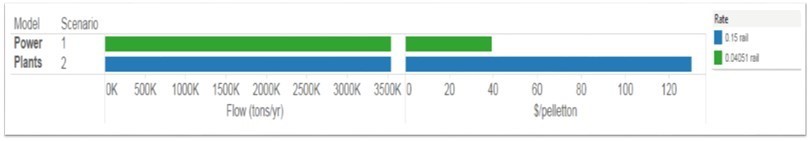
Fig. 11. Pellet mill capacity and cost per ton for Scenarios 1 and 2
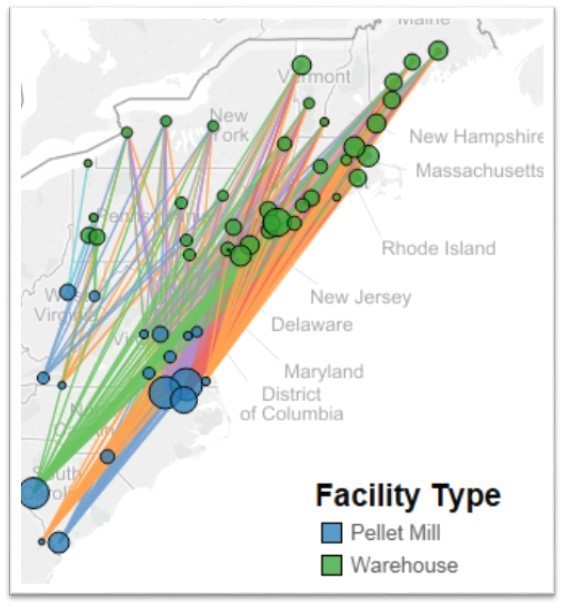
Fig. 12. Inbound shipment routes from the pellet mills to the distribution centers/warehouses
Bagged Pellets for Retail Stores
Figure 12 shows the inbound shipping lanes from the pellet mills to the distribution centers/warehouses. The RISI 2016, RISI 2017, and RISI 2018 models have 385, 398, and 456 shipping lanes, respectively, for the inbound shipments. Each distribution center adds a significant amount of shipping lanes to each model. The largest distribution centers are located in highly populated areas, with Hoboken, NJ, being one of the largest warehouses serving 30 retail stores and delivering 275,912 and 286,744 tons per year for the RISI 2016 and RISI 2017 models, respectively, while serving 27 stores with 280,967 tons per year.
Figure 13 shows the outbound shipments from the distribution centers/warehouses to the retail stores.
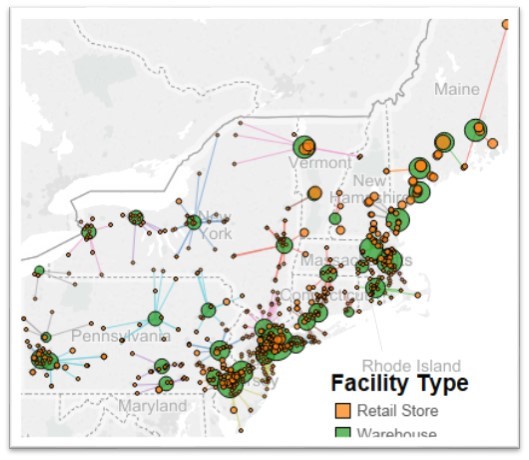
Fig. 13. Outbound shipment routes from the distribution centers/warehouses to the retail stores
The RISI models have 608 shipping lanes each. This is because of the UFL problem formulation for which each store can only be served by one distribution center. A capacitated facility location (CFL) could be used to solve the problem and give a more optimal result by allowing the stores to be served by several warehouses at a given time, but this would require a much longer computing time.
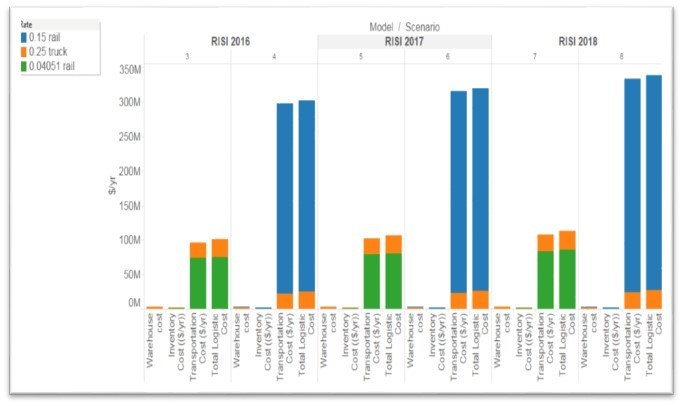
Fig. 14. Logistics cost (transportation and inventory costs) for Scenarios 2 though 8
Figure 14 presents the logistics cost for Scenarios 2 through 8. The costs are presented by transportation cost and inventory cost for each scenario. The logistics cost difference between Scenarios 3 and 4 due to the difference in transportation rates is $201,142,183 per year. The difference between Scenarios 5 and 6 is $213,743,465 per year, and the difference between Scenarios 7 and 8 is $226,235,598 per year.
Figure 15 shows the demand to be served by each of the retail stores. There is a projected demand increase every year until 2018.
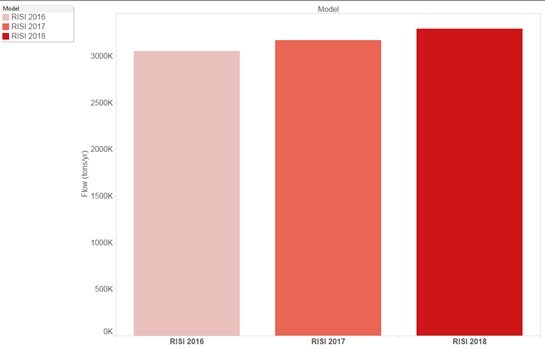
Fig. 15. Demand served by the retail stores
The projected demand for pellets in 2016 is 3,052,084 tons with an increase of 119,826 tons (4%) in 2017 and 239,941.94 (8%) in 2018. The increase in demand results in the incorporation of new distribution centers as shown in Table 5.
Table 5. Retail Store Shipment Metrics
The majority of the cost corresponds to the inbound shipments due to the distances traveled, even though the number of outbound shipments is much greater than that of the inbound shipments. The distribution center also adds a level of flexibility by making smaller shipments to the retail stores.
Figure 16 shows the power plants demand percentage by state. Considering the production cost from the studies cited in the literature review (184.8 $/ton), the average cost for Scenarios 3 through 8 was $217.99, $283.89, $218.49, $285.87, $218.99, and $287.71 per ton, respectively.
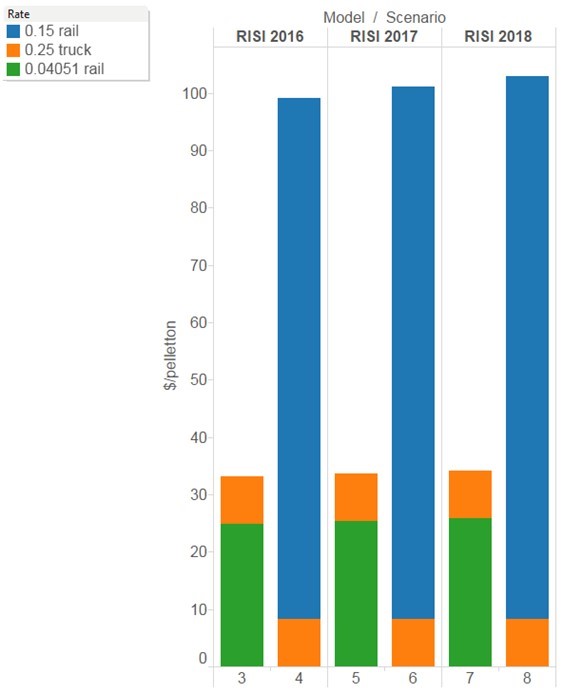
Fig. 16. Power Plants Demand Percentage by State
CONCLUSIONS
- Previous research and technical information from the wood pellet industry indicate that there is a growing market in the US for wood pellets in the form of bulk for power generation and in the form of bags for residential consumption.
- Pellet mills closer to the power plants deliver the minimum cost under the assumption of a fixed transportation cost regardless of the lane. In a real world case, larger plants might be able to negotiate a lower transport rate based on their volume, making it more attractive to select farther but larger pellet mills.
- The wood pellet industry should direct its efforts to negotiate a lower transport rate, which could represent a 70% reduction in cost. Even though the volume the wood pellet industry generates is small compared to larger industries, such as the coal and chemical industries, the significant cost difference indicates an opportunity to negotiate lower rates.
- Minimum margin studies were performed for each shipping lane in order to understand if the total cost (the combined production and logistic costs) is profitable for the market’s selling price at the destination.
- The models developed are a tool to determine the minimum cost of distributing wood pellets to the northeast region. A specific analysis must be performed for each shipping lane to understand the financial margins that are attractive for the business for a specific market or location.
- The largest distribution centers are located in highly populated areas, which are typically closer to the pellet mills in the south region. Power plants tend to be located further north, which therefore incurs higher transportations costs.
- The fact that there are many distribution centers also adds a level of flexibility by allowing for smaller shipments to the retail stores.
- A capacitated facility location (CFL) can be used to solve the problem and give a more optimal result. It allows the stores to be served simultaneously by several warehouses, but it will require a much longer computing time.
REFERENCES CITED
Association of American Railroads (AAR). (2014). Class I Railroad Statistics, (https://www.aar.org/Documents/Railroad-Statistics.pdf).
Bergman, R., and Zerbe, J. (2008). Primer on Wood Biomass for Energy, U. S. Department of Agriculture Forest Products Laboratory, Madison, WI.
Biomass Magazine (2014a). “Biomass plants,” (http://biomassmagazine.com/plants/listplants/biomass/US/), Accessed July 15, 2014.
Biomass Magazine (2014b). “Pellet plants,” (http://biomassmagazine.com/plants/listplants/pellet/US/), Accessed July 15, 2014.
Canadian National. (2014). “Equipment,” (https://www.cn.ca/en/our-business/transportation-services/rail/equipment), Accessed on July 2014.
Chugh, S., Yu, T. E., Jackson, S. W., Larson, J. A., English, B. C., and Cho, S. (2016). “Economic analysis of alternative logistics systems for Tennessee produced switchgrass to penetrate energy markets,” Biomass and Bioenergy 85, 25-34.
Ekstrom, H. (2014). “Global timber and wood products market update – A news brief from Wood Resources International LLC,” (http://mb.cision.com/Main/1902/9774748/380020.pdf), Accessed January 2015.
Enviva (2011). “Port operations,” (http://www.envivabiomass.com/manufacturing-operations/port-operations/), Accessed on November 2013.
European Biomass Industry Association (EBIA) (2007). “Densification-related advantages,” (http://www.eubia.Org/lll.0.html), Accessed on February 2009.
Flach, B., Bendz, K., Krautgartner, R., and Lieberz, S. (2013). EU Biofuels Annual 2013. Global Agricultural Information Network. NL3034.
Floden, J., and Williamsson, J. (2015). “Business models for sustainable biofuel transport: the potential for intermodal transport,” Journal of Cleaner Production 113, 426-437.
Georgia Forestry Commission. (2014). “Biomass energy,” (http://www.gfc.state.ga.us/utilization/forest. biomass/research/BiomassEnergyConversions.pdf), Accessed August 2014.
Goh, C. S., Junginger, M., Cocchi, M., Marchal, D., Thrän, D., Hennig, C., and Hess, R. (2013). “Wood pellet market and trade: a global perspective,” Biofuels, Bioproducts and Biorefining 7(1), 24-42.
Gonzalez, R., Phillips, R., Jameel, H., Abt, R., Pirraglia, A., Saloni, D., and Wright, J. (2011). “Biomass to energy in the southern United States: Supply chain and delivered cost,” BioResources 6(3), 2954-2976. DOI: 10.15376/biores.6.3.2954-2976
Hakkila, P. (1989). Utilization of Residual Forest Biomass, Springer, New York, USA.
Hamelinck, C. N., Suurs, R. A., and Faaij, A. P. (2005). “International bioenergy transport costs and energy balance,” Biomass and Bioenergy, 29(2), 114-134. DOI: 10.1016/j.biombioe.2005.04.002
Hassler, C. C. (1990). “Evaluating a wood densification system for producing fuelwood logs,” Forest Products Journal 40(11), 10.
Hess, J. R., and Jacobson, J. J. (2009). Sustainable International Bioenergy Trade: Securing Supply and Demand; Country Report-United States, International Energy Agency (IEA).
Hess, J., Lamers, P., Roni, M., Jacobson, J., and Heath, B. (2014). United States Country Report – IEA Energy Task 40. Idaho National Laboratory, Idaho Falls, ID, USA.
Home Depot. (2014). “Store directory,” (http://www.homedepot.com/StoreFinder/storeDirectory), Accessed May 2014.
Hoque, M., Sokhansanj, S., Bi, T., Mani, S., Jafari, L., Lim, J., and Afzal, M. (2006). “Economics of pellet production for export market,” in: CSBE/SCGAB 2006 Annual Conference, Edmonton, Canada.
Junginger, M., Bolkesjo, T., Bradley, D., Dolzan, P., Faaij, A., Heinimo, J., Hektor, B., Leistad, O., Ling, E., Perry, M. et al. (2008). “Developments in international bioenergy trade,” Biomass and Bioenergy 32(8), 717-729. DOI: 10.1016/j.biombioe.2008.01.019
Karlhager, J. (2008). The Swedish Market for Wood Briquettes – Production and Market Development, Ph.D. Dissertation, Swedish University of Agricultural Sciences, Uppsala, Sweden.
Kay, M. (2014a). “Lectures and course notes for ISE 754 Logistics Engineering,” E. P. Fitts Department of Industrial and Systems Engineering. N.C. State University, Raleigh, NC.
Kay, M. (2014b). “Matlog reference,” (http://www.ise.ncsu.edu/kay/matlog/MatlogRef.htm), Accessed January, 2014.
Lacoa, U., Saloni, D., and Blanco, E. (2014). “U.S. pellet market & logistic model,” in: PFI 2014 Annual Conference, Orlando, FL, U.S.
Lacoa, U., Velarde, G., and Saloni, D. (2014). “U.S. biomass opportunities for value-added biomass exports based on the European Union renewable energy share targets,” BioResources 9(4), 7606-7621. DOI: 10.15376/biores.9.4.7606-7621
Lowe, M. (2009). “Wood pellets among the cleanest-burning and most renewable sources of energy available,” (http://www.woodpellets.com/news/relevant-articles/Wood-pellets-among-cleanest.pdf), Accessed November 2014.
Lowes (2014). “Store locator,” (http://www.lowes.com/LowesStoreSearchCmd), Accessed on May, 2014.
Magelli, F., Boucher, K. B., Melin, S., and Bonoli, A. (2009). “An environmental impact assessment of exported wood pellets from Canada to Europe,” Biomass and Bioenergy 33(3), 434-441. DOI: 10.1016/j.biombioe.2008.08.016
Mani, S. (2006). “Simulation of biomass densification,” in: International Bioenergy Conference and Exhibition, Prince George, BC, Canada.
Master Loggers. (2014). “Lumber Jack brand,” (http://www.glrepellets.com/Products.html), Accessed on November, 2014
Norris, K. (2011). “Logistic support vital for US wood pellets exports to Europe,” RISI, (http://www.risiinfo.com/techchannels/transportation/Logistics-support-vital-for-US-woodpellets-exports-to-Europe. html.), Accessed August 2014.
Oak Ridge National Laboratory (2014). “Intermodal transportation network,” (http://cta.ornl.gov/transnet/Intermodal_Network.html), Accessed July 2014
Oak Ridge National Laboratory (2003). “Description of the CTA railroad network,” (http://cta.ornl.gov/transnet/rrdescr.txt), Accessed January 2014.
Oak Ridge National Laboratory (2014). “Highway network,” (http://cta.ornl.gov/transnet/Highways.html), Accessed on March 2014.
Obernberger, I., and Thek, G. (2010). The Pellet Handbook: The Production and Thermal Utilisation of Biomass Pellets. Routledge, Abington, UK.
Peksa-Blanchard, M., Dolzan, P., Grassi, A., Heinimo, J., Junginger, M., Ranta, T., and Walter, A. (2007). Global Wood Pellets Markets and Industry: Policy Drivers, Market Status and Raw Material Potential, (http://w.bioenergytrade.org/downloads/ieatask40pelletandrawmaterialstudynov2007final.pdf).
Pirraglia, A., Gonzalez, R., and Saloni, D. (2010a). “Techno-economical analysis of wood pellets production for U.S. manufacturers,” BioResources 5(4), 2374-2390. DOI: 10.15376/biores.5.4.2374-2390
Pirraglia, Adrian, Gonzalez, R., Saloni, D., and J, W. (2010b). “Wood pellets: An expanding market opportunity,” Biomass Magazine 6, 68-75.
RISI (2015). Global Pellet Demand Outlook: Special Market Analysis Study, RISI Reports, Atlanta, GA.
Ryu, C., Yang, Y. B., Khor, A., Yates, N. E., Sharifi, V. N., and Swithenbank, J. (2006). “Effect of fuel properties on biomass combustion: Part I. Experiments – Fuel type, equivalence ratio and particle size,” Fuel 85, 1039-1046. DOI: 10.1016/j.fuel.2005.09.019
Qian, Y., and McDow, W. (2013). “The wood pellet value chain: An economic analysis of the wood pellet supply chain from the Southeast United States to European Consumers,” US Endowment for Forestry and Communities, Greenville, SC.
Railroad Network (2011). “Rail road operations and procedures,” (http://cta.ornl.gov/transnet/RailRoads.html), Accessed May 2014.
Ravindran, R., and Warsing, D. (2013). Supply Chain Engineering, CRC Press, Boca Raton, FL.
Savolainien, M. (2007). “Pellet production and use in Europe,” Presentation from VAPO Group, (http://www.vapo.fi/en).
Sikkema, R., Junginger, M., Pichler, W., Hayes, S., and Faaij, A. P. (2010). “The international logistics of wood pellets for heating and power production in Europe,” Biofuels Bioproducts & Biorefining 4(2), 132-153. DOI: 10.1002/bbb.208
Sipila, J. (2014, July 29). AgCom. (U. Lacoa, Interviewer)
Spelter, H., and Toth, D. (2009). North America’s Wood Pellet Sector (Research Paper FPL-RP-656), U.S. Department of Agriculture Forest Products Laboratory, Madison, WI (http://www.fpl.fs.fed.us/documnts/fplrp/fpl_rp656.pdf).
Suurs, R. (2002). Long Distance Bioenergy Logistics, University of Utrecht, Copernicus Institute, Department of Science Technology and Society.
Świgoń, J., and Longauer, J. (2005). “Energy consumption in wood pellets production,” Folia Forestalia Polonica, 36, 77-83.
The U. S. Endowment for Forestry (2014). “Becoming a primary product,” (http://www.usendowment.org/images/Issues_in_the_Forest_Wood_Pellets.pdf), Accessed November 2014.
- S. Census Bureau (2000). “Census regions and divisions of the United States,” (https://www.census.gov/geo/maps-data/maps/pdfs/reference/us_regdiv.pdf), Accessed September 2014.
- S. Energy Information Administration. (2014). “State energy data system (SEDS): 1960-2012,” (http://www.eia.gov/state/seds/seds-data-complete.cfm?sid=US#Consumption), Accessed July 2014.
Urbanowski, E. (2005). Strategic Analysis of a Pellet Fuel Opportunity in Northwest British Columbia, Ph.D. Dissertation, Faculty of Business Administration, Simon Fraser University, British Columbia, Canada.
Walker, S. (2013). “Domestic pellet market,” in: Pellet Fuel Institute 2013 Annual Conference, Asheville, NC.
Washington State University (2012). Developing a Wood Pellet/Densified Biomass Industry in Washington State, (http://app.leg.wa.gov/ReportsToTheLegislature/Home/GetPDF?fileName=DensifiedBiomassReport-Dec28_df5eb5db-89f2-452b-a8a1-f64d16f05818.pdf).
Article submitted: May 18, 2016; Peer review completed: June 29, 2016; Revised version received and accepted: January 3, 2017; Published: January 13, 2017.
DOI: 10.15376/biores.12.1.1506-1531