
Abstract
Sweet sorghum bagasse (SSB) is potential feedstock for bioethanol production due to its natural abundance and high cellulose content (> 40%). This work compared the impact of three variables relative to the enzymatic hydrolysis of SSB kraft pulp. The three variables were the biosurfactant from lignin derivative known as amphiphilic lignin derivatives (A-LD), the enzyme loading level, and the hydrolysis time. These variables were optimized by response surface methodology (RSM) with a Box-Behnken design (BBD). The concentration of polyethylene glycol (PEG) 4000 was also optimized to compare it with the A-LD performance in the enzymatic hydrolysis process. After optimization, the A-LD produced a higher reducing sugar yield (RSY) (99.45%) than the PEG 4000. The difference in the predicted versus experimental values of the RSY was less than 4%, which means that the model was highly predictive. The adequacy of the model was confirmed by a regression value close to 1 for the A-LD assisted test. The result implies that the A-LD significantly improved the enzymatic hydrolysis performance to enhance the RSY. Moreover, the BBD is adequate and useful to identify the optimum concentration of surfactant.
Download PDF
Full Article
Design and Performance of Amphiphilic Lignin Derivatives in Enzymatic Hydrolysis of Sweet Sorghum Bagasse for Bioethanol Production
Nissa Nurfajrin Solihat,a,* Rika Raniya,b Triyani Fajriutami,a Apri Heri Iswanto,c Widya Fatriasari,a,* and Ahmad Fudholi d,e,*
Sweet sorghum bagasse (SSB) is potential feedstock for bioethanol production due to its natural abundance and high cellulose content (> 40%). This work compared the impact of three variables relative to the enzymatic hydrolysis of SSB kraft pulp. The three variables were the biosurfactant from lignin derivative known as amphiphilic lignin derivatives (A-LD), the enzyme loading level, and the hydrolysis time. These variables were optimized by response surface methodology (RSM) with a Box-Behnken design (BBD). The concentration of polyethylene glycol (PEG) 4000 was also optimized to compare it with the A-LD performance in the enzymatic hydrolysis process. After optimization, the A-LD produced a higher reducing sugar yield (RSY) (99.45%) than the PEG 4000. The difference in the predicted versus experimental values of the RSY was less than 4%, which means that the model was highly predictive. The adequacy of the model was confirmed by a regression value close to 1 for the A-LD assisted test. The result implies that the A-LD significantly improved the enzymatic hydrolysis performance to enhance the RSY. Moreover, the BBD is adequate and useful to identify the optimum concentration of surfactant.
Keywords: Amphiphilic lignin derivatives (A-LD); Box-Behnken design; Enzymatic hydrolysis; Sweet sorghum bagasse (SSB)
Contact information: a: Research Center for Biomaterials, Indonesian Institute of Sciences (LIPI), Cibinong 16911, Indonesia; b: Department of Environment Health, Faculty of Public Health, University of Indonesia, Depok, Indonesia; c: Department of Forest Product, Faculty of Forestry, Universitas Sumatera Utara, Kampus USU, Padang Bulan, Medan, Sumatera Utara; d: Solar Energy Research Institute, Universiti Kebangsaan Malaysia, 4600, Bangi, Selangor, Malaysia, e: Research Center for Electrical Power and Mechatronics, Indonesian Institute of Sciences (LIPI), Bandung, Indonesia; *Corresponding authors: nissa.nurfajrin.solihat@lipi.go.id; widya.fatriasari@biomaterial.lipi.go.id; a.fudholi@gmail.com
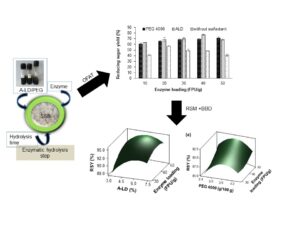
GRAPHICAL ABSTRACT
INTRODUCTION
Sorghum bicolor L. Moench, known as sweet sorghum bagasse (SSB), is abundantly present in Indonesia (Arif et al. 2019). The cellulose content of SSB is greater than 40%, which makes SSB a promising material to convert as bioethanol (Fatriasari et al. 2015). Therefore, many scientists have conducted research on the pretreatment of SSB using chemical (Jiang et al. 2019), physical, (Pramasari et al. 2017) and enzymatic applications (Yesuf and Liang 2014; Partida-Sedas et al. 2016). To enhance the reducing sugar, additives such as 2-[4-(2,4,4-trimethylpentan-2-yl)phenoxy]ethanol (Triton-X) (Eriksson et al. 2002), polyoxyethylene sorbitan monooleate (Tween) (Wang et al. 2018; Nababan et al. 2020), bovine serum albumin, Brij-35 (Rocha-Martín et al. 2017), and lignin derivative products resulting from the reaction of lignin with polyethylene glycol (Lin et al. 2015; Chen et al. 2016; Fatriasari et al. 2020a,b) were added during the enzymatic process. This is because the hydrophobic interaction of the surfactant with lignin improves the non-productive binding of enzyme with cellulose, as well as the non-specific hydrophobic interaction with the lignin in biomass as the substrate (Uraki et al. 2001). There was also a competition of hydrophobic interaction between protein and surfactant, which can reduce the possibility of unfruitful enzyme bonding. The mechanism of resolution involves the ability for the surfactant to prevent the occurrence of a reconnection between the enzyme and the lignin, subsequently increasing the chance of enzyme reusability by immobilization (Börjesson et al. 2007).
Lignin is one of major compounds in lignocellulosic material, after cellulose. In Indonesia, approximately 0.41 million tons per year of lignin is produced as a byproduct of unutilized black liquor in the pulp and paper industry (Fatriasari et al. 2020a). The presence of lignin can interfere with enzyme adsorption, so the optimal release of sugars content cannot be achieved during the hydrolysis process. However, lignin itself can be converted to valuable products, such as non-ionic surfactants (Agrawal et al. 2014). This conversion can also enhance the overall efficiency process in terms of biorefinery concepts such as in the pulp and paper industry and for bioethanol production. Hermiati et al. (2017) isolated lignin with one and two step isolation methods from Acacia mangium. The black liquor produced a maximum lignin yield of 45% and an acid-insoluble lignin (AIL) percentage of 53%. Fatriasari et al. (2018) reported the conversion of lignin to the non-ionic surfactant, amphiphilic lignin derivative (A-LD). The addition of A-LD in enzymatic hydrolysis has been found to successfully increase the reducing sugar yield (RSY) of SSB kraft pulp up to 81%. Another study on the optimization of A-LD synthesis conditions also confirmed the beneficial effects of the RSY (Fatriasari et al. 2020a). The lignin derivatives addition was effective to increase RSY on several pretreated biomass containing low lignin content (Fatriasari et al. 2020b). Lin et al. (2015) compared enzymatic hydrolysis of corn stover with assisted lignin-based polyoxyethylene ether (EHL-PEG) and PEG. It was found that EHL-PEG was more effective than the PEG in improving the enzymatic hydrolysis. The glucose yield increased from 16% to 70% with the addition of EHL-PEG due to minimizing the nonspecific adsorption of the enzyme on lignin.
One obstacle in the bioethanol conversion process is the uneconomical hydrolysis enzymatic step because of the non-optimal conditions. For instance, the accessibility of enzymes was hampered in the presence of lignin, inappropriate enzyme loading, and non-optimal hydrolysis time. Surfactant plays role on reduction of enzyme adsorption onto lignin which will improve enzymatic hydrolysis. Therefore, determining optimal values such as the surfactant concentration, the enzyme loading, and the hydrolysis time have been determined to be influencing factors for the enhancement of the RSY (Eckard et al. 2011; Meyabadi and Dadashian 2012; Singh and Bishnoi 2012).
In this study, A-LD was synthesized using a set of optimized conditions and steps that were established in the authors’ previous study (Fatriasari et al. 2020a). Subsequently, response surface methodology (RSM) with Box-Behnken design (BBD) was used to identify the contribution of the three-level variables on the RSY as a response. To date, there have been no published studies on the optimization of A-LD addition on enzymatic hydrolysis of pretreated biomass especially SSB by RSM with BBD as experimental design. Currently, BBD has been used by researchers to optimize the hydrolysis reaction time, the amount of enzyme, the sample loading, the hydrolysis temperature, and the surfactant concentration (Das et al. 2015; Delfín-Ruíz et al. 2019; Guarneros-Flores et al. 2019). The BBD is known to be more efficient than other response surface designs because it only contains low, central, and high factor combinations. In other words, this design avoids performing the experiment under extreme conditions (Ferreira et al. 2007). Therefore, the objective of this study was to acquire the optimum condition on the enzymatic hydrolysis process by the BBD. This may be the first study on optimizing the A-LD interaction with enzyme loading and hydrolysis time. The optimization of the PEG concentration was also conducted to compare the performance of A-LD with PEG.
EXPERIMENTAL
Materials
The Numbu variety SSB was collected from the BIOTROP plantation (Bogor, Indonesia). According to our previous study (Solihat et al. 2017), the SSB had an acid-insoluble lignin (AIL) content of 24.59 ± 0.21%, an acid-soluble lignin (ASL) content of 0.66 ± 0.00%, a holocellulose content of 79.28 ± 0.76%, an α-cellulose content of 43.66 ± 2.39%, and a hemicellulose content of 35.63 ± 1.63% where AIL and ASL was analyzed according to Adney and Baker method (2008), holocellulose by Wise method (1946), α-cellulose by Rowell method (2005), and hemicellulose by subtracting the holocellulose and α-cellulose. The A. mangium kraft black liquor was obtained from PT TELPP, (South Sumatera, Indonesia). Hydrochloric acid (HCl), sodium hydroxide (NaOH), and acetic acid were purchased from Merck (Darmstadt, Germany). The cellulase (Trichoderma reesei ATCC 26921) with an enzyme activity of 42.3 FPU/mL, the polyethylene glycol diglycidylethers (PEDGE) Mn 500, and the polyethylene glycol (PEG) 4000 were supplied by Sigma-Aldrich (St. Louis, MO, USA).
Methods
Preparation of the kraft pulp and A-LD
The details of the material preparation and pulping process of the SSB were explained in a previous study (Fatriasari et al. 2015). The SSB pulp was obtained from 250 g (dried weight) of SSB chips that were subjected to kraft pulping with 17% active alkali and 20% sulfidity for 2.5 h at 170 ℃. The two-step acid isolation procedure was used to isolate the lignin from the A. mangium black liquor, according to the method of Hermiati et al. (2017) with slight modification. One mol/L HCl was added to 100 g of black liquor with a pH of 12 until the pH reached 7, after which ethanol was added at a rate 4 times the volume of the HCl. The solution was kept at room temperature for 24 h. The ethanol was decanted, and the addition of HCl was continued until the solution reached a pH of 2. The solution was then filtered by technical filter paper. The lignin suspension was kept for 24 h, and the supernatant was decanted. The precipitated lignin was stored in a freezer at −18 °C for 24 h and filtered by a technical paper filter. The lignin powder was obtained after drying the precipitate at 45 °C for 24 h. The A-LD was synthesized according to the optimization condition by Fatriasari et al. (2020a). The lignin stock was prepared by dissolving 1 g of lignin in 50 mL NaOH (1 mol/L). Ten mL of lignin stock was added to 3 g of PEDGE Mn 500. Based on the previous study by Fatriasari et al. (2018), this molecular weight yielded a better RSY compared to when PEDGE with a higher Mn was used. The solution was heated at 60 °C for 1 h and the A-LD was formed after adding acetic acid until the pH reached 4 to stop the reaction.
Enzymatic hydrolysis and pretest experimental parameter
The enzymatic hydrolysis process was carried out in a WiseCube WIS-30R shaking incubator (witeg Labortechnik GmbH, Wertheim, Germany). 0.2 g of SSB pulp was placed in a 100 mL Erlenmeyer flask. Two hundred µL of 2% (w/v) sodium azide, 4 mL of enzyme, and sodium citric buffer of 0.05 mol/L (pH 4.8) were added until total weight of the solution was 20 g. The different concentrations of enzyme that were added are listed in Table 1. The surfactant was subsequently added in the flask. Each flask was incubated at 50 ℃ and 150 rpm, according to the conditions in the BBD (Table 1).
Variations of enzyme loading, surfactant concentrations, and hydrolysis time were conducted for screening experimental parameters by using the one-factor at one time (OFAT) design. The screening experimental parameter was the first step to investigate the variables that affect the RSY as a response. Firstly, to study the effect of enzyme loading on the RSY, 0.2 g of pulp was added to 5% of A-LD. The used concentration of A-LD in this study is based on the authors’ earlier findings (Fatriasari et al. 2018). The PEG 4000 2.5 g/100 g substrate was hydrolyzed using enzymes at concentrations of 10, 20, 30, 40, and 50 FPU/g. The incubation time was conducted for 72 h. The following boundary values were selected to evaluate the effect of the surfactant on the RSY: 0.2 g of pulp, 30 FPU/g of enzyme loading, 72 h of hydrolysis time, and 0.5 to 4.6 g/100 g of PEG 4000 as a substrate. Afterward, the effect of the hydrolysis time was conducted in variation times of 6 to 96 h with constant parameters: 0.2 g of pulp, 30 FPU/g of enzyme loading, 2.5 g/200 g of PEG substrate, and 5% of A-LD. Each test was measured in triplicate.
Reducing sugar analysis
The RSY in aliquot after the enzymatic hydrolysis process was analyzed via the dinitrosalicylic acid (DNS) method (Adney and Baker 2008). An ultraviolet (UV) Hitachi U-2001 spectrophotometer (Tokyo, Japan) at 540 nm wavelength was used to quantify the reducing sugar concentration (RSC). The RSY was determined by Eq. 1, and the total weight of the enzymatic hydrolysis was equal to 20 mL (Anita et al. 2020),
 (1)
(1)
where RSC is in g/L, 20 is the total weight of enzymatic hydrolysis solution (g), ODW is oven dry weight of kraft pulp (g), and PR is the recovery of the pulp (%).
BBD with RSM
After the screening test, the relationship between the RSY and three process variables was investigated using the BBD. The number of the experiments in the BBD was defined as N = 2K(K-1) + C0, where K and C0 represent the number of level factorials and the number of central points. In this study, three level-factorials (K) such as the concentration of the surfactant, the enzyme loading, and the hydrolysis time were involved to investigate the influencing parameters to enhance the RSY and three central points (C0) were applied (Table 1) (Ferreira et al. 2007). Therefore, 15 run experiments were required. Table 1 shows the ranges and levels for the three factors in this study where the codes −1, 0, and +1 represent the low, central point, and high values. To identify the optimum point, Eq. 2 presents the mathematical relationship between the RSY as a response and three-independent variables (Pasma et al. 2013),
 (2)
(2)
where Y is the predicted response; X1, X2, and X3 are independent variables; A1, A2, and A3 are linear coefficients; A12, A13, and A23 are two interaction coefficients; and A11, A22, and A33 are quadratic coefficients.
Table 1. Box-Behnken Coded of the Three Factor Levels and Range for Enzymatic Hydrolysis using PEG 4000 and A-LD

RESULTS AND DISCUSSION
Screening Parameter Results
The results from the OFAT experiment, such as the effect of the enzyme loading, the surfactant dosage, and the hydrolysis time on the RSY are shown in Fig. 1. The OFAT method reduced the number of trials run and determined each factor effect to fix the other factors (Fatriasari et al. 2018). The effects of the enzyme loading on the RSY at 10 to 50 FPU/g intervals with and without the assistance of PEG 4000 (2.5 g/100 g) and A-LD (5%) are described in Fig. 1a. As the enzyme loading increased, the RSY also increased. Once the enzyme loading addition rate reached more than 40 FPU/g, there was no impact on the final sugar yield. This may be because there was no more altering of the velocity of the reaction from the enzyme in the substrate (Mussatto et al. 2008). Hence, the addition of 40 FPU/g was selected as an optimum condition for further experiments. In general, the RSY from enzymatic hydrolysis with the addition of A-LD was slightly higher than it would be with the addition of PEG 4000 in every bar of enzyme loading. The result is similar to a previous study that added EHL-PEG during the enzymatic hydrolysis process, where the glucose yield was enhanced by approximately 18% after PEG was added. This was attributed to EHL-PEG having a larger influence on minimizing the non-productive binding of the enzyme on lignin (Lin et al. 2015).
As shown in Fig. 1a and 1b, the surfactants effectively increased the RSY. This finding is similar to previous work done by Fatriasari et al. (2018), where 5% of surfactant addition increased RSY to 81.33%. Surfactant improved the digestibility in the enzymatic hydrolysis of the pulp by preventing non-productive enzyme adsorption and eventually maintained high enzyme activity during the process (Fatriasari et al. 2018). The effect of the surfactant in elevating the RSY has been confirmed by previous studies. Sipos et al. (2011) explained that adding PEG increased 3% of the RSY due to reducing unproductive absorption, decreasing protein adsorption, and increasing enzyme activity during enzymatic hydrolysis. Li et al. (2016) revealed that the surfactant sorbitan (80) monooleate can adsorb the presence of lignin in biomass substrates, enhancing the accessibility of enzymes during the hydrolysis enzymatic process. Another study found that surfactant concentration like PEG was the most important variable for the enzymatic hydrolysis of corn stover to release a high glucose yield (Eckard et al. 2011). In confirmation with the results of previous studies, the RSY in this study gradually increased as the surfactant dosage increased. This may have been an effect of the hydrophobic interaction of the surfactant (Eriksson et al. 2002). However, the RSY did not substantially increase after 2.5 g/100 g of PEG was added. Therefore, the concentration of 2.5 g/100 g PEG 4000 was chosen as an optimum condition for further optimization. Figure 1c shows that the total amount of the RSY grew as the hydrolysis time increase, but after 72 h it decreased slightly. This may have been due to byproducts, such as hydroxymethyl furfural, from the dehydration of sugar (Daorattanachai et al. 2011). Thus, 72 h was decided as the optimum hydrolysis time for further investigation.

Fig. 1. The effect of (a) enzyme loading with and without the addition of PEG 4000 (2.5 g/ 100 g) and A-LD (5 %), (b) PEG 4000 concentration, and (c) hydrolysis time with surfactant-assisted at concentration 2.5 g/ 100 g PEG 4000 and 5 % A-LD on the RSY
Experimental Optimization Using BBD
A total run of the experiment details of the BBD is given in Table 2. The multiple regression analysis was calculated based on the RSY values in Table 2. The following equations represent a function of the predicted model for the RSY (%) from the enzymatic hydrolysis with the addition of the PEG 4000 (Eq. 3) and A-LD (Eq. 4) surfactants.
 (3)
(3)
 (4)
(4)
where Y is the RSY (%), X1 is the concentration of the surfactant (g/100 g for PEG 4000 in Eq. 3 and % for A-LD in Eq. 4), X2 is the enzyme loading (FPU/g), and X3 is the hydrolysis time (h). The analyses of statistical significance were carried out using F test for analysis of variance (ANOVA) using Minitab 17 software (USA). If the p value was below 0.05, the model was significant. If the p value was above 0.05, the model was insignificant.
Table 2. Box-Behnken Design with RSM for the RSY of the SSB Pulp after Enzymatic Hydrolysis with the Addition PEG 4000 and A-LD

RSY percentage is a factor to evaluate efficiency process of the BBD for the optimization of adding the A-LD and the PEG 4000 during enzymatic hydrolysis of SSB. A RSY between 75 and 97% was obtained from the following boundary parameters: PEG 4000 concentration of 2.5 to 4.5 g/100 g, A-LD concentration of 3 to 7%, enzyme loading between 30 and 50 FPU/g, and a hydrolysis time of 48 to 96 h (Table 2). Overall, the enzymatic hydrolysis with the addition of the A-LD released a higher RSY compared to the addition of the PEG.
The highest RSY (97.42%) was obtained under the following conditions: enzyme loading 40 FPU/g and hydrolysis time 72 h with A-LD 5% assisted. Moreover, an F-test and the determination of the regression coefficient (R2) value were used to check the capability model. The results of the ANOVA test for the A-LD and PEG 4000 design in Table 3 show that both regression models were highly significant with p < 0.05. The F-values of the PEG 4000 and the A-LD were 8.03 and 30.3, respectively. A higher F-value means that the model is more statistically significant. The R2 values for the PEG 4000 and A-LD were 0.7280 and 0.9100, respectively, which implies that both models are highly predictable because they can explain 72.8% and 91% variability in the response (Montgomery 2001). The R2 value is in line with the p values of each variable where the p-value shows that the linear coefficients (x1, x2, and x3) of the A-LD model were significant, and x2 and x3 of the PEG model were significant. In quadratic and two-way interactions coefficient, x12, x32, and x1x3 were significant for both surfactants. Overall, the p-values of the linear, quadratic, and two-way interactions of the variable that were used to explain the effect of three-level factors on the RSY were significant and suitable to predict the RSY according to the established parameters.
Table 3. ANOVA Model of the BBD for the Enzymatic Hydrolysis with the Addition of PEG 400 and A-LD

The surface graph of the two interaction factors was drawn to visualize the correlation of the two independent variables and the one constant variable on the RSY. Figure 2a shows that the enzyme loading had a positive effect on the RSY. The RSY increased as the enzyme loading increased, although PEG 4000 had a quadratic effect on RSY. The RSY gradually increased from the lowest PEG 4000 concentration (2.5 g/100 g) and decreased after adding PEG 4000 at more than 3.9 g/100 g. Similar results were seen in a previous study in which increasing the surfactant concentration caused the RSY to decrease due to reverse micelles formation in the surfactant, which decreased the enzyme activity during the process (Pandey and Negi 2015). The strong interaction effect was also seen from the interaction of the PEG concentration and the hydrolysis time (Fig. 2b). The surface graph shows that the combination of the PEG 4000 and the hydrolysis time at the lowest level had an RSY 84%, and it increased to 91% after 96 h of hydrolysis time and 3.6 g/100 g of PEG 4000 addition. The prolonged hydrolysis time elevated the RSY, while a PEG 4000 concentration higher than 3.6 g/100 g lowered the RSY. This may have been due to the rapid hydrolysis achieved at the middle surfactant concentration with long incubation time (Qi et al. 2009).
Low interaction was seen in the interaction of the enzyme loading and the hydrolysis time (Fig. 2c), such that the RSY was low at the low level of enzyme loading. At the lowest point of interaction, the RSY was less than 85% and it was elevated to 91% after the enzyme loading was increased to 50 FPU/g. In other words, the RSY did not significantly increase the enzyme loading increased unless the hydrolysis time was extended. This may be due to the increased enzyme activation to access the cellulosic substrate during the hydrolysis period (Jamaludin et al. 2013). According to the Multiple Response Prediction in the Minitab software, the maximum RSY (93.26%) was released under a PEG 4000 concentration of 4 g/100 g, an enzyme loading of 50 FPU/g, and a hydrolysis time of 92 h from this model.

Fig. 2. The response surface graphs of the RSY showing two interaction factors on the enzymatic hydrolysis process with the addition of PEG 4000: (a) PEG 4000 concentration and enzyme loading, (b) PEG 4000 concentration and hydrolysis time, (c) Enzyme loading and hydrolysis time
The quadratic interaction of the A-LD concentration and the enzyme loading on the RSY can be seen in Fig. 3a. The trend was similar to the one shown in Fig. 2a, where the lowest point resulted in a RSY of 88%. By increasing the A-LD concentration to 5% with the enzyme loading at 49 FPU/g, the lighter green color was observed in the surface graph. The light green color correlated to the highest RSY (91%) in the model. The color gradually darkened again after it reached the optimum condition. On the other hand, the A-LD had a linear interaction effect with the hydrolysis time (Fig. 3b). However, the RSY declined by when the hydrolysis time was more than 90 h. This may have been caused by inhibitor production during the process that was not able to be controlled by adding surfactant even at a high concentration (Qi and Volmer 2019). In this interaction, the lowest RSY of approximately 75% rapidly increased to 93% after the addition of A-LD 5% for 90 h of incubation time. Similar to Fig. 2c, weak interaction of enzyme loading and hydrolysis time was observed in Fig. 3c where the high RSY area in the model was achieved if the hydrolysis time increased. Of this model, the highest RSY (96.14%) was obtained after 89 h of hydrolysis time, 4% A-LD addition, and 50 FPU/g of enzyme loading based on the automatic calculation in the Minitab software. The maximum RSY of the A-LD assisted interaction was higher approximately 3% with a shorter hydrolysis time than with the PEG 4000 addition. This is in agreement with the screening single factor result in Fig. 1a.

Fig. 3. The response surface graphs for the enzymatic hydrolysis with the impact of A-LD on the RSY of two interactions: (a) A-LD concentration and enzyme loading, (b) A-LD concentration and hydrolysis time, (c) Enzyme loading and hydrolysis time
The optimum condition was identified through the Minitab software. The optimum RSY with the PEG 4000 was achieved under the following conditions: PEG 4000 concentration of 4 g/100 g, 50 FPU/g of enzyme loading, and a hydrolysis time of 92 h. The optimum RSY with the A-LD was achieved under the following conditions: An A-LD concentration of 4%, 50 FPU/g of enzyme loading, and a hydrolysis time of 89 h. Furthermore, the pulp was hydrolyzed by using the optimum condition to validate the model. The comparison of the fitting and experimenting RSY results after the optimization for both the A-LD and PEG 4000 addition is shown in Table 4. The data in Table 4 were measured in triplicate. There was a strong agreement between the fitted and experimental values, which was illustrated by a difference of less than 4% in the experimental and theoretical values, which implies adequacy of the used model (Anita et al. 2020). Both RSY values from the experimental results were above the predicted values. This result was similar to the pretreatment of SSB of wet and dry bases (Guarneros-Flores et al. 2019). In summary, the enzymatic hydrolysis assisted by the A-LD had a higher RSY with a shorter hydrolysis period (3 h) compared to that of the PEG 4000. Another study regarding the optimization of surfactant dosage on the RSY reported that a 95% RSY was obtained from wheat straw by alkaline peroxide pretreatment under the following conditions: 50 FPU/g of enzyme loading, 20 g/L of substrate concentration, 4 g/L of polysorbate (80) monooleate 80 concentration, and a hydrolysis time of 48 h. Through a surfactant optimization, extruded corn stover released a 98% glucose yield with 10.8 FPU/g of enzyme loading, 0.3 g of PEG, and 72 h of incubation time (Eckard et al. 2011). Compared to these previous studies, the RSY that was obtained in this study was slightly higher. Therefore, it can be inferred that surfactant-assisted optimization is substantial in the biomass hydrolysis process to elevate the RSY. This study also can be a complementary study to explore lignin derivatives as a surfactant for bioethanol production.
Table 4. The Predicted and Experimental RSY Values for the Enzymatic Hydrolysis After the Addition of PEG 4000 and A-LD at Optimum Conditions

CONCLUSIONS
- The response surface methodology (RSM) showed the surfactant affected the enzymatic hydrolysis of SSB kraft pulp to produce reducing sugar. The statistical analysis showed that both the enzyme loading, and the hydrolysis time significantly interacted with both surfactants, PEG 4000 and amphiphilic lignin derivative (A-LD).
- The interactions had a significant effect on the obtained reducing sugar yield (RSY) values. Based on the regression equation obtained by RSM, the difference in the fitting and experimenting RSY values was less than 4%, with insignificant lack of fit that revealed the model was adequate.
- After optimization, the presence of both PEG 4000 and A-LD as a surfactant successfully elevated the RSY values up to 94% and 99%, respectively. This implies that the surfactant had a crucial effect on elevating the RSY.
- The A-LD assisted interaction produced a higher RSY compared to the addition of PEG 4000. The highest RSY was achieved under the following conditions: An A-LD concentration of 4%, 50 FPU/g of enzyme loading, and a hydrolysis time of 89 h.
- It can be inferred that the proposed model of RSM with the BBD in this study is useful to determine the crucial factors on the enzymatic conversion process.
ACKNOWLEDGMENTS
This study was funded by the Research Center for Physic, Indonesian Institute of Sciences (LIPI) through competitive programs in Material, Energy Development, and Manufacturing Engineering FY 2017. The authors acknowledge the facilities, scientific and technical support form Advanced Characterization Laboratories Cibinong – Integrated Laboratory of Bioproduct, Indonesian Institute of Sciences through E- Layanan Sains Lembaga Ilmu Pengetahuan Indonesia.
REFERENCES CITED
Adney, B., and Baker, J. (2008). Measurement of Cellulase Activities Laboratory Analytical Procedure (LAP) (Technical Report NREL/TP-510-42628), National Renewable Energy Laboratory, Golden, CO.
Agrawal, A., Kaushik, N., and Biswas, S. (2014). “Derivatives and applications of lignin – An insight,” The Scitech Journal 1(7), 30-36.
Anita, S. H., Fitria, Solihat, N. N., Sari, F. P., Risanto, L., Fatriasari, W., and Hermiati, E. (2020). “Optimization of microwave-assisted oxalic acid pretreatment of oil palm empty fruit bunch for production of fermentable sugars,” Waste and Biomass Valorization 11, 2673-2687. DOI: 10.1007/s12649-018-00566-w
Arif, A. B., Budiyanto, A., Diyono, W., Hayuningtyas, M., Marwati, T., Sasmitaloka, K. S., and Richana, N. (2019). “Bioethanol production from sweet sorghum bagasse through enzymatic process,” in: IOP Conference Series: Earth and Environmental Science 309, 012033-012039. DOI: 10.1088/1755-1315/309/1/012033
Börjesson, J., Peterson, R., and Tjerneld, F. (2007). “Enhanced enzymatic conversion of softwood lignocellulose by poly(ethylene glycol) addition,” Enzyme and Microbial Technology 40(4), 754-762. DOI: 10.1016/j.enzmictec.2006.06.006
Chen, C., Zhu, M., Li, M., Fan, Y., and Sun, R.-C. (2016). “Epoxidation and etherification of alkaline lignin to prepare water-soluble derivatives and its performance in improvement of enzymatic hydrolysis efficiency,” Biotechnology for Biofuels 9, 87. DOI: 10.1186/s13068-016-0499-9
Daorattanachai, P., Khemthong, P., Viriya-empikul, N., Laosiripojana, N., and Faungnawakij, K. (2011). “The effect of catalyst types and starting materials on furan production in hot compressed water,” Energy Procedia 9, 515-521. DOI: 10.1016/j.egypro.2011.09.059
Das, S., Bhattacharya, A., Haldar, S., Ganguly, A., Gu, S., Ting, Y. P., and Chatterjee, P. K. (2015). “Optimization of enzymatic saccharification of water hyacinth biomass for bio-ethanol: Comparison between artificial neural network and response surface methodology,” Sustainable Materials and Technologies 3, 17-28. DOI: 10.1016/j.susmat.2015.01.001
Delfín-Ruíz, M. E., Calderón-Santoyo, M., Ragazzo-Sánchez, J. A., Gómez-Rodríguez, J., López-Zamora, L., and Aguilar-Uscanga, M. G. (2019). “Acid pretreatment optimization for xylose production from Agave tequilana Weber var. azul, Agave americana var. oaxacensis, Agave karwinskii, and Agave potatorum bagasses using a Box-Behnken design,” Biomass Conversion and Biorefinery 10, 949-958. DOI: 10.1007/s13399-019-00497-z
Eckard, A. D., Muthukumarappan, K., and Gibbons, W. (2011). “Pretreatment of extruded corn stover with polyethylene glycol to enhance enzymatic hydrolysis: Optimization, kinetics, and mechanism of action,” BioEnergy Research 5(2), 424-438. DOI: 10.1007/s12155-011-9162-2
Eriksson, T., Börjesson, J., and Tjerneld, F. (2002). “Mechanism of surfactant effect in enzymatic hydrolysis of lignocellulose,” Enzyme and Microbial Technology 31(3), 353-364. DOI: 10.1016/S0141-0229(02)00134-5
Fatriasari, W., Supriyanto, S., and Iswanto, A. H. (2015). “The kraft pulp and paper properties of sweet sorghum bagasse (Sorghum bicolor L Moench),” Journal of Engineering Technological Sciences 47(2), 149-159. DOI: 10.5614/j.eng.technol.sci.2015.47.2.4
Fatriasari, W., Adi, D. T. N., Laksana, R. P. B., Fajriutami, T., Raniya, R., Ghozali, M., and Hermiati, E. (2018). “The effect of amphipilic lignin derivatives addition on enzymatic hydrolysis performance of kraft pulp from sorghum bagasse,” IOP Conference Series: Earth and Environmental Science 141, 012005. DOI: 10.1088/1755-1315/141/1/012005
Fatriasari, W., Raniya, R., Oktaviani, M., and Hermiati, E. (2018). “The improvement of sugar and bioethanol production of oil palm empty fruit bunches (Elaeis guineensis Jacq) through microwave-assisted maleic acid pretreatment,” BioResources 13(2), 4378-4403. DOI: 10.15376/biores.13.2.4378-4403
Fatriasari, W., Hamzah, F. N., Pratomo, B. I., Fajriutami, T., Ermawar, R. A., Falah, F., Laksana, R. P. B., Ghozali, M., Iswanto, A. H., Hermiati, E., et al. (2020a). “Optimizing the synthesis of lignin derivatives from Acacia mangium to improve the enzymatic hydrolysis of kraft pulp sorghum bagasse,” International Journal of Renewable Energy Development 9(2), 227-235. DOI: 10.14710/ijred.9.2.227-235
Fatriasari, W., Nurhamzah, F., Raniya, R., Laksana, R. P. B., Anita, S. H., Iswanto, A. H., and Hermiati, E. (2020b). “Enzymatic hydrolysis performance of biomass by addition of lignin based biosurfactant,” Journal of Korean Wood Science and Technology 48(5), 651-665. DOI: 10.5658/WOOD.2020.48.5.651
Ferreira, S. L. C., Bruns, R. E., Ferreira, H. S, Matos, G. D., David, J. M., Brandão, G. C., da Silva, E. G. P., Portugal, L. A,. dos Reis, P. S., Souza, A. S. et al. (2007). “Box-Behnken design: An alternative for the optimization of analytical methods,” Analytica Chima Acta 597(2), 179-186. DOI: 10.1016/j.aca.2007.07.011
Guarneros-Flores, J., Aguilar-Uscanga, M. G., Morales-Martínez, J. L., and López-Zamora, L. (2019). “Maximization of fermentable sugar production from sweet sorghum bagasse (dry and wet bases) using response surface methodology (RSM),” Biomass Conversion and Biorefinery 9(3), 633-639. DOI:10.1007/s13399-018-00366-1
Hermiati, E., Risanto, L., Lubis, M. A. R., Laksana, R. P. B., and Dewi, A. R. (2017). “Chemical characterization of lignin from kraft pulping black liquor of Acacia mangium,” AIP Conference Proceedings 1803(1). DOI:10.1063/1.4973132
Jamaludin, S. I. S., Kadir, S. A. S. A., Krishnan, J., and Safri, N. H. M. (2013). “Optimization of enzymatic hydrolysis of kitchen using RSM,” in: IEEE Business Engineering and Industrial Applications Colloquium (BEIAC), Langkawi, Malaysia, pp. 322-326.
Jiang, T.-T., Liang, Y., Zhou, X., Shi, Z.-W., and Xin, Z.-J. (2019). “Optimization of a pretreatment and hydrolysis process for the efficient recovery of recycled sugars and unknown compounds from agricultural sweet sorghum bagasse stem pith solid waste,” PeerJ 6, e6186. DOI: 10.7717/peerj.6186
Li, Y., Sun, Z., Ge, X., and Zhang, J. (2016). “Effects of lignin and surfactant on adsorption and hydrolysis of cellulases on cellulose,” Biotechnology for Biofuels 9, 20. DOI: 10.1186/s13068-016-0434-0
Lin, X., Qiu, X., Yuan, L., Li, Z., Lou, H., Zhou, M., and Yang, D. (2015). “Lignin-based polyoxyethylene ether enhanced enzymatic hydrolysis of lignocelluloses by dispersing cellulase aggregates,” Bioresource Technology 185, 165-170. DOI: 10.1016/j.biortech.2015.02.067
Meyabadi, T. F., and Dadashian, F. (2012). “Optimization of enzymatic hydrolysis of waste cotton fibers for nanoparticles production using response surface methodology,” Fibers and Polymers 13(3), 313-321. DOI: 10.1007/s12221-012-0313-7
Montgomery, D.C. (2001). Design and Analysis of Experiments, John Wiley & Sons, New York, NY, USA.
Mussatto, S. I., Dragone, G., Fernandes, M., Milagres, A. M. F., and Roberto, I. C. (2008). “The effect of agitation speed, enzyme loading and substrate concentration on enzymatic hydrolysis of cellulose from brewer’s spent grain,” Cellulose 15(5), 711-721. DOI: 10.1007/s10570-008-9215-7
Nababan, Y.S., Fatriasari, W., and Wistara, N. (2020). “Response surface methodology for enzymatic hydrolysis optimization of jabon alkaline pulp with Tween 80 surfactant addition,” Biomass Conversion Biorefinery. DOI: 10. 1007/s13399-020- 00807-w
Pandey, A. K., and Negi, S. (2015). “Impact of surfactant assisted acid and alkali pretreatment on lignocellulosic structure of pine foliage and optimization of its saccharification parameters using response surface methodology,” Bioresource Technology 192, 115-125. DOI: 10.1016/j.biortech.2015.04.054
Partida-Sedas, G., Montes-García, N., Carvajal-Zarrabal, O., López-Zamora, L., Gómez-Rodríguez, J., and Aguilar-Uscanga, M. G. (2016). “Optimization of hydrolysis process to obtain fermentable sugars from sweet sorghum bagasse using a Box-Behnken design,” Sugar Tech 19(3), 317-325. DOI: 10.1007/s12355-016-0461-y
Pasma, S. A., Daik, R., Maskat, M. Y., and Hassan, O. (2013). “Application of Box-Behnken design in optimization of glucose production from oil palm empty fruit bunch cellulose,” International Journal of Polymer Science 2013, 1-8. DOI: 10.1155/2013/104502
Pramasari, D. A., Haditjaroko, L., Sunarti, T. C., Hermiati, E., and Syamsu, K. (2017). “The effectiveness of physical and alkali hydrothermal pretreatment in improving enzyme susceptibility of sweet sorghum bagasse,” Jurnal Bahan Alam Terbarukan 6(2), 117-131. DOI: 10.15294/jbat.v6i2.9910
Qi, B., Chen, X., Shen, F., Su, Y., and Wan, Y. (2009). “Optimization of enzymatic hydrolysis of wheat straw pretreated by alkaline peroxide using response surface methodology,” Industrial & Engineering Chemistry Research 48(15), 7346-7353. DOI: 10.1021/ie8016863
Qi, Y., and Volmer, D. A. (2019). “Chemical diversity of lignin degradation products revealed by matrix-optimized MALDI mass spectrometry,” Analytical and Bioanalytical Chemistry 411(23), 6031-6037. DOI: 10.1007/s00216-019-01984-y
Rocha-Martín, J., Martinez-Bernal, C., Pérez-Cobas, Y., Reyes-Sosa, F. M., and García, B. D. (2017). “Additives enhancing enzymatic hydrolysis of lignocellulosic biomass,” Bioresource Technology 244(1), 48-56. DOI: 10.1016/j.biortech.2017.06.132
Rowell, R. M. (2005). “Cell Wall Chemistry,” in: Handbook Wood Chemistry and Wood Composites 1st ed., CRC Press, Florida, pp. 71-72.
Singh, A., and Bishnoi, N. R. (2012). “Optimization of enzymatic hydrolysis of pretreated rice straw and ethanol production,” Applied Microbiology and Biotechnology 93(4), 1785-1793. DOI: 10.1007/s00253-012-3870-1
Sipos, B., Szilágyi, M., Sebestyén, Z., Perazzini, R., Dienes, D., Jakab, E., Crestini, C., and Réczey, K. (2011). “Mechanism of the positive effect of poly(ethylene glycol) addition in enzymatic hydrolysis of steam pretreated lignocelluloses,” Comptes Rendus Biologies 334(11), 812-823. DOI: 10.1016/j.crvi.2011.06.005
Solihat, N. N., Fajriutami, T., Adi, D. T. N., Fatriasari, W., and Hermiati, E. (2017). “Reducing sugar production of sweet sorghum bagasse kraft pulp,” AIP Conference Proceedings 1803, 020012-1-020012-8. DOI: 10.1063/1.4973139
Uraki, Y., Ishikawa, N., Nishida, M., and Sano, Y. (2001). “Preparation of amphipilic lignin derivative as a cellulase stabilizer,” Journal of Wood Science 47, 301-307. DOI: 10.1007/BF00766717
Wang, W., Zhuang, X., Tan, X., Wang, Q., Chen, X., Yu, Q., Qi, W., Wang, Z., and Yuan, Z. (2018). “Dual effect of nonionic surfactants on improving the enzymatic hydrolysis of lignocellulose,” Energy Fuels 32(5), 5951-5959. DOI: 10.1021/acs.energyfuels.8b00225
Wise, L. E., Murphy, M. and Addieco, A. A. (1946). “Chlorite holocellulose, its fractionnation and bearing on summative wood analysis and on studies on the hemicelluloses,” Pap. Trade J. 122(2), 35–43.
Yesuf, J. N., and Liang, Y. (2014). “Optimization of sugar release from sweet sorghum bagasse following solvation of cellulose and enzymatic hydrolysis using response surface methodology,” Biotechnology Progress 30(2), 367-375. DOI: 10.1002/btpr.1851
Article submitted: April 26, 2021; Peer-review completed: June 13, 2021; Revised version received and accepted: June 25, 2021; Published: July 9, 2021.
DOI: 10.15376/biores.16.3.5875-5889