
Abstract
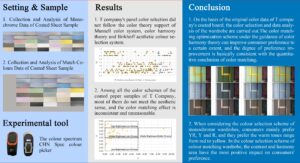
To solve the problem of pure perceptual and non-standardized selection of colour in furniture, a rational and reliable colour quantitative system was developed. This approach is beneficial to the upgrading and optimization of products by furniture manufacturing enterprises. The wardrobe colour selection system is based on the Munsell colour system, the colour harmony theory and the Birkhoff aesthetic colour selection system to construct a wardrobe colour selection system. It has three analytical parts, consisting of wardrobe colour selection and data analysis, which can provide a reference for the colour quantification used by furniture enterprises. Once the system was constructed, a company’s wardrobe colour selection and coated sheet sample was used as an example to test its efficacy. The wardrobe colour selection system was evaluated to optimize the design of the company’s original wardrobe product colour selection. The results showed that the wardrobe colour selection system improved consumers’ preference for the company’s wardrobe colour selection. The wardrobe colour selection system provides a reference for furniture companies, engineers and designers in product colour selection and optimization design, which is conducive to scientifically informed manufacture and a standard formulation of furniture colour.
Download PDF
Full Article
Development of a Selection System for the Colour of Wardrobe Furniture
Chengmin Zhou,a,b,* Zhenyu Li,a,b Jake Kaner,c and Chaoxia Leng a,b
To solve the problem of pure perceptual and non-standardized selection of colour in furniture, a rational and reliable colour quantitative system was developed. This approach is beneficial to the upgrading and optimization of products by furniture manufacturing enterprises. The wardrobe colour selection system is based on the Munsell colour system, the colour harmony theory and the Birkhoff aesthetic colour selection system to construct a wardrobe colour selection system. It has three analytical parts, consisting of wardrobe colour selection and data analysis, which can provide a reference for the colour quantification used by furniture enterprises. Once the system was constructed, a company’s wardrobe colour selection and coated sheet sample was used as an example to test its efficacy. The wardrobe colour selection system was evaluated to optimize the design of the company’s original wardrobe product colour selection. The results showed that the wardrobe colour selection system improved consumers’ preference for the company’s wardrobe colour selection. The wardrobe colour selection system provides a reference for furniture companies, engineers and designers in product colour selection and optimization design, which is conducive to scientifically informed manufacture and a standard formulation of furniture colour.
DOI: 10.15376/biores.17.3.3912-3928
Keywords: Wardrobe colour; Colour beauty evaluation; Wardrobe colour selection; Wardrobe product colour optimization
Contact information: a: College of Furnishings and Industrial Design, Nanjing Forestry University, Nanjing 210037, China; b: Jiangsu Co-Innovation Center of Efficient Processing and Utilization of Forest Resources; c: Nottingham School of Art and Design, Nottingham Trent University, Nottingham NG1 5FQ, UK; *Corresponding author: zcm78@163.com
GRAPHIC ABSTRACT
INTRODUCTION
The wardrobe is a ubiquitous type of bedroom furniture that has a large visual surface area (Wagner et al. 2018). Due to the simplicity in the shape of its design, consumers focus on the colour selection, as a primary aspect of the wardrobe. This influences their decision to select and purchase. Therefore, the colour of a wardrobe is a high priority for wardrobe design. The construction of the colour selection system of a wardrobe can quantify the perceptual results of the colour beauty of the wardrobe. It can provide a scientific and rigorous wardrobe colour selection system, from a method system suitable for the wardrobe colour system, assist companies and designers to evaluate and improve the wardrobe colour selection, provide better wardrobe colour schemes, and improve the design efficiency of the wardrobe (Manoussos 2013). It will help consumers choose wardrobe products that suit their personal taste and their home environment, optimize decoration, modify the environmental space, and enrich their lives (Hamada et al. 2020).
There are many methods of quantitative analysis for colour, which provide scientific, rigorous, objective, and a theoretical basis for colour system research. Zhang et al. (2020) determined different colour threshold intervals based on the hue saturation value (HSV) colour system and used Matlab software to complete the colour extraction in the landscape image. The colour composition and colour space were used for quantitative analysis of the ornamental value of landscape forests by colour factors and influence level. Based on HSV, Tao et al. (2015) proposed a method for quantitative comparison of clothing colour attributes (colour, purity, lightness), considering the influence of area to establish a colour attribute contrast formula, corresponding to its colour contrast type. Li et al. (2017) obtained the fitting equation of the contrast colour angle range and the critical colour value of the human-computer interaction interface through experiments based on the hue saturation brightness (HSB) system. They used the dual comparison method to find the relationship between the colour change and the interface beauty, and they applied it to the optimized interface scheme. In summary, colour system related research relies on the HSV and HSB systems. Approaches based on color theory have been less used. The colour quantification process and results may have insufficient system and error problems.
The research of furniture colours has associated problems, such as difficulty in quantification, inconsistent colour standards, and a wide range of colour defects caused by inconsistent materials and processing techniques. As a result, establishing a reliable and repeatable colour system and standard through colour research for the furniture industry is a challenge. Cui et al. (2020) used the HSB colour system to carry out quantitative analysis of hue, purity, and lightness, and they selected typical samples as the custom wardrobe colours of domestic mainstream furniture brands that are suitable for the elderly, which was explored considering the physiology of the elderly. This work also considered the psychological characteristics of colour requirements, and selection characteristics have also been examined. Zhang and Wu (2017) studied the space and furniture design characteristics of the government office area of the Republic of China based on HSB and provided theoretical support for the furniture design. Luo (2017) obtained the colour gamut of different colour harmony based on the CNCS colour system. According to this method, the soft package colour scheme of outdoor furniture can be matched with different characteristic effects, illustrating that it has order and objectivity. Guo (2019) studied the colour of furniture, based on the Menspencer Harmony Theory (MHT), examining the colour rules and characteristics of the wooden frames and soft bags in different styles of sofas on the market, and compared the colours of upholstered furniture in a more comprehensive and systematic manner. This systematic and thorough analysis provides a certain reference for the colour research of upholstered furniture. Because the upholstered furniture as colour samples was sourced from different companies and brands, it was possible to arrange and research the popular styles in the market, but the colour samples and systems of each company were not unified, which led to the optimization of the company’s own products by this method. The reference value of the improvement is small; the colour sampling method recorded the colour by photography. Due to the comprehensive influence of the colour difference of the photographic images, the display screen and the colour taking software, the colour samples obtained by taking the colour have an error with the actual colour and with the wooden frame. In the matching colour system, wood colours are mostly red, brown, orange, and yellow. Thus, the research focuses on the beauty and harmony of these colours. These are topics, for which there has been insufficient research related to furniture colours.
In this study, colour theory was applied to support a better understanding of the colour characteristics at work in furniture design. Taking the wardrobe as an example, the authors used the CHN Spec colour picker for physical colour measurements. In order to eliminate the colour difference of the material itself or the uneven colouring of the plate during the processing, ten points were randomly selected from the surface of the plate during measurement and the colour values of the ten points were recorded. The average value of the colour values of the ten random points is taken for follow-up colour analysis. Random colour selection can ensure that a reasonable visual colour value can be obtained regardless of whether the plate is single-colour or multi-colour. The obtained sample plate value was firstly analyzed by the single-colour HSB value to obtain the perceptual range of the sample colour. A two-colour combined colour analysis of the two panel samples was then performed. Based on the results of the colour analysis, the subsequent plate colour selection and optimization can be carried out, so that the wardrobe products can meet the aesthetic requirements of consumers. The colour selection system took 35 paint sheet samples from the T company as an example, and the feasibility of the system can be tested. The test results showed that the system could better assist companies and designers in colour selection and optimization. The study focused on improving the furniture industry processes. This research will provide companies with a useful review process, whereby it can effectively optimize its own products, using this as a reliable reference for research into colour selection for furniture.
EXPERIMENTAL
Colour Selection System Construction
The colour selection system of wardrobe consists of three parts: collection and analysis of monochrome data of coated sheet samples, collection and analysis of colour matching data of coated sheet samples and colour selection, and data analysis of, in this case, the wardrobe.

Fig. 1. Wardrobe colour selection system, (source: the authors, 2022)
Collection and Analysis of Monochrome Data of Coated Sheet Sample
The colour spectrum CHN Spec colour picker was used to extract the colour of the sample to obtain the lightness value (L*), red-green colour value (a*), and yellow-blue colour value (b*). To reduce errors, multiple experiments were conducted, and the average values were calculated (Li et al. 2002). The Portable 45/0 Spectrophotometer CS-600C/600CG as well as its software inside was used to randomly select 10 location points on the plane of each test sample material to extract its colour data, and the measurement points were selected to include as many light and dark changes as possible (Su 2018). The colour picker was connected to the computer software colour QC, and 10 data points were recorded. Finally, the average value of the data was recorded as the L* a* b* values (Dody et al. 2019).
After completing the Lab value data collection and sorting, the Zudaojian formula was used to perform data conversion and convert it into H (Eq. 1), V (Eq. 2), and C value (Eq. 3). For quantitative analysis, three-attribute characteristics of colour were employed as follows,
V=0.100 2L*-1.160 (1)
H=-0.03636L*+0.2663γ-14.30θ+0.09131γθ+14.826 (2)
C=0.1439γ+1.054θ-1.022θ²+0.0497γθ-0.167 (3)
where θ=arctan(a*/b*), γ=(a*2/b*2)1/2. The H hue label value in Eq. 1 was converted into the corresponding colour system interval in the hue circle based on YR, as it was convenient to divide the colour system interval according to the quantified value of the colour hue (Ren 2018). The conversion formula is shown in Table 1.
Table 1. Tone Label Conversion Formula

Collection and Analysis of Match Colours Data of Coated Sheet Sample
Several processes were used to calculate the hue difference, brightness difference, and chroma difference of the two colours according to the Meng-Spencer colour harmony theory and the Burkhoff beauty evaluation formula, and to judge the harmony relationship. In addition, these processes were completed, and the aesthetic value of colour matching was calculated. Under the condition that the gloss, texture, touch, and other values remained unchanged, only the characteristics of different colour matching of the same type of materials and the law of harmonious relationship were analyzed, and finally the colour matching was analyzed. The program underwent an aesthetic evaluation (Kirillova et al. 2018). To eliminate the influence of material texture and surface treatment process differences on the colour matching effect, the material type should be invariant, and samples of the same material should be used as variables for mutual matching. The beauty evaluation and analysis of the colour matching schemes of all enterprise wardrobe products was conducted (Labrecque 2020).
Colour Selection and Data Analysis of Wardrobe
After collecting and analyzing the monochrome colour attributes and colour matching colour data of the company’s coated sheet, the approximate colour interval and style bias of the company’s coated sheet colour was obtained. The company’s colour database was formed as a colour selection inspiration library for wardrobe products (Wang and Pang 2017). When the wardrobe style was determined, the colour selection of the wardrobe can eliminate the influence of other factors, such as appearance, craftsmanship, size, material, function, partition (Wu 2015), etc. The different monochrome selection schemes and colour matching selection schemes based on colour attributes and data changes need to be reconsidered.
RESULTS AND DISCUSSION
Colour Selection System Application
Taking T company’s coated sheet sample as an example, the colour selection system of Wardrobe was introduced into the colour selection system. Effective coated sheet samples were collected from T company’s existing product library and experiments were completed to obtain a total of 35 colour measurement data, including 15 modern oil blends, 15 baking varnishes, and 5 UV curing coated sheet samples.
Collection and Analysis of Monochrome Data of Coated Sheet Sample
Among the 35 samples of the wardrobe coated sheet sample, there were 10 samples in orange (YR), 2 in red (R), 16 in yellow (Y), and 7 in yellow-green (GY). The respective proportions are shown in Fig. 2.

Fig. 2. Percentage of coated sheet sample hue label value
The orange area had a hue label value between 2.21YR and 9.59YR; the red area had a hue label value between 5.31R and 7.34R. The yellow area had a hue label value between 0.59Y and 8.44Y, and the yellow-green area had a hue label value between 1.82. GY and 10.65GY. The coated sheet sample hues were mainly distributed in 5Y~10YR, that is, the coated sheet sample colours of T Company’s wardrobe were developed in the transition area from yellow to orange, mainly with warm colours, presenting a comfortable and warm furniture aesthetically pleasing style. Based on the Munsell colour system theory, the brightness (V) was divided into low, medium, and high brightness with values of 4 and 7, and the chroma (C) was divided into medium and low chroma with the value of 5. The coated sheet sample colour were in low, medium, and high brightness with values of 6, 24, and 5 respectively. The proportions of different brightness are shown in Fig. 3.

Fig. 3. Percentage of coated sheet sample of brightness value

Fig. 4. Percentage of coated sheet sample of chroma
Medium, low, and high brightness accounted for 69%, 17%, and 14%, respectively, which are higher than that of high-tech wood. The proportion of samples in low-brightness areas decreased, and the proportion of high-brightness areas increased. The numbers of low chroma, medium chroma, and high chroma were 34, 1, and 0, respectively. The proportions of different chroma are shown in Fig. 4. Low chroma accounted for 97%, and medium chroma accounted for 3%. There was no high chroma area. T Company’s wardrobe coated sheet samples covered medium, low, and high brightness areas, but there was no colour sample for high saturation areas. The overall colour was medium brightness and low saturation.
The colour attributes of 35 material samples of T company’s wardrobe coating materials were distributed according to chromaticity-lightness (CV) as presented in Fig. 5. The distribution area of the coating samples was divided into four parts, including high brightness, low chroma, and medium brightness. Low chroma, low chroma, low chroma, and medium chroma, medium chroma, of which there was only one colour sample, and the rest were in the high, medium, and low chroma areas within the low chroma. T company wardrobe coating materials were mostly low saturation, low colour purity, quiet and elegant, stable, and soft; coatings have a wide range of brightness and a wide range of colour shades, which can be bright and dazzling or dim and quiet.

Fig. 5. Chroma-Value (C-V) scattered distribution chart of coated sheet sample
Collection and Analysis of Match Colours Data of Coated Sheet Sample
The same process materials of the coated sheet sample were matched with each other to obtain a total of 241 sets of colour matching schemes. The excellent phase difference, brightness difference, chromaticity difference, and beauty value M were calculated through data processing, and the corresponding harmony relationship and order factor value.
The number of harmonic relationships belonging to hue, lightness, and chroma are shown in Fig. 6. In all colour schemes of company T’s coatings, the number of hues, lightness, and chroma in the first ambiguous zone was at most 150, which are located in the contrast and harmony. There were at least 66 zones, none of which were in the same hue and zone. The first ambiguous zone is a closer match of colours. From the visual effect, the two colours are neither integrated nor uncomfortable, resembling a vague feeling, which has the most negative influence on the overall aesthetics. The colour of the contrast and harmony zone presents a strong contrast relationship, showing clear differences in visual effects, achieving significant visual impact, having a positive influence on the overall aesthetic. Therefore, in the colour matching selection of the wardrobe coated sheet sample scheme, T Company should optimize or eliminate the first ambiguous area and choose more contrast and similar colour schemes in the reconciliation area.
 Fig. 6. Distribution of coated sheet sample colour and relationship quantity
According to Figs. 7 and 8, in the proportion of the harmony relationship of coated sheet sample colour schemes, the harmony relationship of hue was mainly distributed in the first ambiguous zone and the second ambiguous zone, and the harmony relationship of lightness/chroma was mainly distributed in similar harmony areas and contrast and harmonized areas, none of the same tones and areas. In all colour schemes of coated sheet sample, hue had a negative impact on improving the overall beauty, and brightness/chroma had a positive impact. Therefore, in the colour matching selection of the wardrobe coating scheme, T company needs to pay more attention to the harmonizing effect brought by the colour difference to enhance the overall beauty of the colour matching.

The aesthetic value (M) calculated by the order factors and complexity of each group of matching schemes is presented in Fig. 9. The M value of 0.5 was set as the dividing line to judge whether it meets the aesthetic feeling. In the coated sheet sample colour matching scheme, most of the M values were less than 0.5, which does not meet the aesthetic feeling, and the colour matching effect was not good. Among the aesthetic colour schemes of T Company’s wardrobe coatings, modern oil blends and UV curing coated sheet samples are the main ones, and the colour scheme selection of baking coated sheet sample needs to be expanded.

Fig. 9. Scatter chart of beauty value of coated sheet sample
Wardrobe coatings H, C/V harmony relationship, and the specific distribution of the number of beauty values are shown in Table 2. Most of the 241 colour schemes did not meet the aesthetics, of which 73% were unreasonable and 27% had good colour matching effects. Among the 65 sets of colour matching that meet the aesthetics, the colour matching effect was divided into 4 levels according to the M value, and the best effect was the M=1.04 colour combination. When the hue harmony relationship is the same, the lightness/chroma harmony relationship is the key factor to enhance the beauty, and the degree of influence is contrasting harmony area>similar harmony is when the lightness/chroma harmony relationship is the same, the hue harmony relationship is the key factor to enhance the beauty, affecting the degree is similar>second>first.
Table 2. Coating Class Harmony Relationship and Quantity Distribution of Beauty Value

Colour Selection and Data Analysis of Wardrobe
The user orientation of the monochrome wardrobe selection scheme targeting the consumer is for people in their 20s to 40s who pursue a simple, natural, and relaxing lifestyle. The scheme selection is divided into three categories, and each category verifies the influence of hue, chroma, and brightness on consumer choices. Figure 10 shows the specific selection scheme, with a total of 16 schemes. In the Munsell colour system, the hue is divided into 10 intervals, so category one includes 10 colour schemes: category two includes low chroma, medium chroma, and high chroma colour schemes, and category three includes low brightness, medium brightness and high brightness 3 brightness level colour schemes.

Fig. 10. Monochrome Selection scheme
The 16 monochromatic selection schemes were recorded through the Photoshop colour picker to record their corresponding L*a*b* values and HSB value, and the L*a*b* values were converted into HSB value using the formula. Table 3 shows the data of the 16 monochromatic wardrobe selection schemes. The colour in the monochrome scheme selection includes different intervals of hue, chroma and lightness, 10 hue intervals, 3 chroma intervals, and 3 lightness intervals. The colour span represents a wide range, covering different colour attribute characteristics. The colour selection scheme with hue as the variable in category one is divided by the Munsell hue circle, which basically includes different colour categories, and all of them are low in saturation with high brightness levels. The colour selection schemes with chroma as a variable in category two are divided by chroma levels, including low, medium, and high chroma, and all are orange (YR) high brightness. The colour selection schemes with lightness as a variable in category three are divided into lightness levels, including low, medium, and high lightness, and all of them are orange (YR) and low chroma.
Table 3. Monochrome Wardrobe Selection Plan Data

The user positioning of the colour matching wardrobe selection scheme is a young person who pursues taste, fashion, simplicity, and practicality between the age of 20 to 30. The scheme selection selects the M value and its corresponding harmony relationship from the existing coated sheet sample colour schemes, and then optimizes and upgrades its colour scheme. In the T company’s original wardrobe colour selection plan, 3 groups of original colour schemes were selected for colour optimization selection, including 2 groups that were not aesthetically compliant, with M values of 0.02 and -0.2, respectively; 1 group was aesthetically compliant, with M values of 0.82. Contrast, similarity, same tones, and zones have a positive influence on the overall aesthetics. The first and second ambiguous zones have a negative influence on the overall aesthetics. Because of the optimization of colour matching and enhancement of aesthetics, the variables are contrast, similar, same tones, and zones. In this way, it is optimized to verify the influence of the harmonic interval of hue and the harmonic interval of chroma/light on consumer choice. In Figure 11, category one and category two are colour schemes where the original data does not meet the aesthetics. The H harmonic interval is the invariant, and the V/C harmonic relationship is the variable factor. Each type of scheme contains the original data and a total of 4 colour selection schemes to verify the V/C. Reconciling the relationship has varying degrees of influence on enhancing aesthetics. Category 3 is the colour scheme with the original data in line with the aesthetics, with the V/C harmonic interval as the invariant and the H harmonic relationship as the variable factor. Each type of scheme contains the original data and a total of 4 colour selection schemes to verify the impact of the H harmonic relationship on the aesthetics. There are a total of 12 three types of the colour matching selection.

Fig. 11. Two-colour selection scheme
Table 4. Colour Matching Wardrobe Selection Plan Data

In the colour scheme selection, the first line of each category is the original colour matching data, and the other three lines are optimized scheme data. The harmony relationships are contrast, similar, and same colour. Category one/category two (M=0.02/-0.2) raw data does not meet the beauty evaluation standard, and category three (M=0.82) raw data meets the beauty evaluation standard. The beauty value M of the 12 colour matching selection schemes is summarized in Table 4, where M>0.5, is marked in bold in the table. The M value of the optimized colour scheme was improved compared with the original scheme; that is, the aesthetics of the optimized scheme increase. In category three, the M values of the four schemes with H harmonic relationship as variables were all greater than 0.5, which is not much different from the original data. Among them, the harmony relationship is the highest aesthetic value in the contrast and harmony zone, the effect of the V/C harmony relationship on the improvement of the beauty is contrast>similar>same colour, and the influence of the H harmony relationship on the improvement of the beauty is contrast>same colour>similar. It can be seen from the influence of the beauty value brought by the changes of the V/C harmony relationship and the H harmony relationship that the V/C harmony relationship had a more significant impact on the overall aesthetic improvement, and the H harmony relationship has little effect on the beauty.
Table 5. Colour Matching Selection Plan M Value Summary Table

System Validation
To optimize the colour for the colour scheme that T Company uses, the colour selection system of Wardrobe and the colour scheme of the coated sheet sample were investigated, through the survey questionnaire method, to evaluate the consumer preference and verify the colour selection system of Wardrobe for the selection of the company’s wardrobe products. The survey subjects were required to have no special visual conditions such as colour blindness and colour weakness, including ages under 25, 26 to 35, 36 to 45, and over 45, with different backgrounds, cultures, regions, occupations, consumption levels, etc., and the user population covering a wide range with 376 valid questionnaires being finally obtained.
In the distribution of preferences with hue as a variable factor in the colour selection scheme of a monochrome wardrobe (Fig. 12), consumers’ preference for hue was mainly YR, Y, and R, and in the distribution of preferences with chroma as a variable factor (Figs 5 through 8), low chroma accounted for the highest proportion; in the preference distribution with brightness as a variable factor (Figs. 5 through 9) high brightness had the highest proportion; that is, consumers prefer medium and low chroma and medium and high brightness. The colour attributes and characteristics in the development of T company’s wardrobe samples were basically consistent with consumer preferences. In existing samples, colour samples in the medium and high brightness and medium and chroma ranges can be retained and improved, and high chroma and low brightness can be appropriately eliminated or optimized. Colour samples within the range expand the number of colour samples in the low-chroma high-brightness, and medium-colour high-brightness range.

Fig. 12. Distribution of hue preferences in monochrome wardrobes

Fig. 13. Proportion of chroma and lightness preferences in monochrome wardrobes
In the colour selection scheme of the colour matching wardrobe, the distribution of consumer preferences with the harmony interval as the variable is shown in Fig. 14. The colour matching optimization scheme based on the colour harmony theory, the contrast and harmony area had the most positive impact, and the three sets of colour matching. The category favorites had the largest number of colour schemes in the contrast and harmony zone, and the impact of the beauty is the most significant change in the V/C harmony zone (M=0.02 and M=-0.2). The group with the V/C harmonic interval as a variable had the following influence on consumer preference: Contrast>Similar>Same colour, similarly harmonized zone and same hue and zone had less influence. The group with the H harmonic interval as the variable (M=0.82) had little effect on consumer preference, and the similar harmonic zone and the same hue and zone had negative factors.
The quantitative analysis conclusions of the three sets of colour matching optimization schemes show that the M value was improved compared with the original scheme, and the beauty value of the contrast and harmony area was the highest. The degree of influence of the V/C harmony relationship on the improvement of aesthetics was contrast>similar>same colour, the degree of influence of the H harmony relationship on the improvement of aesthetics is contrast>same colour>similar, the V/C harmony relationship had a more significant impact on the overall aesthetic improvement, and the H harmony relationship had little effect on aesthetics. The colour matching optimization scheme under the guidance of colour harmony theory had improved consumer preference to a certain extent, and the degree of preference improvement basically coincided with the quantitative conclusion, indicating that the theoretical method was suitable for improving the beauty of colour matching.

Fig. 14. Distribution of preferences in different harmony intervals in the colour matching wardrobe
CONCLUSIONS
- Putting together a colour selection system for wardrobe furniture, based on the Munsell colour system, the Mont-Spencer principle of colour harmony, and the Birkhoff beauty rating system, the proposed approach complements the inadequacies of those theories and makes the combination more applicable for the wardrobe colour system.
- Prior to this study, company T’s panel colour selection did not follow the colour theory support of the Munsell colour system, the colour harmony theory, and the Birkhoff aesthetic colour selection system. As a result, among all the colour schemes of the coated paper samples of T Company, the largest interval number of hue, lightness, and chroma belonged to the first fuzzy area, while the number of coated paper samples in the contrast and coordination area was very small. The ratio was in the first fuzzy area, the ratio of the lightness/chroma harmony was in the similar harmony area and the contrast harmony area. There was no common hue and area. That is, most of the coated sheet colours, which had not been selected based on colour theory, did not meet the aesthetic sense, and the colour matching effect was inconsistent and unreasonable. This research has helped T Company complete the colour selection of the company’s internal coated sheet, and helped it re-plan the colour scheme of wardrobe products to achieve the desired effect.
- When considering the colour selection scheme of monochrome wardrobes, consumers mainly prefer YR, Y, and R, and they prefer the warm tones range from red to yellow. In the colour selection scheme of colour matching wardrobe, the contrast and harmony area have the most positive impact on consumers’ preference. The colour matching optimization scheme under the guidance of colour harmony theory can improve consumer preference to a certain extent, and the degree of preference improvement is basically consistent with the quantitative conclusion of colour matching (Zhou et al. 2020). Of course, in order to ensure the company’s market competitiveness, the company should explore more colour schemes within the scope of aesthetic theory to ensure that it can meet the preferences and needs of various consumers. Due to the influence of fashion factors and market demand that may cause changes in consumer preferences, it is also necessary to regularly use the colour selection system to upgrade and optimize products according to market trends.
ACKNOWLEDGMENTS
The authors are grateful for the support of National Key R&D Program (2017YFD0601104); Project of Home Branch of Dehua Tubao Decoration New Materials Research Institute (201901), a project from International Cooperation Joint Laboratory for Production, Education, Research, and Application of Ecological Health Care on Home Furnishing.
REFERENCES CITED
Cui, D. R., Wan, Q., and Song, S. S. (2020). “Research on CMF design of aging-friendly furniture,” Forest Products Industry 57(05), 61-64. DOI: 10.19531/j.issn1001-5299.202005014
Dody, Q., U., Tati, L. R. M., Richard, M., Andika, P. G., and Tauhid, N. A. (2019). “RGB color cluster and graph coloring algorithm for partial color blind correction,” MATEC Web of Conferences 255, 01002. DOI: 10.1051/matecconf/201925501002
Guo, T. T. (2019). Aesthetic Quantitative Research on Colour Matching Design of Sofa Wood Frame and Soft Package, Master’s Dissertation, Nanjing Forestry University, Nanjing, China.
Hamada, D., Yamamoto, H., and Saiki, J. (2020). “Association between synesthetic colors and sensitivity to physical colors changed by type of synesthetic experience in grapheme-color synesthesia,” Consciousness and Cognition 83, article no. 102973. DOI: 10.1016/j.concog.2020.102973
Kirillova, N. P., Grauer-Gray, J, Hartemink, A. E., Sileova, T. M., Artemyeva, Z. S., and Burova, E. K. (2018). “New perspectives to use Munsell colour charts with electronic devices,” Computers and Electronics in Agriculture 15(5), 378-385. DOI: 10.1016/j.compag.2018.10.028
Labrecque, L. I. (2020). “Color research in marketing: Theoretical and technical considerations for conducting rigorous and impactful color research,” Psychology and Marketing 37(7), 855-863. DOI: 10.1002/mar.21359
Li, Y. F., and Zhang, X. R. (2002). “Engineering evaluation method of modern colour harmony theory,” Packaging Engineering 2002(03), 152-153+156.
Li, Y. J. (2017). Human-computer Interaction Interface Quality Evaluation Based on Colour Quantification, Master’s Dissertation, Hefei University of Technology, Hefei, China.
Luo, G. Z. (2017). “The application research of CNCS colour system in outdoor furniture fabric soft package design,” Art Technology 30(2), 273.
Manoussos, A. (2013). “A Birkhoff type transitivity theorem for non-separable completely metrizable spaces with applications to linear dynamics,” Journal of Operator Theory 70(1), 165-174. DOI: 10.7900/jot.2011may12.1971
Ren, W. X. (2018). “Birkhoff’s aesthetic formula and verbal wisdom,” Teaching Monthly 2018(09), 61-62+60.
Su, T. T. (2018). Research on the Influence of Pine Wood Surface Modification on Visual Characteristics, Master’s Dissertation, Hefei University of Technology, Hefei, China.
Tao, C., Duan, Y. F., and Yin, M. F. (2015). “Research on the quantification method of clothing colour features based on HSV,” Silk 52(06), 22-26.
Wagner, A.-S., Kilincsoy, U., and Vink, P. (2018). “Visual customization: Diversity in color preferences in the automotive interior and implications for interior design,” color Research and Application 43(4), 471-488. DOI: 10.1002/col.22218
Wang, R. Y., and Pang, C. Y. (2017). “Research on the colour control of urban advertisements based on the Meng Spencer colour principle,” Shanxi Architecture 43(26), 19-20. DOI: 10.13719/j.cnki.cn14-1279/tu.2017.26.010
Wu, J. (2015). “Research on colour research method combining Munsell colour system and PCCS—Taking the research on colour aesthetic tendency of contemporary college students as an example,” Beauty and Times (Part 1) 2015(11), 29-31. DOI: 10.16129/j.cnki.mysds.2015.11.010
Zhang, X. J., Chen, J., Li, Q. Y., Liu, J. C., and Tao, J. Q. (2020). “Colour quantification and landscape aesthetic quality evaluation of autumn landscape forests in western Sichuan based on visual characteristics,” Journal of Applied Ecology 31(01), 45-54. DOI: 10.13287/j.1001-9332.202001.016
Zhang, X. X., Yang, M. G., Su, J. N., Yang, W. J., and Qiu, K. (2020). “Research on product color design decision driven by brand image,” color Research and Application 45(6). DOI: 10.1002/col.22540
Zhang, Y. Q., and Wu, Z. H. (2017). “The colour model analysis of government office furniture and indoor space during the Republic of China,” Journal of Forestry Engineering 2(06), 150-156. DOI: 10.13360/j.issn.2096-1359.2017.06.026
Zhou, C. M., Leng, C. X., Zhan, X. X., Jia, H. L., and Kang, M. H. (2020). “Colour quantification analysis of customized wardrobe based on HVC,” Forest Products Industry 57(09), 37-40. DOI: 10.19531/j.issn1001-5299.202009009
Article submitted: February 25, 2022; Peer review completed: April 25, 2022; Revised version received April 19, 2022; Accepted: April 29, 2022; Published: May 4, 2022.
DOI: 10.15376/biores.17.3.3912-3928