
Abstract
This paper focuses on the drying studies of foam-formed wood fibre based relatively thick materials via infrared drying, impingement drying, and microwave drying. The drying experiments were carried out for materials with three initial moisture ratios and thickness levels. Material selection was guided by the possibility of using these kinds of materials in packaging and construction applications. The motivation for this study was the fact that in water-based manufacturing a lot of energy is consumed during the drying phase; therefore, the better understanding of drying kinetics is essential for improving the environmental friendliness and cost efficiency of material production. The results revealed differences in the results of drying methods and limitations for thick, porous wood fibre-based materials. The differences in these methods affected the drying rates and material quality, which both can arise as the limiting factor for material production. The highest drying rate was observed using microwave drying, the intermediate drying rate was achieved using impingement drying, and the lowest using infrared drying.
Download PDF
Full Article
Drying of Thick Foam Formed Mats Comprising Chemithermomechanical Pulp Fibers
Oleg N. Timofeev,* Petri Jetsu, and Janne T. Keränen
This paper focuses on the drying studies of foam-formed wood fibre based relatively thick materials via infrared drying, impingement drying, and microwave drying. The drying experiments were carried out for materials with three initial moisture ratios and thickness levels. Material selection was guided by the possibility of using these kinds of materials in packaging and construction applications. The motivation for this study was the fact that in water-based manufacturing a lot of energy is consumed during the drying phase; therefore, the better understanding of drying kinetics is essential for improving the environmental friendliness and cost efficiency of material production. The results revealed differences in the results of drying methods and limitations for thick, porous wood fibre-based materials. The differences in these methods affected the drying rates and material quality, which both can arise as the limiting factor for material production. The highest drying rate was observed using microwave drying, the intermediate drying rate was achieved using impingement drying, and the lowest using infrared drying.
DOI: 10.15376/biores.17.2.2547-2562
Keywords: Foam forming; Foam formed materials; Infrared drying; Impingement drying; Microwave drying
Contact information: Koivurannantie 1, P. O. Box 1603, Jyväskylä 40101 Finland;
* Corresponding author: oleg.timofeev@vtt.fi
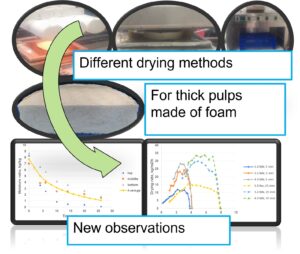
GRAPHICAL ABSTRACT
INTRODUCTION
As is stated in the Sustainable Development Goals set by the United Nations, a drastic reduction in greenhouse gas emissions is essential to combat against climate change. One possibility to answer this challenge is to develop sustainable products, which are based on renewable raw materials. In addition, such materials are recyclable and in many cases biodegradable. As wood is an abundant renewable carbon holding material, it is a very attractive raw material for such sustainable products, which can be used for multiple purposes, e.g., packaging, construction, and automotive applications.
The idea of utilizing foam-forming technology for forming a fiber mat from wood fibers is not new. The first patent related to this technology can be found as early as 1929 (Bryant 1929). In addition, there were many activities related to foam forming in the 1970s (Radvan and Gatward 1972; Smith and Punton 1974). In recent years, foam forming again became a subject of interest, primarily because foam forming technology enables the manufacturing of new types of sustainable and light-weight products from wood and other cellulose fibers (Pääkkönen et al. 2016).
Foam forming technology utilizes small air bubbles containing aqueous foam as a transporting medium for solids, e.g., fibers. Air bubbles effectively prevent fiber flocculation by decreasing the mobility of fibers, which leads to excellent homogeneity of the product (Smith and Punton 1975; Lehmonen et al. 2018). Foam also increases the distance between the fibers, which enables the production of very high porosity structures (Pöhler et al. 2016, 2018). In principle, the manufacturing process of foam-formed materials includes the following steps: fiber foam generation, forming the material, dewatering, and drying. From these steps, the drying phase, and more specifically the evaporation of water, consumes a high amount of energy (Tsotsas and Mujumdar 2011). Therefore, it is a critical manufacturing phase, which greatly effects the sustainability of the whole manufacturing process. The introduction of foam and thus air to the material greatly influences the heat transfer to and out from the material. Air bubbles reduce the heat transfer coefficient, thus having great influence especially for thick materials.
Scientific work related to the drying of highly porous wood-based foam formed materials is still very limited, and only a few publications can be found (Timofeev et al. 2016; Qin et al. 2020; Cucharero et al. 2021). Better understanding of the drying kinetics of these materials is essential to design an effective drying process and product quality control. Only a few non-contact drying techniques can be utilized for drying highly porous materials, which have a relatively high initial moisture content. These potential drying methods are hot air blow drying (air impingement and through air drying), dielectric drying (microwave and radio frequency drying), and infrared drying.
In the drying methods listed above, heat is transferred via convection (hot air blow) and radiation (from infrared and dielectric) to the surface of the wet material (with dielectric drying also penetrating deeper into the material). Part of this heat propagates to the interior of the material (causing a rise in temperature and formation of water vapour), and the remaining amount is utilized in the evaporation of moisture from the surface (Tsotsas and Mujumdar 2011).
Hot air impingement drying and through air drying (TAD) using hot air as media are used for many different purposes in paper making, e.g., tissue drying, the drying of coated paper, and increasing the drying capacity in multi-cylinder drying (Stenström 2019). In the food industry, air-impingement ovens are used for baking and cooking such products as tortillas and potato chips, pizza crust, pretzels, crackers, cookies, bread (pita, flat), cakes, etc. Electric heaters or gas burners are used to heat air in impingement drying. Typically, the temperature and air jet velocity in impingement drying may range from 100 to 350 °C and 10 to 100 m/s, respectively (Mujumdar 1987). Evaporation rates of over 100 kg/m2/h can be achieved by using suitable drying parameters (Milosavljevic and Juppi 2010). In through air drying, the air flows through the structure, whereas in hot air impingement the air penetration to the structure is limited.
Electrically heated or gas-fired generators are used for generating infrared energy (Sakare et al. 2020). Infrared radiation supplies energy directly to the surface of a wet material and thus causes its rapid heating and drying. The heat is transferred further towards inner parts of the material via conduction. As IR-radiation has a limited penetration depth in the wet material, its effective application is for drying comparably thin materials, e.g., paper, boards, and paintings (Ratti and Mujumdar 2006).
The microwave drying process is one of the few rapid conventional heating/drying processes. It is capable of selectively heating dipoles of water volumetrically. Its applications are mostly in food, e.g., pasta, lumber, e.g., baseball bats, pharmaceuticals, e.g., tablet granulations, the coatings on paper or boards, and sand molds for casting (Ratti and Mujumdar 2006). In microwave drying, the volumetric heat generation due to the absorption of electromagnetic energy by water molecules results in a higher interior temperature and water vapour pressure, generated from electricity (Schiffmann 1987). The microwave power and drying temperature are the two most critical factors comprising the microwave drying system (Li et al. 2010). These two factors affect the drying parameters, e.g., drying time, drying rate, and final product quality (Kalla and Devaraju 2017). If too high a power is used, the temperature inside the material can reach the boiling point and excessive pressure due to vapour may expand the wet sample (Itaya et al. 2004). At a low moisture content, the temperature inside the material may increase very quickly to a very high unwanted temperature value, causing hot spots to the product, resulting in diminished product quality (Ratti and Mujumdar 2006). Microwave drying and radio frequency drying differ from each other in terms of the power loss mechanism; the former interacts via dipoles and latter via ionic conductivity. However, both drying methods are part of the radio frequency band of spectrum (Jones 1989).
This study was conducted to evaluate the drying kinetics and more specifically the drying time, drying rates, and moisture distribution inside the material during drying for selected foam formed samples using various drying methods, i.e., hot air impingement drying, infrared drying, and microwave drying. Material selection was motivated by their possible end use in packaging and construction applications.
Goals of the Study
The objectives of this research were to determine: (1) the effect of different drying methods and drying parameters on the drying time and drying rate of selected foam formed materials quantitively; and (2) the effect of one-sided air impingement drying on the moisture distribution inside the foam formed material quantitatively.
EXPERIMENTAL
Materials
Samples preparation
Chemi-thermomechanical pulp (spruce CTMP from Rottneros) and sodium dodecyl sulphate (SDS) surfactant were used for the preparation of the foam formed samples.

Fig. 1. NETZSCH mixer
The Canadian standard freeness (CSF) (according to ISO standard 5267-2 (2001)) and average fibre length (L&W Fiber Tester Plus) of the CTMP were 650 and 1.9 mm, respectively. The SDS dosage was 0.6 g/L. The pulp consistency was 3.5%. One sample with a dry weight of 21 g was prepared from 0.6 L of pulp. Fiber foam of 1.5 or 3 L was generated using a NETZSCH mixer (Fig. 1). The mixing plate speed was 2800 rpm and the duration of the mixing was 5 min. The fiber foam density was 400 kg/m3 (an air content of 60%). A cylindrical mould with an inner diameter of 164 mm was used for sample preparation (Fig. 2).


Fig. 2. Mold with the pressing plate (left) and pressed sample (right)
Three different sample types were made with different density and thickness levels without hard wet pressing to maintain bulk. First, fiber foam was poured into the mould. Then, excess water was removed through the forming fabric at the bottom of the mould by pressing the fiber foam with the perforated plate. The fiber foam was compressed until the thickness of the sample was 50, 25, or 5 mm. After pressing, the initial moisture ratio of the 50 mm thick samples was approximately 7 kg/kg, the moisture ratio of the 25 mm thick samples was approximately 8 kg/kg, and samples with a thickness of 5 mm had a moisture ratio of approximately 4 kg/kg. The pressed wet samples were dried using different drying methods. The dry weight of the samples with a thickness 5 and 25 mm was approximately 20 g, while the samples with a thickness of 50 mm were approximately 40 g. The density of the dry samples with a thickness of 25 and 50 mm was 45 kg/m3 and the samples with a thickness of 5 mm had a density of 180 kg/m3. In order to measure the moisture content variation during the drying process, samples on supporting fabric were taken out of the dryer periodically and weighted using a digital balance (KERN&SOHN GmbH, Model PLS 6200-2A).
In all the drying tests, the moisture ratio of the sample (Xi) was determined according to Eq. 1 (Timofeev et al. 2016),
 (1)
(1)
where mi is the initial mass, which was measured before each drying step, and md is the final mass, which was measured after keeping the sample in the oven for 2 h at an air temperature of 105 °C after the drying test was complete. A plot of the moisture ratio against the time yielded the drying curve.
The drying rate was calculated using moisture ratio of the sample measured before drying and after drying, as shown in Eq. 2 (Timofeev et al. 2016),
 (2)
(2)
where md is dry weight of the sample, A is the sample surface area, and t is the time interval; X0 and Xf are moisture ratio before and after drying.
A plot of the moisture ratio against the time yielded the drying curve, and a plot of the drying rate against the moisture ratio yielded the drying rate curve.
Drying Equipment
Air impingement dryer
The air impingement dryer (Fig. 3) comprises of an impingement box with a series of circular nozzles and a movable supporting table with porous fabric, an air heating unit with electric resistance heating elements and temperature controller, and a fan with a frequency converter for controlling its rotation speed. The nozzle diameter was 2.5 mm, and the total area of the holes was 1.5% from the total area of the impingement box. Three air temperature levels were used (100, 150, and 200 °C) in the experiments. The air jet velocity was measured with a Mikor air pressure (velocity) meter and kept constant at 50 m/s. The distance from the nozzle to the sample surface was 25 mm.

Fig. 3. Impingement dryer
Infrared Dryer
The infrared dryer (heater) included three 230 V, 1500 W IR lamps (HeatLight Technology, Model HLW15) with a length of 350 mm. The lamps were connected to a regulating transformer (potentiometer), which enabled the power supplied to the lamp to be varied from 0 V to 230 V. Drying experiments were done at three total power levels, i.e., 1800, 3600, and 4200 W. The infrared dryer was fitted above the sample supporting table (as shown in Fig. 4). The distance from the IR lamps to the sample was 15 cm.

Fig. 4. Infrared dryer
Microwave Oven
The microwave drying experiments were conducted with a microwave oven (BP-211/50 manufactured in Microwave Research and Applications, Inc.). The maximum output power of the microwave was 3.2 kW at a frequency of 2.45 GHz (as shown in Fig. 5). The power control works much like a light dimmer switch to control the microwave power level (not pulsing the power). The drying experiments were conducted at three power levels, i.e., 1.3, 1.9, and 2.6 kW. These power values were not really measured, but they represented 40%, 60%, and 80% of the maximum 3.2 kW output power. The sample was placed in the center of the microwave cavity on a sample supporting table to facilitate the even absorption of the microwave energy.

Fig. 5. Microwave oven
RESULTS AND DISCUSSION
Effect of the Impingement Air Temperature
The drying curves and drying rate curves were measured for two materials (5 mm and 25 mm thick) at air temperatures of 100, 150, and 200 °C. Figure 6 shows the change in the moisture ratio of the sample with respect to the drying time. For samples with a thickness of 25 mm and an initial moisture ratio of 8 kg/kg, the drying time was longer in comparison to the drying time required for drying samples with a thickness of 5 mm and an initial moisture ratio of 4 kg/kg at the same air temperatures. For all drying treatments, the slope of the drying curves increased, and the total drying time was reduced as the impingement air temperature increased. A plot of the drying rate as a function of the moisture content, based on bone dry fibres, is also shown in Fig. 6. The drying rate for the same kind of material increased as the air temperature increased. At an air temperature of 200 °C, there was no constant rate period observed for the 25 mm thick sample. At a lower temperature, the drying consists of a constant rate period and a falling rate period. The drying of the 5 mm thick samples took place only during the falling rate period, and no constant rate period was observed at any air temperature used in the drying experiments. This result implies that the drying rate has a strong correlation with temperature and time. The highest drying rate (60 kg/m2/h) was measured at an air temperature of 200 °C with the 25 mm thick material.


Fig. 6. Variation in the moisture ratio (top) and drying rate (bottom) for impingement drying (Note: the air temperatures were 100 °C, 150 °C, and 200 °C, while the sample thicknesses were 5 mm and 25 mm). Note that there are no measured points within the initial heating period.
Effect of the Infrared Radiation Power Level
The infrared drying curves of two different materials dried under different power levels are shown in Fig. 7. Three infrared power levels were used: 1.8, 3.6, and 4.0 kW. During infrared drying, the moisture ratio decreased faster as the power level increased. At high power (3.6 and 4.0 kW), the drying was interrupted because of sample ignition. For the 25 mm thick sample, ignition happened after 10 min of drying (average MR =3 kg/kg), for the 5 mm thick samples, ignition happened after 7 min (average MR=1.5 kg/kg). A period with a constant (maximum) moisture removal rate was observed under all experimental conditions. The highest drying rate measured for the 25 mm thick samples was 33 kg/m2/h and the highest drying rate measured for the 5 mm thick samples was 27 kg/m2/h.


Fig. 7. Variation in the moisture ratio (top) and drying rate (bottom) for infrared drying (Note: the air temperatures were 100, 150, and 200 °C, while the sample thicknesses were 5 and 25 mm)
Effect of the Microwave Power Level
The microwave drying experiments employed three power levels (1.3, 1.9, and 2.6 kW) and the same kind of samples (with thickness 25 mm and 5 mm) as were used previously. The effect of the microwave power level on the drying kinetics of the wet samples is shown in Fig. 8. Considerable reduction is noted in the drying time as the microwave power level was increased. For the 25 mm thick samples, the total drying time using a 1.3 kW power level was 2.5 times longer than the total drying time for 2.6 kW. An even greater difference in the total drying time existed for the 5 mm thick samples when power increased from 1.3 to 2.6 kW.


Fig. 8. Variation in the moisture ratio (top) and drying rate (bottom) for microwave drying (Note: the microwave power levels were 1.3, 1.9, and 2.6 kW, while the sample thicknesses were 5 and 25 mm)
An apparent constant rate period was observed for all power levels used in the drying experiments as well as for different samples. Figure 10 shows how the drying rates of the two different samples changed as a function of the moisture ratio under various drying conditions. The drying rates increased as the microwave power level increased. For the 25 mm thick samples, the maximum drying rates were approximately 50, 110, and 150 kg/m2/h, when the applied microwave powers were 1.3, 1.9, and 2.6 kW, respectively. For samples with a thickness of 5 mm, the same microwave power levels led to the maximum drying rates of 40, 80, and 100 kg/m2/h.
During the first minute of microwave drying, the samples with a thickness of 25 mm expanded, but they soon shrunk back. Expansion was caused by the rapid elevation of the internal temperature and vapour pressure during the intensive heating period. No expansion was observed for samples 5 mm thick during microwave drying.
Volumetric heat input clearly speeds up the drying rate compared to surface heating in both hot air impingement drying and infrared drying. The maximum drying rate achieved was 150 kg/m2/h, which was considerably higher than in impingement (63 kg/m2/h) and infrared (33 kg/m2/h) drying.
The advantages of microwave drying arise from the volumetric heating and internal vapour generation. Heating from the interior of the sample leads to the build-up of an internal vapour pressure, which drives the moisture out of the material. This results in a substantial reduction in drying time.
Appearance of the Dried Samples
Samples were formed in a mold, compressed until a thickness of either 25 mm or 5 mm was achieved, which was followed by drying using different drying techniques. Cross-sections of the dry samples are shown in Figs. 9 and 10.
During drying, the samples with an initial thickness of 25 mm were shrunk to an average thickness of 20 mm. The samples with an initial thickness of 5 mm essentially did not shrink, which is probably because of their higher density.

Fig. 9. Cross-section of the dry samples after impingement drying (top sample), infrared drying (middle sample), and microwave drying (bottom sample) (note: the sample thickness is 25 mm before drying in all cases)

Fig. 10. Cross-section of the dry samples after impingement drying (top sample), infrared drying (middle sample), and microwave drying (bottom sample) (note: the sample thickness is 5 mm before drying in all cases)
Before drying, all the samples had a white colour. After impingement drying, the samples that dried at an air temperature of 100 °C did not change surface colour. At higher temperatures, yellow spots appeared on the surface. These spots were darker at an air temperature of 200 °C. It was also noticed that the thicker the samples, the darker the spots.
During infrared drying at a high power level, dark spots appeared on the sample surface, which started to smoke, despite the presence of moisture inside the material.
The samples dried in a microwave oven did not change colour.
Drying of the Samples with a Thickness of 50 mm
The same methodology for making the foam-formed samples that was used earlier was used to make samples with a thickness of 50 mm. Two drying methods were studied: air impingement drying at an air temperature of 150 °C and an air jet velocity of 50 m/s; and microwave drying at a power level of 1.9 kW. The drying curves and drying rates are shown in Fig. 11. The total drying time using impingement drying was much longer than when using microwave drying. The maximum drying rate when using microwave drying was approximately 130 kg/m2/h , while it was only 40 kg/m2/h for impingement drying. A longer constant rate period was observed during microwave drying. For impingement drying, the falling rate period already began at an average moisture ratio of 5 kg/kg, but for microwave drying, the falling rate period started when the moisture ratio decreased to below 2 kg/kg.
The dry samples after microwave drying and after impingement drying are shown in Figs. 12 and 13, respectively. At a low moisture content, due to non-uniform microwave heating, local overheating and the consequent burning of the sample subjected to drying in a microwave oven was observed. This was because, although all water was completely removed, other polar compounds present in the structure continued to absorb microwaves, resulting in local overheating and consequent charring. Darker areas on the sample surface and inside the sample appeared. Smoke came from inside the sample at the end of the drying process.
The non-uniform darkening effect observed after microwave drying partially results from the fact that sample did not move during the drying process, as well as the fact that the power dissipation in the drying chamber to the sample was not even. This resulted in local dryness differences that resulted in temperature differences, especially at the end of the drying process.
The results indicated that microwave drying is a very efficient drying method, but the power levels used at different drying phases should be controlled to avoid product quality problems. In addition, as the samples were not moved or rotated during the drying process, there could have been local microwave field differences that caused this effect.


Fig. 11. Variation of moisture ratio (top) and drying rate (bottom) in impingement (IMP) and microwave (MW) drying (Note: the sample thickness before drying is 50 mm)
Another sample was dried in an impingement dryer at an air temperature of 150 °C. Only slight yellowing was observed on the sample surface.

Fig. 12. Cross-section of the dry sample after microwave drying (Note: the sample thickness before drying is 50 mm)

Fig. 13. Cross-section of the dry sample after impingement drying (Note: the sample thickness before drying is 50 mm)
Moisture Distribution Inside the Sample During Impingement Drying
The prepared foam was divided into three parts. The first part was poured into the mould. Then, gauze was placed on the foam, and after that, the second part of the foam was poured into the mould. A second piece of gauze was placed on the second foam layer. After that, the third part of the foam was poured into the mould. Finally, pressing was performed on the mould, until the sample thickness was 25 mm.
Three-layer samples with an initial moisture ratio of approximately 8 kg/kg were dried in an impingement dryer at an air temperature of 150 °C and a jet speed of 50 m/s. Total six samples were prepared and dried for 4, 6, 10, 14, 20, and 26 min. After the specific drying time, every sample was delaminated in three layers with the help of the gauze. Then, the weight of each individual layer was measured, and afterwards each layer was dried in an oven at a temperature of 105 °C to obtain the dry weight. The experimental results related to the moisture distribution within the sample after different drying times are shown in Fig. 14. The scattered data shows the moisture ratio of the different layers. In addition, an average of the moisture ratio of samples during drying is shown. It can be noticed that the top layer dried considerably faster than the bottom layer; when the top layer was completely dry after 26 min, the moisture ratio of the bottom layer was still greater than 1.5 kg/kg.

Fig. 14. Average drying curve (line) and moisture ratio of the top, middle, and bottom layers (dots) after drying
CONCLUSIONS
- The air temperature in impingement drying and the drying power level in infrared and microwave drying have a clear effect on the drying time, i.e., a higher temperature or power level leads to shorter drying times.
- The measured drying rate curves can be divided in three parts: the heating period, the constant drying rate (maximum rate) period, and the falling drying rate period. However, the 5 mm thick samples only had a heating period and a falling rate period.
- The highest drying rate, 150 kg/m2/h, was observed in microwave drying. An intermediate drying rate of 63 kg/m2/h was achieved using impingement drying, and the lowest, 33 kg/m2/h, was achieved with infrared drying. It can be concluded that microwave drying offers opportunities to drastically shorten the drying time for the conditions and samples studied.
- Dark spots can easily appear on the sample surface when using infrared drying and yellow spots can appear when using impingement drying. Samples dried via microwave do not easily change colour if the drying power level is not too high at the end of the drying process, at least when samples have constant positions in the microwave field.
- In infrared drying, the ignition of the sample can happen quite easily. However, when it starts depends on the infrared power, sample moisture content, and sample density. For microwave drying, ignition can also occur at the end of the drying period if too high a drying power level is used.
- For microwave drying, some expansion of the sample can be observed at the beginning of the drying period.
- In one-sided impingement drying, a clear moisture profile in the direction of the thickness of the sample can be observed. When the layer against the impingement unit (top layer) is completely dry, the moisture ratio of the bottom layer was greater than 1.5 kg/kg.
- Different drying technologies have some advantages; however, they can also have certain limitations that may lead to longer drying times, quality degradation, or non-uniformity in the dried products. It should be noted that different power levels between the drying methods were used in these experiments.
ACKNOWLEDGMENTS
The authors are grateful for the support of the Business Finland BeLight-project for the co-funding of the research.
REFERENCES CITED
Bryant, F. (1929). “Distended fibrous material and process of producing the same,” U. S. Patent No. 1740280A.
ISO 5267-2 (2001). “Pulps – Determination of drainability – Part 2: “Canadian Standard” freeness method,” International Organization for Standardization, Geneva, Switzerland.
Cucharero, J., Ceccherini, S., Maloney, T., Lokki, T., and Hänninen, T. (2021). “Sound absorption properties of wood-based pulp fibre foams,” Cellulose 28, 4267-4279. DOI: 10.1007/s10570-021-03774-1
Itaya, Y., Uchiyama, S., Hatano S., and Mori, S. (2004). “Drying enhancement of clay slab by microwave heating,” in: Drying 2004 – Proceedings of the 14th International Drying Symposium (IDS 2004), 22-25 August, Sao Paulo, Brazil, pp.193-200.
Jones, P. L. (1989). “Dielectric-assisted drying and processing,” Power Engineering Journal 3(2), 59-66. DOI: 10.1049/pe:19890009
Kalla, A. M., and Devaraju R. (2017). “Microwave energy and its application in food industry: A review,” Asian Journal of Dairy and Food Research 36(1), 37-44. DOI: 10.18805/ajdfr.v0iOF.7303
Lehmonen, J., Jetsu, P., Kinnunen, K., and Hjelt, T. (2018). “Potential of foam-laid forming technology in paper applications,” Nordic Pulp & Paper Research Journal 28(3), 392-398. DOI: 10.3183/npprj-2013-28-03-p392-398
Li, Z., Raghavan, G. S. V., and Orsat, V. (2010). “Temperature and power control in microwave drying,” Journal of Food Engineering 97(4), 478-483. DOI: 10.1016/j.jfoodeng.2009.11.004
Milosavljevic, N., and Juppi, K. (2010). “Air impingement drying,” in: Papermaking Part 2, Drying, M. Karlsson (ed.), TAPPI Press, Atlanta, GA, pp. 128-160.
Mujumdar, A. (1987). “Impingement drying,” in: Handbook of Industrial Drying, A. S. Mujumdar (ed.), Marcel Dekker, New York, NY, pp. 461-474.
Pääkkönen, E., Pöhler, T., Jetsu, P., Kiiskinen, H., Lehmonen, J., Timofeev, O., and Torvinen, K. (2016). “New light-weight foam formed products,” in: Proceedings of the 5th International Symposium on Emerging Technologies of Pulping and Papermaking & 3rd International Papermaking and Environment Conference, 5th ISETPP & 3rd IPEC, 7-9 November, Guangzhou, China, pp. 116
Pöhler, T., Jetsu, P., and Isomoisio, H. (2016). “Benchmarking new wood fibre-based sound absorbing material made with a foam-forming technique,” Building Acoustics 23(3-4), 131-143. DOI: 10.1177/1351010X16661564
Pöhler, T., Jetsu, P., Fougerón, A., and Barraud, V. (2018). “Use of papermaking pulps in foam-formed thermal insulation materials,” Nordic Pulp and Paper Research Journal 32(3), 367-374. DOI: 10.3183/npprj-2017-32-03-p367-374
Qin, C, Yao, M, Liu, Y, Yang, Y, Zong, Y, and Zhao, H. (2020). “MFC/NFC-based foam/aerogel for production of porous materials: Preparation, properties and applications,” Materials 13(23), 1-21. DOI: 10.3390/ma13235568
Radvan, B., and Gatward, A. (1972). “The formation of wet-laid webs by a foaming process. TAPPI Journal 55(5), 748-751.
Ratti, C., and Mujumdar, A. (2006). “Infrared drying,” in: Handbook of Industrial Drying, A. S. Mujumdar (ed.), Taylor & Francis, Oxfordshire, United Kingdom, pp. 423-438.
Sakare, P., Prasad, N., Thombare, N., Singh, R., and Sharma, S. C. (2020). “Infrared drying of food materials: Recent advances,” Food Engineering Reviews 12, 381-398. DOI: 10.1007/s12393-020-09237-w
Schiffmann, R. (1987). “Microwave and dielectric drying,” in: Handbook of Industrial Drying, A. S. Mujumdar (ed.), Marcel Dekker, New York, NY, pp. 327-356.
Smith, M. K. and Punton, V. W. (1975). “Foam can improve formation,” Pulp & Paper Canada 76(1), 55-58.
Smith, M., and Punton, V. (1974). “Structure and properties of paper formed by a foaming process,” TAPPI Journal 57(1), 107-111.
Stenström, S. (2019). “Drying of paper: A review 2000-2018,” Drying Technology 38(7), 825-845. DOI: 10.1080/07373937.2019.1596949
Timofeev, O. N., Jetsu, P., Kiiskinen, H. T., and Keränen, J. T. (2016). “Drying of foam-formed mats from virgin pine fibers,” Drying Technology 34(10), 1210-1218. DOI: 10.1080/07373937.2015.1103254
Tsotsas, E., and Mujumdar, A. S. (2011). Modern Drying Technology Volume 4: Energy Savings, Wiley, Hoboken, NJ.
United Nations (2021). “The 17 goals,” (https://sdgs.un.org/goals), Accessed 9 September 2021.
Article submitted: November 2, 2021; Peer review completed: February 20, 2022; Revised version received and accepted: March 10, 2022; Published: March 15, 2022.
DOI: 10.15376/biores.17.2.2547-2562