
Abstract
The acetic acid pretreatment of wood chips has become one of the most promising technologies for biorefinery. This study aimed to provide a quantitative evaluation of the porosity variation during pretreatment based on the fractal dimension methodology. The acacia wood sample was pretreated by acetic acid under different temperatures (140 °C to 170 °C), followed by a three-stage disc-refining at high consistency, and was subsequently characterized by the low-temperature nitrogen adsorption method. The detailed data related to the fractal dimension were obtained by two well-established methods, namely, the Yu Boming (YBM) fractal and Frenkel Halsey Hill (FHH) fractal method. Both the acetic acid pretreatment and disc refining resulted in a higher fractal dimension, which indicated increased irregularity of the pore structure. The mechanism behind the temperature’s effect, where the higher temperature led to a lower fractal dimension, was also explored. Compared to the FHH dimension, the fitting range of the YBM dimension was wider and it had a lower correlation coefficient.
Download PDF
Full Article
Effect of Acetic Acid Pretreatment on Wood Pore Structure and Fractal Dimension
Congcong Chi,a,b,c,* Zhenzhen Hui,a Mi Liu,d Sufeng Zhang,a and Yahui Gong e
The acetic acid pretreatment of wood chips has become one of the most promising technologies for biorefinery. This study aimed to provide a quantitative evaluation of the porosity variation during pretreatment based on the fractal dimension methodology. The acacia wood sample was pretreated by acetic acid under different temperatures (140 °C to 170 °C), followed by a three-stage disc-refining at high consistency, and was subsequently characterized by the low-temperature nitrogen adsorption method. The detailed data related to the fractal dimension were obtained by two well-established methods, namely, the Yu Boming (YBM) fractal and Frenkel Halsey Hill (FHH) fractal method. Both the acetic acid pretreatment and disc refining resulted in a higher fractal dimension, which indicated increased irregularity of the pore structure. The mechanism behind the temperature’s effect, where the higher temperature led to a lower fractal dimension, was also explored. Compared to the FHH dimension, the fitting range of the YBM dimension was wider and it had a lower correlation coefficient.
Keywords: Acacia; Acetic acid pretreatment; Nitrogen adsorption method; Porous structure; Fractal dimension
Contact information: a: Shaanxi Key Lab of Papermaking Technology & Specialty Paper, College of Bioresources Chemical and Materials Engineering, Shaanxi University of Science & Technology, Xi’an, 710021, China; b: Key Laboratory of Pulp and Paper Science & Technology of Ministry of Education of China, Qilu University of Technology, Jinan, 250353, China; c: State Key Laboratory of Pulp and Paper Engineering, South China University of Technology, Guangzhou, 510640, China; d: Fisher International, Guangzhou, 510600, China; e: Zhongxing Telecommunication Equipment Corporation, Xi’an, 710065, China; *Corresponding author: congcongchi@163.com
INTRODUCTION
Lignocellulosic biomass is one of the most promising raw materials for biofuel ethanol, and it has attracted attention because of its reproducibility and lower risk for pollution (Kadam and McMillian 2003). The fuel ethanol bioconversion mainly includes the following steps: pretreatment, enzymatic saccharification, and the steps associated with fermentation (Lee 1997). However, due to the biorecalcitrance of lignocelluloses and the high crystallinity of cellulose, it is highly resistant to biological and chemical degradation. To enhance the enzymatic hydrolysis efficiency, certain pretreatment is needed to produce irregular pores that improve its enzyme accessibility (Yang et al. 2001; Pedersen et al. 2010). Of course, there are pores in the original lignocelluloses (Maloney and Paulapuro 1999; Topgaard and Soderman 2002); thus biomass subjected to candidate pretreatments can be characterized by the methods used to characterize porous materials.
In the 1970s, Mandelbrot created fractal theory to quantitatively describe complex but regular geometric phenomenon in nature, such as graphics and processes. Fractal theory revealed the uniformity between certainty and randomness and between order and disorder in nonlinear systems, which provides an effective means for understanding and analyzing complex issues (Mandelbrot 1977, 1982; Mandelbrot et al. 1984). Currently, the fractal approach has been widely used in the field of porous materials, which can be described by the fractal dimension (D). Different from that in the Euclidean geometry (Li and Cheng 1990), the dimension of fractal space is not just restricted to integral values. Higher values of the fractal dimension are related to more complex structures, and lower values of the dimension, conversely, to the simple structures.
There are many methods for the fractal characterization of porous materials, such as nitrogen adsorption (Qi et al. 2002), mercury intrusion porosimetry (Smith et al. 1990), small angle X-ray scattering (Malekani et al. 1996), digital image analysis (Raynaud et al. 1989; Peng et al. 2011), and so on, of which the nitrogen adsorption method is most widely used. This is mainly owing to the success of the BET (Brunauer Emmet Teller) multi-layer adsorption theory on pore analysis. The fractal dimension can be obtained using the relationship between adsorption capacity and relative pressure, or the relationship between cumulative pore volume fraction and pore size (Hao and Avramidis 2001).
In this paper, acacia chips were pretreated by acetic acid at different temperatures. The microstructure and pore structure were studied using a scanning electron microscope and using the nitrogen adsorption method; then, the fractal dimension was calculated using the Frenkel Halsey Hill (FHH) and Yu Boming (YBM) models. The relationship between the fractal dimension and pretreatment temperature was evaluated, and the calculation results by the two methods were compared. This research will be of guiding significance for building fractal structure models in future work.
EXPERIMENTAL
Materials and Apparatus
Acacia samples were obtained from a pulp and paper mill in Rizhao, China. The accepted chips, with an average size of 20 mm x 10 mm x 5 mm, were air-dried for further use. All of the chemicals used in the experiments were analytical reagents, provided by Fuyu Chemical Co. Ltd., in Tianjin, China.
Acetic Acid Pretreatment
The acetic acid pretreatment was performed in an electric heating digester (ZQS1) equipped with four jars. Then, 150 grams of chips were used for each experiment, and they were soaked in tap water overnight before pretreatment. The pretreatment conditions were as follows: heating rate 2.5 °C/min, time at temperature 1 h, maximum temperature 140 °C, 150 °C, 160 °C, and 170 °C, solid to liquid ratio 1:4 (g/mL), and acetic acid dosage 5% (5 mL/100 g of original oven-dried wood). After pretreatment, several pieces of chips were fully soaked and washed with tap water, then air-dried and saved for further analysis. Others were adequately refined in a micro plant-grinding machine (FZ102, Machinery Factory of Shaanxi University of Science and Technology, Xianyang, China), then freeze-dried for pore structure analysis. The remaining pre-treated chips were refined by a high consistency refiner (PMG-Ø300, Jilin Paper Machinery Factory, Jilin, China) in three stages, with a gap of 0.4 mm to 0.1 mm to 0.05 mm in turn.
Scanning Electron Microscopy (SEM)
The surface morphology of the wood before and after pretreatment was analyzed by SEM (TESCAN VEGA 3 SBH, TESCAN, Brno, Czech Republic). Chips were cut into similar sizes of 1 cm × 0.5 cm, then fixed on the sample platform by a conducting resin, and finally coated with a thin layer of gold by a vacuum sputter (MSP-2S, IXRF, Austin, TX, USA). This assembly was kept in a vacuum desiccator until the analysis. Sample images were taken at a 10 kV acceleration voltage with magnification ranging from 500x to 10000x.
Pore Structure Analysis
The physical characteristics of samples, including pore size and distribution, surface area, and pore volume were measured by the N2(g) adsorption method (Gemini VII2390 surface area and porosity analyzer, Micromeritrics Inc., USA) at 77 K with liquid N2. The minimum specific surface area was 0.0001 m2/g without an upper limit, while the pore size ranged from 0.35 nm to 500.00 nm. Approximately 0.2 g to 0.3 g of the sample was placed into a standard tube after being freeze-dried. The pure N2 acted as an adsorption medium, while the pure He served as a carrier gas. The isotherms were measured for the relative pressure (P/P0) ranging from 0.01 to 0.99. The N2 adsorption isotherms were used to measure the specific surface area and pore volume based on the BET method. The pore size distribution was calculated in accordance with the Barrett Joiner Halenda (BJH) method.
Fractal Dimension Calculation
There are many methods for determining the fractal dimension of pore materials, such as the particle dimension method, the BET model, the FHH model, and the thermodynamics method, among which the FHH model has been most widely used due to the simpler calculation involved. The exact model, which was initially put forward by Frenkel, Halsey, and Hill, aims at describing the multilayer adsorption theory of gas in a porous medium. When the model was applied to study adsorption on a heterogeneous surface, dimension was introduced, and the gas adsorption model of the fractal surface in the capillary agglomeration area, namely, the FHH model, was developed (Avnir and Jaroniec 1989). Based on the capillary agglomeration adsorption, Yin established the rationality by the Kelvin formula (Yin 1991), which is manifested by Eq. (1),
![]() (1)
(1)
where V is the gas adsorption capacity (mL), p is the equilibrium pressure (kPa), P0 is the saturated vapor pressure of adsorbed gas (kPa), C is the constant, and D is the fractal dimension (2 < D < 3). Generally speaking, a higher dimension is related to rougher surfaces and more complex structures.
The lnV-ln[ln(p0/p)] scatter diagrams were drawn based on the N2 adsorption data. Then linear fitting was done in a certain range, and the fractal dimension could be obtained from the slope of the fitted straight line. Moreover, the dimension could also be obtained by the functional relationship between pore size and distribution. Equation 2, put forward by Boming Yu (Yu 2003), provided the method for judging whether a porous medium could be analyzed by fractal theory,
![]() (2)
(2)
where λmin and λmax are the minimum and maximum values of pore diameter (nm) and D is the fractal dimension.
The pore distribution of the porous medium should meet the scaling invariance in a certain range, and D ranged from 2 to 3. Based on the above, Guo et al. (2009) deduced Eq. 3 to solve for the dimension,
![]() (3)
(3)
where S is the cumulative pore volume fraction for the pore diameter smaller than r, D is the fractal dimension, r is the pore diameter (nm), and C is the constant.
LnS could be gained according to the data on pore volume and diameter. Then, the lnr-lnS linear fitting was conducted in a range that met the conditions in Eq. 2. Eventually, the dimension could be obtained from the straight slope.
RESULTS AND DISCUSSION
Effects of Pretreatment on Wood Microstructure
The micromorphology of wood before and after pretreatment was analyzed using SEM. As is shown in Fig. 1, the original wood exhibited an integrated structure and compact array, and its surface looked smoother (Fig. 1a and 1b). During the acetic acid pretreatment, the hemicelluloses and low molecular weight of lignin were partially degraded and dissolved into the liquor, which broke down the wood ultrastructure (Chi et al. 2014).
As can be seen from Fig. 1c through 1f, after pretreatment and refining, the sample surface was disintegrated by a large amount of collapse and cracking, and many new pores were produced. This enhanced the accessibility of cellulose by means of increasing the specific surface area of the substrates, which ultimately improved the enzymatic saccharification efficiency.
Comparing the SEM images under different temperatures, it was apparent that there were more regular spherical particles deposited onto the surface at higher temperatures. This was possibly due to the partial degradation of the low molecular weight lignin and the lignin-carbohydrate-complex (LCC) under acetic conditions at high temperatures (Gu and Xie 2001; Donohoe et al. 2008). All of the aforementioned phenomena revealed that the wood was destroyed after the acetic acid pretreatment.
Pore Structure of Wood and Pulp Samples
The pore size and distribution are important parameters of porous materials that have a significant effect on the properties of these materials. The surface area and porosity analyzer was used for analyzing the pore structure of wood sawdust (40-mesh to 60-mesh) and pulp samples, and the results are shown in Tables 1 and 2.
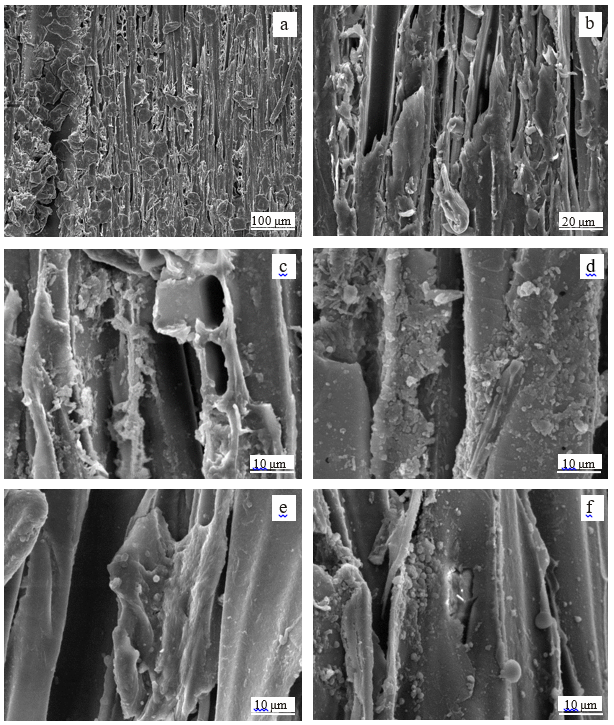
Fig. 1. SEM images of wood before and after pretreatment (note: a and b are the original wood samples; c, d, e and f are pulps from acetic acid pretreatment at temperatures of 140 °C, 150 °C, 160 °C and 170 °C. Other conditions were kept the same: acetic acid dosage 5% (based on original wood), solid to liquid ratio 1:4 (g/mL), time at temperature 1 h)
Table 1. Parameters of Pore Structure
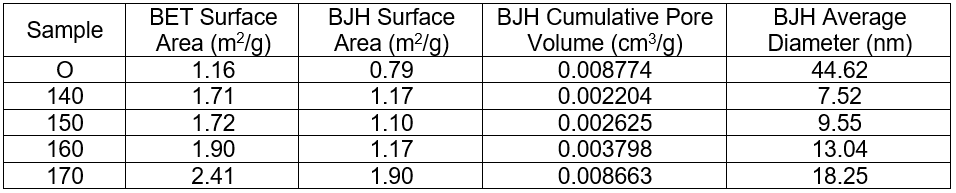
Note: O is the original wood sample; 140, 150, 160 and 170 are pulps from acetic acid pretreat-ment at temperatures of 140 °C, 150 °C, 160 °C and 170 °C; This applies to Table 2 as well.
Table 2. Pore Size Distribution
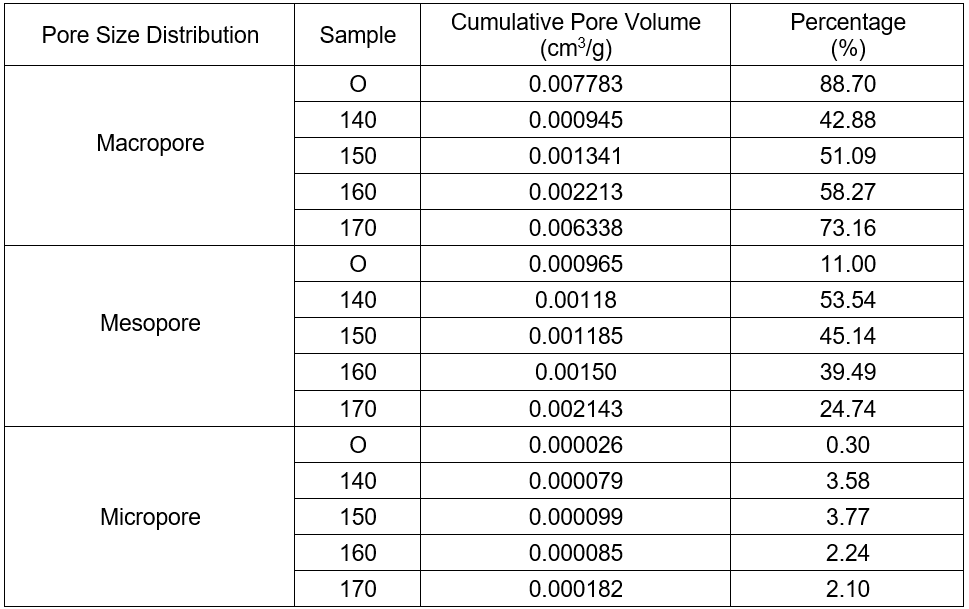
Note: Percentage (%) = Total cumulative pore volume in a certain range / Total cumulative pore volume
Table 1 reveals that both the BET and BJH surface areas increased after the acetic acid pretreatment and refining, while the BJH cumulative pore volume and BJH average diameter decreased. A larger surface area was found for higher temperatures, which was good for enhancing the enzyme accessibility of cellulose and resulted in improved hydrolysis efficiency. Furthermore, the cumulative pore volume and average diameter increased with increased temperature.
According to the definition of IUPAC (International Union of Pure and Applied Chemistry), porous materials are divided into three different types: micropores (< 2.0 nm), mesopores (2.0 nm to 50.0 nm), and macropores (> 50.0 nm). Table 2 shows that after pretreatment and refining, the percentage of macropores decreased, while the percentage of mesopores and micropores increased. This demonstrated that new mesopores and micropores were produced on the surface, but not enough to form macropores. This was possibly caused by the degradation of hemicelluloses and the dissolution of the low molecular-weight lignin, while just a small amount was dissolved. Table 2 shows that the percentage of macropores increased with increased temperature, but the percentage decreased for mesopores and micropores. This may have been caused by the collapse that integrated the pore canal of the mesopores with the micropores to form macropores.
Effect of Temperature on the FHH Dimension
The fractal dimensions were calculated based on the FHH model. The lnV-ln(ln(p0/p)) curves were drawn according to the pore structure parameters and the N2 adsorption curve. Then, the effect of temperature on the fractal properties was studied. The results are shown in Fig. 2.
Based on the fitted curves in Fig. 2, the dimension D of the different samples could be calculated using Eq. 1. Table 3 shows that the FHH dimension of all samples varied from 2 to 3, and the linear correlation coefficient of the lnV-ln(ln(p0/p) curves were in the range of 0.9734 to 0.9973. Thus, within a certain range (mainly for the mesopores), all of the eucalyptus samples possessed good fractal characteristics.
Table 3. FHH Fractal Dimension of Samples
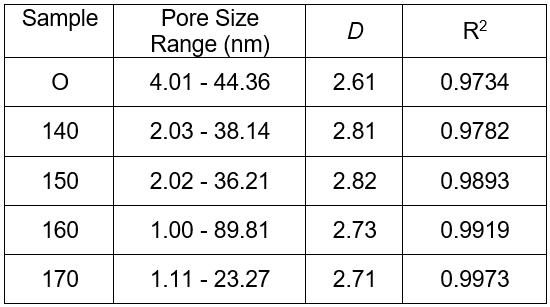
In general, the higher the fractal dimension was, the rougher the structure was, and vice versa (Guo et al. 2009). Table 3 also shows that the dimensions of the five different samples varied from 2.61 to 2.82, which indicated that the structure was between smooth and extremely rough. Compared to the original wood, the dimensions of the pretreated samples were higher.
After pretreatment and refining, the pulps became rougher and loose. This was due to the partial destruction of the crystal structure under acetic conditions, where the hemicelluloses were partially hydrolyzed into monosaccharides to form a porous structure. This was helpful for increasing the contact area between the substrates and cellulases, which resulted in improved enzymatic hydrolysis efficiency. Furthermore, a lower fractal dimension was shown for higher temperatures, which indicated the rougher and complex structure of pulps from the acetic acid pretreatment at lower temperatures.
Effect of Temperature on the YBM Dimension
The results showed that the rmin/rmax of both the wood and pulp samples was very small, so that (rmin/rmax)D=0 could be regarded as reasonable. This result was in accordance with the judgment of the YBM dimension.
The pore volume and diameter were determined by the specific surface area analyzer, and then the values of lnr and lnS were calculated. If a linear relationship between lnS and lnr was shown in a certain range, and the slope was 3-D (2 < D < 3), then the samples could be considered to have the characteristics of a fractal structure. The lnS-lnr plots of different samples are shown in Fig. 3.
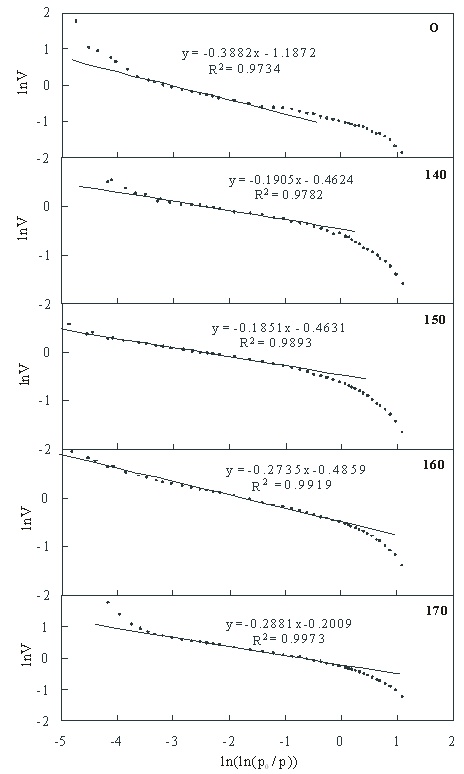
Fig. 2. FHH analysis for fractal structure of eucalyptus before and after pretreatment
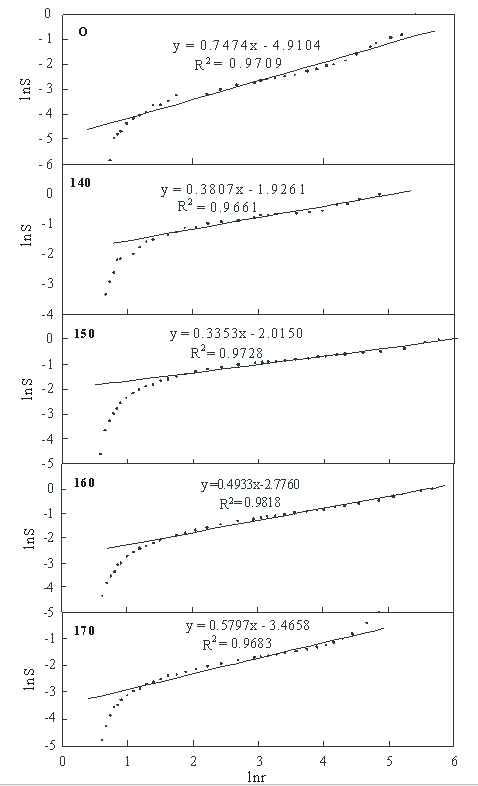
Fig. 3. lnS-lnr plots of eucalyptus wood and pulp samples
The YBM dimensions were calculated and listed in Table 4. The results showed that the dimension of the five different samples varied from 2.25 to 2.66, and that the dimension of all the pulps was higher than that of wood. This demonstrated that the acetic acid pretreatment and refining led to more irregular pore structure.
Table 4. YBM Fractal Dimension of Samples
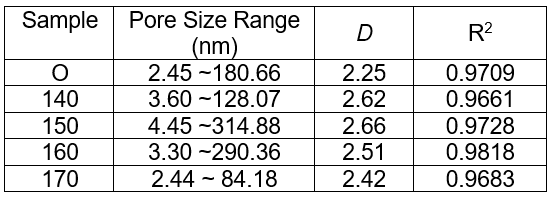
Combining the results in Table 2 and Table 4, it could be inferred that the greater number of micropores in the porous materials contributed to the greater irregularity and roughness of the pore structure. This resulted in a higher fractal dimension, which was consistent with the conclusion of Jin et al. (2011). Furthermore, the smaller average diameter led to a higher fractal dimension, as seen by comparing the data in Table 1 and Table 4.
According to the comprehensive comparison between the FHH and YBM dimensions, both of them varied from 2 to 3, but the former was higher than the latter. The two methods showed similar variations of dimension with temperature; that is, the higher temperatures were associated with the smaller dimensions. Significant differences in the fitting range of the pore size were shown between the two methods. The fitting range of the FHH dimension focused on the mesopores, while the YBM dimension covered both the mesopores and the macropores. The fitting range of the latter was wider, which led to a lower linear coefficient of determination. The FHH model was widely used due to its more specific theoretical basis and higher degree of fit.
Contribution of Refining to FHH Dimension
Before enzymatic hydrolysis, the eucalyptus chips were pretreated by acetic acid and refined in three stages by the high-consistency refiner. To explore the refining process effect on the fractal dimension of the enzymatic substrate, the pore structures of both the wood and pulps after pretreatment were analyzed. The fractal dimension was calculated based on the FHH method, and the difference between the pulps and the wood was the contribution of the refining process to the fractal dimension. The results are shown in Fig. 4. As can be seen in Fig. 4, the FHH dimension of both wood and pulps decreased with the increased temperature. This indicated that the porous structure of both wood and pulps after pretreatment at a lower temperature was more complex and irregular, which agreed with the SEM results. Compared to the temperature of 140 °C, the fractal dimension of the samples pretreated at 150 °C was noticeably decreased, while the dimension decreased little from 150 °C to 160 °C and 170 °C. As a whole, the refining process contributed a lot to the fractal dimension, and this was more obvious for the lower temperatures. The fractal dimension increased 3.45% and 6.13% at 140 °C and 150 °C, respectively, while it increased 1.92% and 2.68% at 160 °C and 170 °C, respectively.
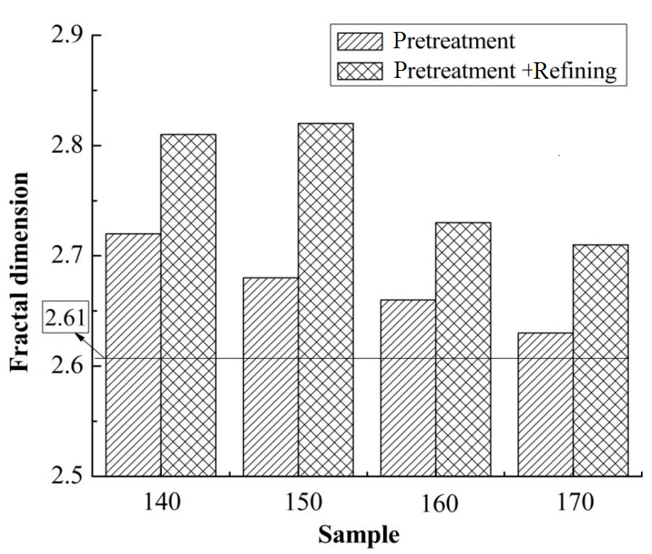
Fig. 4. Contribution of refining to the FHH fractal dimension (Note: the horizontal line refers to the FHH fractal dimension of the original wood sawdust)
CONCLUSIONS
- The fractal dimension methodology could be used effectively for characterizing the porous structure of lignocelluloses.
- The acetic acid pretreatment was helpful for reducing wood biorecalcitrance, and more specifically, for generating more and different kinds of pores, which was critical for the subsequent enzymatic hydrolysis.
- A higher surface area, lower cumulative pore volume, and average diameter were shown after pretreatment and refining, and this was more effective at higher temperatures.
- Both the acetic acid pretreatment and refining contributed to a higher fractal dimension, and this effect was more noticeable at lower temperatures.
- The fitting ranges of FHH and YBM dimensions were different: the former focused on mesopores, with D varying from 2.61 to 2.82, while the latter covered both mesopores and macropores, with D varying from 2.25 to 2.66.
ACKNOWLEDGEMENTS
The authors are grateful for the financial support from the National Natural Science Foundation of China (31600476), Shaanxi Provincial Natural Science Foundation Research Project (2015JQ3077), and the State Key Laboratory of Pulp and Paper Engineering at South China University of Technology (201603).
REFERENCES CITED
Avnir, D., and Jaroniec, M. (1989). “An isotherm equation for adsorption on fractal surfaces of heterogeneous porous materials,” Langmuir 5(6), 1431-1433.
Chi, C., Liu, M., Jameel, H., Zhang, S., and Zhang, Z. (2014). “Hydrothermal
pretreatment of hardwood chips prior to alkaline pulping and D0(EP)D1 bleaching,” BioResources 9(4), 6193-6204. DOI: 10.15376/biores.9.4.6193-6204
Donohoe, B. S., Decker, S. R., Tucker, M. P., Himmel, M. E., and Vinzant, T. B. (2008). “Visualizing lignin coalescence and migration through maize cell walls following thermochemical pretreatment,” Biotechnology and Bioengineering 101(5), 913-925. DOI: 10.1002/bit.21959
Gu, R., and Xie, Y. (2001). “Studies on lignin and carbohydrate complex of monolignols,” Paper Science & Technology 20(5), 1-6.
Guo, W., Wan, J., Ma, Y., and Wang, Y. (2009). “Fractal analysis of pore structure of eucalyptus pulp fibers,” Journal of South China University of Technology: Natural Science Edition 37(12), 70-74.
Hao, B., and Avramidis, S. (2001). “Wood sorption fractality in the hygroscopic range. Part 1. Evaluation of a modified classic BET model,” Wood and Fiber 33(1), 119-125.
Jin, S., Zhang, J., Chen, C., and Chen, W. (2011). “Study of pore fractal characteristic of cement mortar,” Journal of Building Materials 14(1), 92-97.
Kadam, K. L., and McMillian, J. D. (2003). “Availability of corn stover as a sustainable feedstock for bioethanol production,” Bioresource Technology 88(1), 17-25. DOI: 10.1016/S0960-8524(02)00269-9
Lee, J. (1997). “Biological conversion of lignocellulosic biomass to ethanol,” Journal of Biotechnology 56(1), 1-24. DOI: 10.1016/S0168-1656(97)00073-4
Li, H., and Cheng, G. (1990). Fractal and Fractal Dimensions, Sichuan Education Press, Chengdu, Sichuan, China.
Malekani, K., Rice, J., and Lin, J. S. (1996). “Comparison of techniques for determining the fractal dimensions of clay minerals,” Clays and Clay Minerals 44(5), 667-685.
Maloney, T. C., and Paulapuro, H. (1999). “The formation of pores in the cell wall,” Journal of Pulp and Paper Science 25(12), 430-436. DOI: 10.1093/aob/mcp255
Mandelbrot, B. B. (1977). Fractal: Form, Chance, and Dimension, Freeman, W. H. and Co., San Francisco, CA, USA.
Mandelbrot, B. B. (1982). The Fractal Geometry of Nature, Freeman W. H. and Co., San Francisco, CA, USA.
Mandelbrot, B. B., Passoja, D. E., and Paullay, A. J. (1984). “Fractal character of fracture surfaces of metals,” Nature 308, 721-722. DOI: 10.1038/308721a0
Pedersen, M., Nielsen, A. V., and Meyer, A. S. (2010). “Monosaccharide yields and lignin removal from wheat straw in response to catalyst type and pH during mild thermal pretreatment,” Process Biochemistry 45(7), 1181-1186. DOI: 10.1016/j.procbio.2010.03.020
Peng, R. D., Yang, Y. C., and Ju, Y. (2011). “Computation of fractal dimension of rock pores based on gray CT images,” Chinese Science Bulletin 56(31), 3346-3357. DOI: 10.1007/s11434-011-4683-9
Qi, H., Ma, J., and Wong, P. Z. (2002). “Adsorption isotherms of fractal surfaces,” Colloids and Surfaces A: Physicochemical and Engineering Aspects 206(1-3), 401-407.
Raynaud, S., Fabre, D., and Mazerolle, F. (1989). “Analysis of the internal structure of rocks and characterization of mechanical deformation by a non-destructive method: X-ray tomodensitometry,” Tectonophysics 159(1-2), 149-159.
Smith, D. M., Johnston, G. P., and Hurd, A. J. (1990). “Structural studies of vapor-phase aggregates via mercury porosimetry,” Journal of Colloid and Interface Science 135(1), 227-237.
Topgaard, D., and Soderman, O. (2002). “Changes of cellulose fiber wall structure during drying investigated using NMR self-diffusion and relaxation experiments,” Cellulose 9(2), 139-147.
Yang, X., Chen, H., Gao, H., and Li, Z. (2001). “Bioconversion of corn straw by coupling ensiling and solid state fermentation,” Bioresource Technology 78(3), 277-280. DOI: 10.1016/S0960-8524(01)00024-4
Yin, Y. (1991). “Adsorption isotherm on fractally porous materials,” Langmuir 7(2), 216-217.
Yu, B. (2003). “Advances of fractal analysis of transport properties for porous media,” Advances in Mechanics 33(3), 333-346.
Article submitted: December 27, 2016; Peer review completed: March 13, 2017; Revised version received and accepted: March 22, 2017; Published: April 13, 2017.
DOI: 10.15376/biores.12.2.3905-3917