
Abstract
Mechanical properties of wood composites made from multiple wood species (50% Crimean pine, 30% Eastern Black Sea oak, 15% quaking aspen, and 5% wood machining residues) were evaluated using various amount of glass wool (GW) and stone wool (SW) additives. A total of 70 experimental panels were produced with a target density of 640 kg/m3. The bending strength, modulus of elasticity, tensile strength parallel to the surface of boards, tensile strength perpendicular to the surface of boards (internal bond), and cutting (shear) strength parallel to the surface of boards were determined. After statistical analysis, the results indicated that the SW and GW additives decreased the bending strength and modulus of elasticity by 49% in almost all boards. The addition of SW resulted in a 6% reduction in the tensile strength parallel to the surface. Relative to SW, GW resulted in an additional 8% reduction in shear strength, a 3% reduction in the screw tensile strength perpendicular to the surface, and a 6% reduction in the tensile strength parallel to the surface. Thus, the SW and GW additives decreased all the selected mechanical properties of wood composites.
Download PDF
Full Article
Effect of Glass Wool and Stone Wool Additives on Some Mechanical Properties of Wood Composites
Onur Ülker a,* and Erol Burdurlu b
Mechanical properties of wood composites made from multiple wood species (50% Crimean pine, 30% Eastern Black Sea oak, 15% quaking aspen, and 5% wood machining residues) were evaluated using various amount of glass wool (GW) and stone wool (SW) additives. A total of 70 experimental panels were produced with a target density of 640 kg/m3. The bending strength, modulus of elasticity, tensile strength parallel to the surface of boards, tensile strength perpendicular to the surface of boards (internal bond), and cutting (shear) strength parallel to the surface of boards were determined. After statistical analysis, the results indicated that the SW and GW additives decreased the bending strength and modulus of elasticity by 49% in almost all boards. The addition of SW resulted in a 6% reduction in the tensile strength parallel to the surface. Relative to SW, GW resulted in an additional 8% reduction in shear strength, a 3% reduction in the screw tensile strength perpendicular to the surface, and a 6% reduction in the tensile strength parallel to the surface. Thus, the SW and GW additives decreased all the selected mechanical properties of wood composites.
Keywords: Hybrid composites; Stone wool; Glass wool; Wood composite; Mechanical Properties
Contact information: a: Department of Interior Architecture and Environment Design, Kırıkkale University, 71450, Kırıkkale, Turkey; b: Department of Wood Products Industrial Engineering, Gazi University, 06500, Ankara, Turkey; * Corresponding author: ulker79o@hotmail.com
INTRODUCTION
Particleboard panels are commonly used composite products that are composed of lignocellulosic materials such as wood, flax, hemp, jute, or sugar cane and adhesives that bind the wood under pressure and temperature. (Burdurlu 1994; Alıcı 2004, TS EN 2008). Non-wood lignocellulosic raw materials are in great demand due to the shortage of wood and the need for more sustainable resources in the composite industry.
Particleboards made from plant wastes have a bending strength of about 11.4 N/mm2 and a tensile strength perpendicular to the surface of about 0.1 N/mm2 (Örs and Kalaycıoğlu 1991; Kalaycıoğlu and Örs 1993; Kalaycıoğlu and Nemli 1997). Pablo et al. (1975) found that particleboards produced from banana stalks and 10% urea formaldehyde (UF) adhesive were stronger in terms of physical and mechanical properties than high-density standard particleboards (Guler and Ozen 2004). The resistance properties of 16-mm-thick particleboards produced with 92% corn stalks, 7% UF resin, and 1% paraffin at a density of 0.74 g/cm3 were similar to standard particleboards (Chow 1974; Guler and Ozen 2004).
The mechanical properties of particleboards are affected by the ratio of binder, pressing temperature, pressing time, and particle measurements. Particleboards made from almond shells and UF have high values for hardness (97.5 N/cm²) and bending strength (84.52 N/cm²). These high values were achieved with a 0.97% binder ratio, 70 °C pressing temperature, 25-min pressing time, and 1- to 3-mm thick particles (Guru et al. 2006). The bending and internal bonding strength of particleboards produced from hazelnut shells and three different binders with densities of 0.6 g/cm3 and 0.7 g/cm3 were within standard limits (Copur et al. 2007). The resistance properties of particleboards are greatly affected by wood defects and the inclusion of bark (Nemli et al. 2004).
To date, there have been no studies of particleboards made with mineral wool fillers. The objective of this study was to determine the effects of two kinds of mineral wool and two binders on some of the mechanical properties of particleboard. The densities of Stone wool (SW) and glass wool (GW) are less than wood particles, producing particleboard with mineral wools provides lighter boards compare to standard particleboards. Stone wool (SW) and glass wool (GW) were used as additive materials in the ratios of 10%, 15%, or 20%, and 10% UF and MF were used as binders.
EXPERIMENTAL
Materials
Wood particles
Wood particles with a moisture content of 1.5% to 3% were supplied by the Integrated Factory of Wooden Boards (Kastamonu, Turkey). The particles were derived from 50% Crimean pine (Pinus nigra), 30% Eastern Black Sea oak (Quercus pontica), 15% quaking aspen (Populus tremula), and 5% residues from wood machining. The particles contained no bark.
The particle thickness ranged from 0.3 mm to 0.5 mm, the width from 2.1 mm to 3.85 mm, and the length from 2.1 mm to 10.45 mm.
Urea formaldehyde (UF) and melamine formaldehyde (MF) binders
Urea formaldehyde had a density of 1.24 g/cm3 at 20 °C, pH value 8.1, viscosity of 170 centipoises (cPs), and 55% solid material. Melamine formaldehyde had a density of 1.22 g/cm3 at 20 °C, pH 9.0, viscosity of 150 cPs, and 54% solid material.
Glass wool (GW) and stone wool (SW)
GW and SW were used as additives in particle boards (PBs). GW had the following properties: heat conductivity resistance, 0.045 W/mK; heat conduction coefficient, 0.028 kcal/mh °C at 0 °C; heat conduction coefficient, 0.065 kcal/mh °C at 450 °C; fiber diameter interval, 3 to 40 µm; and specific heat, 0.19 kcal/kg °C. SW properties were as follows: heat conductivity resistance, 0.039 W/mK; heat conduction coefficient, 0.039 kcal/mh °C at 10 °C; and density, 150 kg/m³.
Methods
Automatic laboratory press
A Hursan T100 automatic laboratory press (Konya, Turkey) was used to compress the wood mat under heat and pressure. The press plates were 60 cm2 by 60 cm2. The temperature interval was 0 °C to 250 °C, and the pressure capacity was 250 bars. The 5-ton Elisa brand universal mechanical testing machine, Ankara, Turkey was used for mechanical tests.
Preparation of the specimens
The target density of 0.64 g/cm3 was based on the density of particleboards on the market. With a 50 cm2 × 50 cm2 pressing area and a 1.6 cm-thick particleboard, the total mixture of particles, additive material, and adhesive was 2.560 g. The amount of adhesive (10%; 256 g) was selected based on previously reported values. The amount of particles was decreased in accordance with the ratio of additive.
The SW and GW were pressed at 150 °C under a pressure of 30 kg/cm2 for 10 min to form fibers. Subsequently, the fibers were processed with a mixer for 15 min. The particles and additives were weighed to an accuracy of 0.01 g and mixed manually in the ratios of 10%, 15%, and 20% additives (w/w) until the mixture was homogenized. The UF or MF adhesives were added to the mixture with a spray gun.
The mats were spread on a steel plate that was brushed with petroleum jelly to prevent surface bonding and that contained a 50 cm2 × 50 cm2 template. The draft specimens were formed by smoothing the surface, after which, the template was removed. Petroleum jelly was spread on a single side of the upper surface, and the draft specimen was placed on the steel plate.
The mat between the two steel plates was placed in a hot press and heated to a temperature of 150 ± 5 °C. Compression continued until the moving upper surface came in contact with the non-moving piece that determined the 16-mm PB thickness. At this point, the compression pressure was 25 kg/cm2. Compression was applied for 18 min for all PBs. PBs were removed from the press and adapted to the surrounding climate by storage in a single layer (not stacked) in a closed environment. PBs were next cut to final dimensions of 45 cm × 45 cm, including a 25-mm cutout from each corner. The PBs were sanded in a Melkuc brand calibrating machine (Ankara, Turkey) with a 180-grit sander to reach a net thickness of 14 mm.
Mechanical Tests
The bending strength, or modulus of rupture (MOR), and the modulus of elasticity (MOE) values of the specimens were determined according to the TS 2474 standard (1976). The test specimens were simply supported and applied with a concentrated load. The load and the deflection were observed with a universal mechanical test machine until failure occurred.
The bending test system is shown in Fig. 1. Beam span (Ls) was 280 mm. Sample size was 14 mm x 50 mm (h x b).
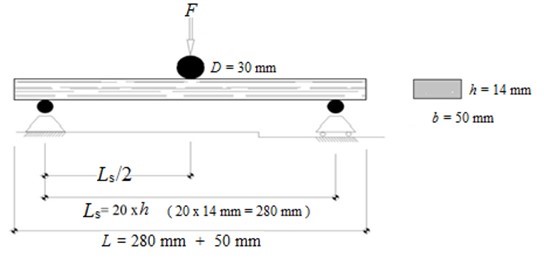
Fig. 1. Experiment of bending test system
Equations 1 and 2 were used to calculate the MOE and MOR,
MOE (N/mm2) = (P × L3) / 4(b × d3 × Δ) (1)
MOR (N/mm2) = 3(P × L) / 2(b × d2) (2)
where P is the load at some point below the proportional limit, L is the distance between specimen supports in mm, b is the width of specimen in mm, d is the thickness (depth) of the specimen in mm, and Δ is the deflection in mm corresponding to the load P.
The tensile strength parallel to the surface of the board was determined according to the ASTM D-1037 standard (2002). After attaching the specimen to the universal mechanical test machine, tension was applied parallel to the fibers at a fixed loading speed of 2 mm/min, and the greatest force at the moment of breaking was determined. The tensile strength parallel to the surface of the board was calculated with Eq. 3,
σc = Fmax / A0 (3)
where σc is the tensile strength (N/mm2), Fmax is the greatest force at the moment of breaking (N), and A0 is the cutting area of the specimen in mm2.
The tensile strength perpendicular to the surface of the board was determined by the TS EN 319 standard (1999). The specimens were attached to the universal mechanical test machine with the aid of a special braced apparatus, which was designed for testing the tensile strength perpendicular to the surface of the board. The greatest force at the moment of breaking was determined by applying a fixed tension force of 2 mm/min. The tensile strength perpendicular to the surface of the boards (fc) was calculated using Eq. 4,
fc = Fmax / (a × b) (4)
where Fmax is the force of breaking (N), a and b are the thickness and width of the specimen, respectively, in mm. The shearing (cutting) strength parallel to the surface of the particleboard was determined according to TS EN 319 (1999). The specimens were attached to the universal mechanical test machine via a special apparatus designed for testing the shearing strength parallel to the PB surface. The greatest force was determined at the moment of breaking by applying a cutting force at a fixed loading speed of 2 mm/min. The shearing strength parallel to the PB surface (σ) was calculated with Eq. 5,
σ (N/mm2) = Fmax / (a × b) (5)
where Fmax is the force at moment of breaking (N), a is the width of sliding surface of the specimen in mm, and b is the length of sliding surface of the specimen in mm.
Data Analysis
In this study, the type of adhesive (UF and MF), the type of additive material (GW and SW), and the ratios of these materials (10%, 15%, and 20%) were the independent variables, and the mechanical properties were the dependent variables. An analysis of variance (ANOVA), calculated by the SPSS-15 software (IBM SPSS Inc., Chicago, USA), was used to determine whether the independent variables had an effect, singly or as a group, on the dependent variables. If there was an effect, a “homogeneity test” was performed to determine whether the differences between the levels of the independent variables were significant. The significance of the models in the analysis of variance was tested with the R² value.
RESULTS AND DISCUSSION
To determine whether the type of adhesive, type of additive material, and ratios of the additive(s) affected the bending strength, modulus of elasticity, tensile strength parallel to the surface of the board, tensile strength perpendicular to the surface of the board, and cutting (shearing) strength parallel to the surface of the board of the specimens, the test results from all test boards were evaluated by ANOVA.
Based on p < 0.05, the type of adhesive, type of additive material, and ratio of additive affected the mechanical properties of particleboards. Next, homogeneity tests were used to determine whether the differences in the mechanical properties were significant for these variables.
Bending Strength
The homogeneity test examined whether the bending strength values were determined by the triple interaction of the type of adhesive, the type of additive material, and the ratio of additive (Table 1 and Fig. 2). The highest bending strength value of 15.38 N/mm² was associated with the dual interaction of the type of adhesive and the ratio of additive in the particleboards with UF adhesives and without the additives.
This maximum value was followed by 14.4 N/mm² in the particleboards with MF adhesives and without additives, and 10.0 N/mm² in the particleboards with MF adhesives and 10% additives. The lowest bending strength values of 6.0 N/mm² and 6.2 N/mm² were observed in the particleboards with MF and UF adhesives and a 20% additive material, which had an insignificant difference between them.
As the ratio of additive materials increased, the bending strength decreased in particleboards with either UF or MF adhesive.
Table 1. Homogeneity Testing of Bending Strength

*Note: Least Significant Difference (LSD = ± 0.85 N/mm²); UF, urea formaldehyde; MF, melamine formaldehyde; HG, homogeneity group

Fig. 2. Bending Strength values of control and mineral wool additive particleboards
Modulus of Elasticity
The homogeneity test examined whether the modulus of elasticity was connected to the triple interaction of type of adhesive, type of additive material, and ratio of additive (Table 2 and Fig. 3).
Table 2. Homogeneity Testing of Modulus of Elasticity

*Note: Least Significant Difference (LSD = ± 135.40 N/mm2); UF, urea formaldehyde; MF, melamine formaldehyde; MOE, modulus of elasticity; HG, homogeneity group
The highest modulus of elasticity value of 2187.6 N/mm² was associated with the dual interaction of the type of adhesive and the ratio of additive in particleboards with UF adhesives and without additives. This result was followed by the value of 2050.5 N/mm² in particleboards with MF adhesives and without additives, and the value of 1422.4 N/mm² in the particleboards with MF adhesives and 10% additives. The lowest modulus of elasticity values of 890.2 N/mm² and 857.9 N/mm² were observed in particleboards with UF and MF adhesives and 20% additives, and the difference between them was insignificant. As the ratio of both UF and MF adhesives and additive materials increased, the modulus of elasticity decreased in the particleboards.

Fig. 3. Modulus of Elasticity values of control and mineral wool additive particleboards
Tensile Strength Parallel to Surface of Board
The homogeneity test elucidated whether the triple interaction of type of adhesive, type of additive material, and the ratio of additive affected the tensile strength parallel to the surface of the board (Table 3 and Fig. 4).
Table 3. Homogeneity Testing of Tensile Strength

*Note: Least Significant Difference (LSD) = ± 0.45 N/mm2

Fig. 4. Tensile strength parallel to surface of board values of control and mineral wool additive particleboards
The highest tensile strength parallel to the surface value of 6.35 N/mm² is connected to the ratio of additive and was observed in the particleboards without an additive. This was followed by the values of 4.33 N/mm² and 3.87 N/mm² in the particleboards with 10% and 15% of the additives, and the difference between them was insignificant. The lowest tensile strength parallel to the surface was 3.34 N/mm², which was observed in the particleboards with 20% of the additive. Accordingly, the use of additive materials decreases the tensile strength parallel to the surface of particleboards, and the decrease in the tensile strength parallel to the surface with 10% and 15% of the additive ratios is insignificant.
Tensile Strength Perpendicular to Surface of Board
The homogeneity test for determining the tensile strength values perpendicular to the surface of the board and the differences among them connected to the triple interaction of type of adhesive, type of additive material, and the ratio of additive are given in Table 4 and Fig. 5. The highest tensile strength value perpendicular to the surface of the board connected to the dual interaction of the type of adhesive and the type of additive material was 0.81 N/mm² in the particleboards with UF adhesives and without any additives. This maximum was followed by 0.57 N/mm² in the particleboards with MF adhesives and without any additives. The lowest tensile strength perpendicular to surface was observed at 0.15 N/mm² in the particleboards with MF adhesive and glass wool additives. Strain stress graphic are given in Fig. 6.
Table 4. Homogeneity Testing of Tensile Strength Perpendicular to Surface
 *Note: Least Significant Difference (LSD) = ± 0.05 N/mm2; UF, urea formaldehyde; MF, melamine formaldehyde; TSPS, tensile strength perpendicular to surface; HG, homogeneity group

Fig. 5. Tensile strength perpendicular to surface of board values of control and mineral wool additive particleboards

Fig. 6. Strain stress values of control and mineral wool additive particle boards
Shearing Strength
The homogeneity test for determining the shearing strength after burning and the differences between them connected to the triple interaction of type of adhesive, type of additive material, and the ratio of additive are given in Table 5 and Fig. 7.
Table 5. Homogeneity Testing of Shearing Strength
 *Note: Least Significant Difference (LSD) = ± 0.85 N/mm2; UF= urea formaldehyde, MF= melamine formaldehyde, SS= shearing strength, and HG= homogeneity group

Fig. 7. Shearing strength values of control and mineral wool additive particleboards
The highest shearing strength of 2.66 N/mm² was in the particleboards with UF adhesives and without any additives, connected to the dual interaction of type of adhesive and ratio of additive. This result was followed by the particleboards with MF adhesives and without any additives at 1.85 N/mm², and the particleboards with UF adhesives and 10% of the additives at 2.05 N/mm². The difference between them was insignificant. The lowest shearing strength was observed in the particleboards with MF adhesives and 15% and 20% additives at 1.03 N/mm² and 0.92 N/mm², respectively. The difference between them was insignificant. Increasing the ratio of additives from 15% to 20% in the particleboards with both UF and MF adhesives did not affect the shearing strength.
Microscopic Level of Mineral Wools (GW-RW) at Particleboards
The investigation of mineral wools (GW-SW) using the scanning electron microscope (SEM) is especially promising through the combination of trace element analysis and light element sensitivity with spatial resolution. In this application, where there are two types of mineral wool (GW-SW) that have a very similar optical appearance, they can be distinguished by their spectra. The interaction of wood particles with mineral wools are shown in the SEM pictures. Mineral wools (GW-SW) could not merge with organic elements (wood particles) or organic composites, which explains the decrease of physical properties of GW-SW additive particleboards. SEM pictures are given in Figs. 8 and 9.

Fig. 8. SEM pictures of glass wool additive particleboards (Pb. = Particleboard)

Fig. 9. SEM pictures of stone wool additive particleboards (Pb. = Particleboard)
In previous studies, mixing with chemical substances with different plant particles negatively affected the mechanical properties of particleboards. For example, borax, boric acid, mono ammonium phosphate, di-ammonium phosphate, and phosphoric acid decrease the tensile strength parallel to the surface of fiberboards by up to 50% (Dobrowolska and Troger 1996). Particleboards produced with a density of 700 kg/m³ from kenaf fiber (Hibiscus cannabinus L.) were impregnated with di-ammonium phosphate (DAP), mono ammonium phosphate (MAP), and boric acid (BA), which are used extensively in wood impregnation. While the boards impregnated with di-ammonium phosphate met mechanical strength standards, the boards impregnated with mono-ammonium phosphate and boric acid did not (Izran et al. 2009).
CONCLUSIONS
- The use of glass fiber and rock wool in production connected to the type of adhesive and ratio of additive were the cause of a decrease in the mechanical properties of particleboards from ratios of 39% and reaching up to 75%.
- Decreases at almost the same ratios of 49% were observed for the bending strengths and modulus of elasticity of the particleboards manufactured by using SW and GW, without taking into account the type of adhesive and ratios of the additive.
- Increases in the ratios of GW and SW additives negatively affected the mechanical properties of the particleboards. The negative change in direction of the mechanical properties was at similar ratios.
- All of the R² values were between 0.98 and 0.99, and the models were found to be statistically significant.
- The main advantages of adding mineral wool fillers (stone wool and glass wool)
to the wood composites appear to be thermal insulation, weight reduction, and reduction of cost.
ACKNOWLEDGEMENTS
This work was supported by the project titled “Increasing the fire resistance of particleboards by using some mineral fibers” (07/2012-60) at the Scientific Research Unit of Gazi University, Ankara, Turkey.
REFERENCES CITED
Alıcı, Y. (2004). Mechanical Properties of Boards Produced by Using Waste and Cement, Bachelor’s Thesis, Karadeniz Technical University, Trabzon, Turkey.
ASTM D-1037 (2002). “Standard test methods for evaluating properties of wood-base fiber and particle panel materials,” ASTM International, West Conshohocken, USA.
Burdurlu, E. (1994). “Production and end-using technology of wood-based veneers and boards,” (in Turkish), Textbook of Veneers and Board Tech., Bizim Bureau Press, Ankara, pp. 201-306.
Chow, P. (1974). “Dry formed composite board from selected agricultural residues,” in: World Consultation on Wood Based Panels, Food and agriculture organization of the United Nations.
Copur, Y., Güler, C., Akgül, M., and Taşçıoğlu, C. (2007). “Some chemical properties of hazelnut husk and its suitability for particleboard production,” Building and Environment 7, 2568-2572. DOI: 10.1016/j.buildenv.2006.07.011
Dobrowolska, E., and Troger, F. (1996). “Fire behavior of gypsum-bonded particleboards,” Holz als Roh und Werkstoff 54(3), 163–169. DOI: 10.1007/s001070050159
Guler, C., and Ozen, R., (2004). “Some properties of particleboards made from cotton stalks,” Holz als Roh Werkstoff 62(1), 40–43. DOI: 10.1007/s00107-003-0439-9
Guru, M., Tekeli, S., and Bilici, I. (2006). “Manufacturing of UF based composite particleboard from almond shell,” Material and Design 27, 1148-1151. DOI: 10.1016/j.matdes.2005.03.003.
Izran, K., Zaidon, A., Rashid, A. M. A., Abood, F., Saad, M. J., Mohd, Z., Thimirzir, Z., Masseat, K., and Rahim, S. (2009). “Fire propagation and strength performance of fire retardant treated Hibiscus cannabinus particleboard,” Asian Journal of Applied Sciences 2(5), 446-455. DOI: 10.3923/ajaps.2009.446.455
Kalaycıoğlu, H., and Nemli, G. (1997). “Properties of structural particleboard prepared from the bark of Pinus brutia,” XI World Forestry Congress, Antalya-Turkey 50-53.
Kalaycioğlu, H., and Ors, Y. (1993). “Technological properties of particleboard produced from Maritime pine wood,” (in Turkish), Turkish Journal of Agriculture and Forestry 17, 737-751.
Nemli, G., Kırıcı, H., and Temiz, A. (2004). “Influence of impregnating wood particles with mimosa bark extract on some properties of particleboard,” Industrial Crops and Products 20(3), 339-344. DOI: 10.1016/j.indcrop.2003.11.006
Örs, Y., and Kalaycıoğlu, H. (1991). “Tea factory wastes evaluated for chip board industry,” (in Turkish), Turkish Journal of Agriculture and Forestry 15, 968-974.
Pablo, A. A., Ella, A. B., Casal, E. U., and Perez, E. B. (1975). “Manufacture of particleboard using mixtures of banana stalk and Kaatoan Bangkal wood particles,” Food and Agriculture Organization of the United Nations.
TS 2474 (1976). “Determination of static bending strength of wood,” Institute of Turkish Standards (TSE), Ankara, Turkey.
TS EN 319 (1999). “Particleboards and fiberboards – Determination of tensile strength perpendicular to surface of board),” Institute of Turkish Standards (TSE), Ankara, Turkey.
Article submitted: January 25, 2016; Peer review completed: April 9, 2016; Revised version received and accepted: April 30, 2016; Published: May 19, 2016.
DOI: 10.15376/biores.11.3.5974-5986