
Abstract
Wood-fired small- and medium-scale combined heat and power (CHP) plants are a proven technology for producing domestic, carbon-neutral heat and power. Hydrothermal carbonization (HTC) is a promising conversion technology for producing an improved, more versatile wood fuel. By integrating the HTC and CHP processes, the HTC process can be notably simplified. This study compares six different integration schemes to non-integrated plants. The overall energy conversion efficiencies were similar in all six schemes, but there were differences in power output and in plant complexity, and thus likely differences in investment cost and operability. The most promising cases were evaluated at varying HTC temperatures. This comparison showed that temperatures over 220 °C became problematic for the simpler heat recovery schemes, which resulted in poor efficiencies.
Download PDF
Full Article
Effect of Integration Method and Carbonization Temperature on the Performance of an Integrated Hydrothermal Carbonization and CHP Plant
Jussi Saari,a Katja Kuparinen,a,* Ekaterina Sermyagina,a Esa Vakkilainen,a
Juha Kaikko,a and Vitaly Sergeev b
Wood-fired small- and medium-scale combined heat and power (CHP) plants are a proven technology for producing domestic, carbon-neutral heat and power. Hydrothermal carbonization (HTC) is a promising conversion technology for producing an improved, more versatile wood fuel. By integrating the HTC and CHP processes, the HTC process can be notably simplified. This study compares six different integration schemes to non-integrated plants. The overall energy conversion efficiencies were similar in all six schemes, but there were differences in power output and in plant complexity, and thus likely differences in investment cost and operability. The most promising cases were evaluated at varying HTC temperatures. This comparison showed that temperatures over 220 °C became problematic for the simpler heat recovery schemes, which resulted in poor efficiencies.
Keywords: Hydrothermal carbonization; Biomass conversion; CHP; Modelling; Integration
Contact information: a: Lappeenranta University of Technology, P. O. Box 20, FI-53851, Lappeenranta, Finland; b: Peter the Great Saint Petersburg State Polytechnical University, St. Petersburg, Russia;
* Corresponding author: Katja.Kuparinen@lut.fi
INTRODUCTION
In the face of growing concerns of anthropogenic climate change, the European energy sector is under increasing pressure to reduce fossil fuel combustion. This has led to efforts to improve energy efficiency and increase the share of local and renewable energy sources. Biomass-fired combined heat and power (CHP) production using local wood is a strategy combining a carbon-neutral energy source with supply security and high efficiency. Among biomass fuels, wood has the advantages of relatively good energy density, availability throughout the year, and little need for fertilizers and herbicides (Van der Stelt et al. 2011). Wood-fired CHP production using domestic biomass also reduces energy imports. Currently in the European Union, over 1 billion m3 of wood, mainly from forests, is used annually for energy (Lieskovský et al. 2017). While well suited for distributed CHP production in small- to medium-sized plants, untreated wood can only marginally replace coal in large power stations (Bergman et al. 2011). If wood is delivered as chips, the low energy density increases transportation and storage costs. Wood is also hydrophilic and decays in storage (Verhoeff et al. 2011).
Hydrothermal carbonization (HTC) is a thermochemical conversion method where biomass-water slurry is brought to a temperature of 180 °C to 250 °C for a period of time at saturated-state pressure (Hu et al. 2010; Libra et al. 2011; Hoekman et al. 2013). While there are similarities to torrefaction, the chemical reactions are different (Hoekman et al. 2017). Lignocellulosic biomass becomes less stable in the presence of saturated liquid water, and a similar severity of pyrolysis can thus be achieved at a lower temperature (Libra et al. 2011; Sevilla et al. 2011). While different feedstocks such as crops and wastes (e.g., sludge or bark) can be used (Hu et al. 2010; Alatalo et al. 2013; Hoekman et al. 2013; Gao et al. 2016), these often suffer from a high ash content compared to wood. The product (hydrochar) has a higher carbon content and heating value than feedstock, and it is hydrophobic, easily dried, brittle, and easier to store due to higher energy density and reduced tendency to decay. Biomass treated with the HTC process can be used to replace fossil fuels in large boilers (Kludze et al. 2013). The hydrochar output also has other uses such as water purification, soil improvement, or in fuel cells (Hu et al. 2010; Hoekman et al. 2013). In addition to the hydrochar itself, valuable liquid-phase products, such as acetic and lactic acid, are also produced (Jin and Enomoto 2009).
Compared to dry torrefaction, HTC has the advantage of relative independence of feedstock moisture and easier drying, as it is the hydrophobic char product that is dried. Hydrochar also has advantages over torrefied biochar; it is physically more durable, more hydrophobic, and tends to have a somewhat higher energy density (Kambo and Dutta 2014; Reza et al. 2014). For the purpose of substituting biomass for fossil coal in existing coal-fired boilers, torrefied biochar is limited by the presence of inorganic elements such as alkalis and chlorine (Koppejan et al. 2012). In HTC, it has been reported that much of these inorganics, which tend to cause fouling, erosion, and slagging in boiler surfaces, are dissolved into the process water (Reza et al. 2014).
By combining the CHP and HTC plants, clear benefits can be achieved. Simple co-location of the two plants can yield savings through common feedstock logistics and storage, although the feedstock and the hydrochar product will still need separate storages, such that plant footprint is unlikely to be reduced much. Thermal integration of the processes could potentially have still further benefits, such as increased part-load power generation and annual operating hours in the CHP plant, process simplification and investment cost reduction, and efficiency improvement.
A number of studies of integrated plants combining various biomass conversion processes to CHP or condensing steam power plants have been published. Studies have found benefits in integrating ethanol production (Starfelt et al. 2010; Ilic et al. 2012; Starfelt et al. 2012; Zhou et al. 2012), gasification (Brammer and Bridgwater 1999; Difs et al. 2010), pelletization (Wahlund et al. 2002), and torrefaction (Sermyagina et al. 2015b) with steam power plants. Kohl et al. (2013) compared pelletization, torrefaction, and fast pyrolysis for CHP integration, finding improved economy from increased annual CHP operating time. Later Kohl et al. (2015) found fast pyrolysis to be the most profitable of the three thermochemical upgrading processes.
In this study, integrating a small-scale CHP plant with an HTC process is investigated. Six integration concepts are considered at two operating conditions: design point at full district (DH) heat load, and at 40% DH load. These concepts represent different integration depths, ranging from only combining the heat production to a single boiler, to a more thorough heat integration of the two plants. This research tried to find the most energy-efficient integration option and studied the effects that a heat user, in the form of a HTC plant, has on CHP plant operation and performance.
Public data on integrating HTC and CHP plants remains limited. Erlach et al. (2011) presented one way of integrating HTC and CHP processes. The CHP has several potential heat sources for the HTC process. Each source has different advantages and disadvantages. The purpose of this study is to investigate the effects of six different integration concepts on plant performance. These different integration schemes were designed, described, and evaluated at 220 °C HTC temperature, a typical moderate temperature. The cases that appeared the most promising were then further simulated at varying HTC carbonization temperatures from 180 °C to 240 °C to investigate the impact of chosen temperatures on the integrated plant performance.
METHODOLOGY
CHP Plant Model
A commercial small modular biomass-fired backpressure plant with a 29 MW thermal output bubbling fluidized bed (BFB) boiler (Valmet, Helsinki, Finland) (Komulainen 2012) was considered. While most of the main parameters such as live steam flow, pressure, and temperature were adopted directly according to the values presented for the actual plant in (Komulainen 2012), adjustments were made to the low pressure end of the steam cycle. The air-cooled vacuum condenser was omitted, and district heat production was arranged via a backpressure district heat (DH) condenser rather than extraction steam. This arrangement, having the advantages of simplicity and better efficiency at the cost of some flexibility and power generation, is typical for small-scale CHP plants in Finland. At design point 20 MW, district heat is produced at 90 °C / 50 °C outlet/return temperatures. The omission of the vacuum condenser reduced the benefit of having a low pressure feed heater, which was removed. Design-point deaerator pressure was maintained at the same value obtained from Komulainen (2012).
The turbine has a partial admission regulating stage and separate high-pressure (HP) and low-pressure (LP) parts, with extraction at the HP exhaust that is controlled by the LP turbine inlet valve. The schematic diagram is shown in Fig. 1. IPSEpro process simulation software (SimTech, version 6.0, Graz, Austria) was used to model the CHP and HTC processes.
Boiler
The boiler model consisted of a furnace, superheater, economizer, air preheater (luvo), and steam coil air heater (SCAH) modules. Design-point losses are stack loss  stack 2.5 MW, radiation loss rad0.1 MW, blowdown loss bd 0.1 MW, ash loss ash 0.02 MW, unburnt loss ub 0.2 MW, and other losses other 0.3 MW. These yield a boiler efficiency of
  = 0.88, defined as,
 (1)
(1)
where ṁ is the mass flow rate (kg/s), h is enthalpy (kJ/kg), LHV is the lower heating value (MJ/kg), and subscripts LS, FW, F, and A refer to the live steam, feedwater, fuel, and air, respectively. At part load rad is constant, blowdown remains 1% of feedwater, and other losses are 1% of fuel input. Ash and unburnt losses are found assuming 40% unburnt carbon in ash. Excess air ratio is ![]() = 1.2 at design point, and 1.35 at minimum load. A dry-basis net heating value LHVd of 19.5 MJ/kg and 1% dry matter ash content were assumed for the fuel. Wet basis moisture content (MC), MC = mW / md + W, was assumed to be 0.5 at design point, and 0.45 at 40% DH load.
= 1.2 at design point, and 1.35 at minimum load. A dry-basis net heating value LHVd of 19.5 MJ/kg and 1% dry matter ash content were assumed for the fuel. Wet basis moisture content (MC), MC = mW / md + W, was assumed to be 0.5 at design point, and 0.45 at 40% DH load.

Fig. 1. Schematic diagram of the CHP plant model
The design-point heat transfer surface data are summarized in Table 1. The furnace heat transfer rate was assumed to vary proportionally to the 4th power of absolute furnace temperature. The superheater, economizer, and luvo were modelled as counterflow heat exchangers, with thermal powers (MW) obtained with conductance G (kW/K) (the product of heat transfer area and overall heat transfer coefficient) from Eq. 2,
 (2)
(2)
where  is the logarithmic temperature difference (K).
Off-design conductances GOD were found assuming small fouling and wall resistances. Convection heat transfer coefficients are proportional to 0.8th power of mass flux inside tubes and, approximately, also outside in high Reynolds number flow across tube banks according to correlations by Dittus and Boelter (1985) and Žukauskas (1987). Because all mass flows vary roughly proportionally to flue gas flow ṁFG GOD was assumed to vary proportionally to the 0.8th power of ṁFG.
Table 1. Heat Transfer Surfaces at Design Point

Turbine
Isentropic efficiency  = 0.88 was set for turbine modules at optimum flow. Part-load efficiencies were modelled as a function of steam flow relative to optimum flow by curve fits based on Tveit et al. (2005) for the regulating stage, see Eq. 3, and based on Jüdes et al. (2009) for the working stages, see Eq. 4. Optimum efficiency was assumed at 10 kg/s in the HP turbine and regulating stage, and assumed at 9 kg/s in the LP turbine. The curves are shown in Fig. 2.

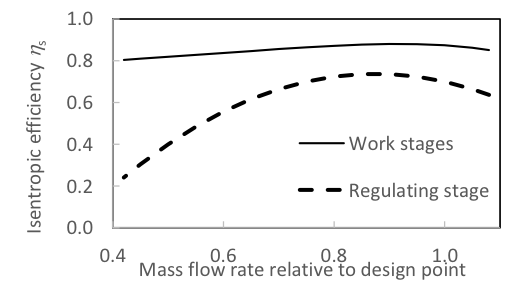
Fig. 2. Isentropic efficiency of turbines as a function of steam flow relative to design-point
Moisture in steam reduces efficiency; a reduction of 0.8% to 1.2% of per 1% average stage moisture content has been reported (Sanders 2004). The efficiency of a turbine module was estimated from the dry efficiency ,dry and outlet steam quality xout by Eq. 5:
 (5)
(5)
Mass flow rate and pressure (p; Pa) levels are bound by the ellipse law (Traupel 1966),
 (6)
(6)
where v is the specific volume (kg/m3). The ellipse law is simplified in the model here by assuming a constant intake ratio u and n ≈ 1 for steam.
Condenser
The district heat condenser was a 400 m2 shell-and-tube condenser with design parameters of DH = 20 MW, water output/return temperatures 90 °C /50 °C, overall heat transfer coefficient UDHC,D = 3400 W/m2K, and steam-side  = 0.02 bar. These yielded a terminal temperature difference (TTD) of 3.5 °C and pressure ph = 0.80 bar.
A condenser module was designed to estimate off-design performance using the effectiveness- number of transfer units  method. The heat transfer coefficient UDHC,OD (W/m2K) was approximated from steam pressure ph, DH water mass flow rate ṁc (kg/s), and DH water mean temperature tc (°C). Design-point thermal resistances were assumed to split as follows: 35% convection, 25% condensation, and 40% conduction (wall + fouling). The resistance changes are based on a correlation by Eagle and Ferguson (1930) for convection, and on an adaptation from a graph by Holmström (1982) for condensation, yielding Eq. 7:

The pressure drop was assumed to change proportionally to the dynamic pressure  :
:

Other components
In addition to the components described above, equipment such as various pumps, fans, fuel, and ash handling also consume power. It was assumed that all of the pumps were electrically driven. Pump efficiency (  p) and motor efficiencies ( em) were constant at p = 0.7 and em = 0.85, with the exception of p = 0.8 and em = 0.95 for the feedwater pump. The remaining power consumptions were summed as a single Paux figure in the model. At design point Paux,D = 500 kW was assumed based on research by Bowman et al. (2009), where fuel handling and boiler fans are usually the largest power consumers. Off-design Paux,OD was estimated from fuel and flue gas flows (F and FG) according to Eq. 9:

Limits of off-design operation
The design point is typically slightly less than the plant maximum continuous rating. Flue gas velocity, furnace temperature, and turbine swallowing capacity set the upper limits, while the furnace and stack temperature set the minimum limits. The boundaries assumed for the plant are listed in Table 2.
Table 2. Off-design Operating Limits for the CHP Plant

Hydrothermal Carbonization Model
Hydrothermal carbonization is a low-temperature thermochemical conversion process in which the feedstock is in a slurry at a saturated state. The feed slurry is pre-heated with vapor from the product slurry expanded in flash tanks. Two stand-alone schemes were considered. A scheme similar to that presented by Erlach et al. (2011) is shown in Fig. 3a; Figure 3b is a simplified version with a two-stage depressurization and heat recovery scheme where the dryer heat is supplied entirely as flash vapor. Continuously operating process is assumed in both cases. Due to IPSEpro limitations, slurries were modelled as separate water and dry streams, which required new heat exchanger and pump models. The simpler scheme needed slightly more steam for the reactor, but total heat requirements were within 0.3% of each other. For an independent HTC process, a small wood-fired boiler supplied the steam.

Fig. 3. (a) Stand-alone HTC processes modelled after Erlach et al. (2011); (b) a simplified process used in this study; (Components for both processes: 1- feeder, 2- slurry heater, 3- vapor injection, 4- slurry pump, 5- reactor, 6- flash tank, 7- dewatering, F- furnace, SG- steam generator, SH- superheater, Luvo- air preheater, and Eco- economizer)
To ensure that both the correct water-to-biomass ratio and saturated state are achieved, liquid water can be separated from the feed and diverted past the reactor. After the last flash tank, the slurry is mechanically dewatered to MC = 0.4 moisture and thermally dried to MC = 0.05. Water from dewatering is mostly recirculated to recover water, heat, and also the organic acids that act as catalysts (Stemann et al. 2013). The remainder is sent to wastewater treatment after heat recovery either in a dryer, or in a heat exchanger, to heat the makeup water.
The liquid and gaseous products include large amounts of water and CO2, less CO, and various organic compounds. Most of the products are dissolved in water; the off-gas is mainly CO2 and CO. With a poor heating value, the gas is considered a waste product. It could be fed into the CHP boiler to prevent hydrocarbon and carbon monoxide emissions, but the energy gain would be negligible.
Slurry feed process and heating
The heat demand of the HTC process  HTC can be split into four parts: sensible heat of feedstock biomass dry matter ( F,d), sensible heat of water ( W), HTC heat of reaction ( react), and heat losses ( loss). Of these, the water sensible heat is by far the largest, followed by the dry matter sensible heat. The heat of reaction is released almost entirely in the reactor. While accurately determining the sensible heat is simple for water, this is not the case for biomass dry matter; the specific heat cp,F,d is subject to some uncertainty. Particularly at temperatures over 147 °C, where wood decomposition begins, estimating the cp is difficult. Most correlations, such as TenWolde et al. (1988), Skaar (1988), Koch (1968), and Gupta et al. (2003), are said to be valid from 147 °C to 177 °C. While Harada et al. (1998) presents a correlation stating validity up to 260 °C, it yields values clearly different from the others. The commonly-used correlation by TenWolde et al. (1988) was used in this study,

where  represents the average temperature (K). The correlation was extrapolated beyond its stated range when necessary, which clearly can cause errors, but this was still considered likely more accurate than the Harada correlation, whose results differ remarkably from all other correlations. Because the heat input was mostly used to heat the slurry water, errors from wood cp were assumed to remain minor.
Chips are fed to water in a so-called Kamyr feeder where a cruciform rotor alternates every 90 ° rotation cycle between chip insertion, high-pressure water injection, and flush (Rautalin and Wilén 1992). Water and dry matter exit the module at the same temperature Tout, found from the energy balance in Eq. 11. If TF ≥ 273 K, the heat of melting hfs was zero. In Eq. 11 the subscript F refers to the feedstock, d to it’s dry matter component, W to water, W,in to the water injection, and L and S to the liquid and solid states respectively:

The slurry is usually further pressurized in pumps. Slurries with 30% to 60% dry matter can be pumped with piston pumps (Erlach 2014). Enthalpy rise was calculated according to Eq. 12,
 (12)
(12)
where a pump efficiency of  was assumed. The volumetric flow (V̇; m3/s) assumed the same densities for wood and water. While wood is slightly less dense, the densities are close, and as the slurry is mostly water, this was considered sufficiently accurate. The outlet temperature was found (Eq. 13) by setting the enthalpy rise
  of Eq. 12 to equal the mass-weighted average of dry and water fractions, both having the Tout and Tin,

where the subscripts F,d and W refer to the feedstock dry matter and water fractions, respectively.
Before going to the reactor, the slurry was preheated in most process concepts with direct vapor injection or in an indirect heater. The indirect heater hot-side outlet enthalpy was defined by saturation temperature at outlet pressure. The slurry outlet temperatures were calculated from energy balances in Eq. 14 (injection) and Eq. 15 (indirect heater):

HTC reactor
Because data from an industrial-scale HTC using Nordic wood is not yet available, modelling the performance of one is subject to some uncertainties, so no direct comparisons can be made to real industrial data. It has been assumed that the dry matter specific heat, reaction enthalpy, and heat losses with the off-gas can be modelled using laboratory-scale data. The reactor was directly heated by steam or hot water to bring the slurry to saturated state at desired temperature.
The mass and energy yields, M and E, were obtained from correlations based on laboratory-scale experiments (Sermyagina et al. 2015a),

where is temperature (°C), is residence time (h), rW-d is the water-to-biomass (dry) mass ratio, and HHV is the higher heating value (MJ/kg). The correlation was based on experiments made with relatively low ratios of 6 to 8 parts water to biomass dry matter (Sermyagina et al. 2015a), because a high fraction of water would likely make the process equipment rather expensive for a large-scale process (Vallejos et al. 2017). For conversion between lower heating value (LHV) and HHV, feedstock was assumed to have a 6% hydrogen mass content (Alakangas 2000), reduced to an estimated 5.5% in hydrochar (Hoekman et al. 2011; Hoekman et al. 2013).
Estimates of the HTC heat of reaction vary. Slight exothermicity is often reported, depending on the feedstock and HTC severity (Ramke et al. 2009; Yan et al. 2010; Funke and Ziegler 2011; Libra et al. 2011; Stemann and Ziegler 2011). Funke and Ziegler (2011) suggest increasing exothermicity as severity increases. For poplar, Stemann and Ziegler (2011) assumed -0.5 MJ/kg heat of reaction for 4 h at 220 °C, and Funke and Ziegler (2011) -0.76 MJ/kg for 10 h at 240 °C HTC. Yan et al. (2010) report -0.53 ± 0.75 MJ/kg for Loblolly pine (230 °C for 5 min). Recycling liquids increases the uncertainty of results (Stemann and Ziegler 2011). Yan et al. (2010) concluded that the heat of reaction is close to zero. Due to the high uncertainty yet small magnitude compared to heating the slurry water, hreact ≈ 0 was assumed.
Neglecting the HTC product formation enthalpies as small, uncertain terms, the energy balance can be simplified and written in terms of bringing incoming flows to the reactor temperature THTC, and incoming vapor condensing to saturated liquid. Solved for the heating mass flow rate, this yielded Eq. 18,

where F,d and W refer to feedstock dry matter and water fractions, respectively; c and h refer to cold (feed slurry) and hot (incoming heating medium) flows, respectively; rad is the radiation loss (kW), and vent is off-gas heat loss (kW). Some steam was lost with the off-gas. The vent loss was estimated assuming water in the off-gas was saturated vapor at THTC, and water mass fraction in the off-gas was rW,vent = 1/3. The water-to-biomass ratio is the ratio of water from heating and slurry (deducting off-gas water) to dry matter:

The liquid output contained both the slurry water and liquid HTC products. Because the liquid and gas outputs were small compared to the slurry flow and their use or treatment was beyond the scope of this study, a 2:1 liquid-to-gas ratio approximation was assumed based on research by Hoekman et al. (2011). The thermal model treated the liquid as water.
Product slurry treatment and heat recovery
The slurry exited the HTC reactor at a saturated state, and it was depressurized in a series of flash tanks where part of the slurry water vaporizes. The vapor mass flow rate was obtained from energy balance as evidenced by Eq. 20,

where pFT is tank pressure (bar), and subscripts HC,W refers to the water in hydrochar slurry, W2 to the possible additional water input, HC,d to the char dry matter, and V to the flash vapor. In the absence of correlations for hydrochar, the specific heat cp,hc was estimated as that of wood in Eq. 10.
The dewatering power usage was difficult to estimate, because data for industrial-scale wood hydrochar dewatering was unavailable. Belt filters and screw presses can dewater anaerobic pulp and paper mill sludge to 20% to 30% dry content with a 10 to 30 kWh/t power consumption (Bajpai 2015). Cell structure is largely broken in the HTC process, making hydrochar dewatering easier; a MC of 30% to 50% has been achieved in experiments before (Ramke et al. 2010). Based on this, it was estimated that a MC = 40% was likely achievable with 30 kWh/tdry.
Mass losses were inevitable in dewatering and drying, so 1% dry matter and 5% water losses were assumed. Heat losses depended on equipment, storage, and ambient temperature (tamb). The heat loss was likely less for wastewater than for hydrochar, which would be stored before drying. The water and hydrochar temperature drops  tW and tHC were estimated as tW = 0.1(100 °C – tamb) and THC = 0.5(100 °C – tamb).
A belt dryer with specific heat consumption of  = 1.1 kWh/kgevap at tamb = 0 °C and power consumption of 200 kWel/(kg/s)output, considered typical for a belt dryer (Fagernäs et al. 2010; Arpiainen and Wilen 2014), was assumed. The heat of evaporation, 0.678 kWh/kgevap, was assumed constant. The energy to heat the feedstock and air as well as the radiation losses increase at colder temperatures. Heat consumption was estimated to vary proportionally to T between operating temperature, assumed 70 °C, and tamb:
 For heat supply, the stand-alone HTC plant used a stoker boiler. Design-point output and efficiency of the boiler were 5 MW and 82%, with losses of rad 104 kW, stack 574 kW, ub 240 kW, ash 6 kW, and other 53 kW. The unburnt loss fraction of fuel input rub increases with moisture, rub = 0.1MC – 0.005, yielding losses in line with those of modern stoker boilers (EPA 2007).
Integration of HTC and CHP Plants
Six integration concepts were considered in addition to the separate-plants option (Case 0). Case 1 was based on the Fig. 3b stand-alone plant, the reactor using CHP live steam throttled and desuperheated to 350 °C. Case 2 was based on the Fig. 3a scheme. The process schemes as well as their main operating parameters are shown in Appendix A. In all cases, both the boiler fuel and the HTC feedstock are raw wood chips. The LP flash vapor for the dryer was augmented by backpressure steam from the CHP plant. While the net heat use of this scheme was similar to Case 1, in an integrated plant the CHP cycle benefited from heat being removed from the steam cycle at a lower temperature.
The HTC processes of cases 3 to 6 (see Appendix A) were more integrated to the CHP plant than cases 1 and 2. Case 3 was based on the integration proposed by Erlach et al. (2011). In contrast to Case 1, HP flash vapor was used in the CHP plant LP preheater (LPPH). Cases 4 to 6 simplified the HTC plant by using feedwater alone or with drum water (cases 5 and 6) to make slurry pumping unnecessary. The drum water was also hot enough for reactor heating. The HP flash tank pressure was set to match the LP flash vapor to dryer need. The much-increased combined CHP and HTC makeup water flow was preheated with wastewater in these cases.
The ratio of recirculated water to fresh water in the HTC feed was kept at 3:1, except in cases 4 to 6, where most of the HTC water was fresh from the CHP plant. In cases 4 and 5, only the condensate return from the LPPH was recirculated. In Case 6 some of the depressurized slurry water was recirculated and heated with drum water and HP flash vapor, but the recirculated-to-fresh ratio remained well below 3:1.
A well-designed heat recovery scheme is vital for a reasonably efficient HTC plant. Table 3 lists the design-point heating and heat recovery heat rates. A temperature of 220 °C, a 3 h residence time, and 1:6 dry matter-to-water ratio were assumed. Depending on the case, heat input to reach the required reactor conditions took place in different stages: to the water before the chip feeder, to the slurry feed, or directly to the reactor. All but reactor heating were potential sinks to recover the relatively low-grade heat from the hydrochar slurry.
Table 3. Main Parameters of Feed Slurry Heating and Heat Recovery for the Integrated Cases at Design Point

In cases 1 and 2 with HTC processes similar to the stand-alone cases, heat recovery from the product slurry flash vapor to the feed slurry stream was dominant. Case 3 required more reactor heating because the CHP plant took a major fraction of the available flash vapor. In cases 4 to 6, the chips were fed to already-pressurized and substantially-heated water, while the much-increased wastewater stream was cooled in the heat exchanger to heat the similarly-increased makeup water stream. In cases 4 and 6 the slurry was heated mostly in the reactor. Case 5, which used mostly hot drum water, required little additional heating after chip insertion.
The heat transfer areas were estimated assuming the following overall heat transfer coefficients: water-to-water 1.0 kW/m2K, indirect slurry heater 2.0 kW/m2K, and CHP plant LPPH 3.0 kW/m2K. In cases 4 to 6, the higher temperature of the fresh water stream forced more of the product slurry heat to be recovered to other water streams of both processes by using indirect heat exchangers. While these additional components added cost and complexity, the heat transfer areas required were relatively small, and the additions should be weighed against the benefit of simplifying the feed slurry heating and pressurization.
RESULTS AND DISCUSSION
In the initial analysis, the residence time, temperature, and water-to-dry-matter ratio were assumed as 3 h, 220 °C, and 6:1, respectively, in all cases. Hydrochar heating values were HHVhc,d = 25.8 MJ/kg and LHVhc,d = 24.7 MJ/kg dry, at final MC = 0.05 moisture, the HHVhc = 24.5 MJ/kg and LHVhc = 23.3 MJ/kg. Hydrochar production was constant at 5 tons/h in every case. The design point (fuel MC = 50%, maximum DH production and ambient temperature 0 °C) and low load (MC = 45%, tamb = 10 °C, 40% DH load) energy consumption and power, heat, and hydrochar production figures are listed in Tables 4 and 5. The polygeneration efficiencies are shown both in terms of LHV and HHV, defined as,

where Pel,net is the electricity production remaining after auxiliary consumption (MW), and F refers to the untreated wood chips used both as boiler fuel and HTC feedstock.
Integrating HTC and CHP reduced the required heat input. The total fuel use reduced from 91 MW to 88.7 MW for Cases 0 and 1. The heat input was constant for all integrated cases 1 to 6 as flue gas exit temperature was kept constant. The electricity production varied from case to case. The simplest integration resulted in a net electricity production Pel,net decline from 7.39 MW in Case 0 to 5.98 MW in Case 1. In the more integrated cases 2 to 6, Pel,net decreased even further to between 5.28 MW to 5.74 MW.
The efficiency differences between the cases were small; at maximum DH production, integrated cases 1 and 2 yielded a slightly better overall efficiency. The efficiency gain of more integration cannot be realized because in the more-integrated ones studied (cases 3 to 6), the CHP plant reduced its production, and the efficiency of the HTC plant was less than that of the CHP plant. Cases 4 and 5, with little or no HTC fluid recirculation and almost triple the amount of wastewater flows, had the poorest efficiencies. Although heat recovery cooled the wastewater to 40 ± 5 °C, the increased flow increased the heat losses. Case 4, where the high wastewater heat loss was combined with low CHP output, had the poorest efficiency, but at 79.1% (LHV) was still only 0.9% below the 80.0% efficiency of Case 1. Cases 4 and 5 also yielded slightly lower power output than the other integrates.
Minimum-load cases (8 MW DH) are presented in Table 5, which shows the different behaviour to full load. The CHP plant steam flow increased. Case 2 yielded both the highest electricity production and best overall efficiency. The efficiency of Case 3 was reduced slightly because at low CHP, but full HTC load, the main condensate was insufficient to absorb all flash vapor, some of which must then be vented to the atmosphere. Differences in efficiency were still small and ranged from 75.2% to 76.5%, but the efficiency of Case 3 decreased rapidly at still lower loads as the vented flash vapor increased.
Table 4. Consumption and Production Figures at Tamb = 0 °C, 100% DH Load

Table 5. Consumption and Production Figures at Tamb = 10 °C, 40% DH Load

Cases 1 and 2 were the most efficient cases, both at 100% and 40% DH load, at almost the same efficiency. The separate plants of Case 0 ranked third at both load points, at nearly the same figures at full load, but slightly further behind at 40%. The other four configurations ranked differently at full and 40% load; Case 3 (Erlach et al. 2011) achieved almost the same efficiency as cases 0, 1, and 2 at full load, but became the worst at 40% load. Of the cases that used feedwater and drum water, Case 4 was the worst at both load points; cases 5 and 6 had almost identical efficiencies. Case 2 was the most efficient of the cases, but the difference was slight and this was clearly the most complex scheme. In addition to higher cost, plant operation may be challenging. The indirect slurry heater may prove to be prone to clogging and fouling, and the flows and pressure levels need careful management because the pressure gradients from the product to feed slurry are small, and the feed slurry came very close to boiling before each pressurization stage.
Figure 4 shows the selected operating parameters that limited the CHP plant maximum and minimum loads.

Fig. 4. CHP process parameters at maximum and 40% DH load. Dotted black lines show minimum/maximum values where applicable. SCAH stands for Steam Coil Air Heater.
In the maximum-load case (Table 4), the power output was limited by flue gas flow in all cases. At minimum load, the separate plants were limited to the 8 MW DH load by furnace temperature, and the SCAH inlet valve was also almost fully open; the minimum stack temperature could not be maintained at lower loads.
All integrated cases were operated at 770 °C to 790 °C furnace temperature, with the SCAH steam valves not fully open. No case approached the point where bypassing the turbine should be considered. It was thus clear that integration with HTC allowed the CHP plant to be run at lower DH loads.
For analyzing the impact of HTC temperature on performance, the cases considered were narrowed to the most promising ones: Cases 1, 5, and 6. Case 0 was evaluated as a reference for comparison. Case 2 was rejected due to being overly complicated, Case 3 was rejected on grounds of rapidly increasing losses at low DH loads, and Case 4 was rejected for having the poorest overall efficiency. A temperature range of 180 °C to 240 °C, the same as the measurements in the reference (Sermyagina et al. 2015a) used as the basis for yield correlations, was considered. Calculations were performed at 20 °C intervals.
Figure 5a shows the variation of net electric power output and Fig. 5b the CHP boiler fuel consumption at full and 40% DH load. At full load a clear reduction of full-load power production is seen in all integrates, caused by the HTC steam consumption as the plant was operated at full load while maintaining DH output. The boiler fuel consumption was thus constant at its maximum limit for all integrated cases. Additionally, some electricity was lost for HTC power consumption. This was the sole reason for the lower power production of Case 0 compared to the pure CHP plant at both load cases.

Fig. 5. HTC temperature effect on a) net power production and b) boiler fuel consumption
At 40% load, the pure CHP plant and Case 1 integrate had almost identical power outputs, a coincidence of opposing effects canceling each other. The CHP plant required some constriction of the LPT control valve to maintain sufficient pressure at the SCAH for the stack temperature to stay above its minimum limit, and the reduced boiler load had also clearly reduced the turbine inlet temperature. With Case 1, the boiler load was enough for very little SCAH heat input to suffice, and the live steam temperature also remained almost at the nominal value. The power thus gained was almost exactly matched by the HTC power consumption. Case 0 equaled the CHP output minus the HTC consumption.
Cases 5 and 6 exhibited different behavior: a reduction in HTC temperature resulted in less flash vapor available for the LPPH, and thus more extraction steam was needed for the CHP deaerator. The expansion of this additional steam flow in the HP turbine increased power production. The effect was stronger in Case 5 with a less complex and efficient heat recovery scheme, where the boiler fuel consumption also increased as the HTC temperature was reduced from 220 °C to 180 °C, despite the slight decrease in HTC heat consumption.
As the HTC temperature was increased from 220 °C to 240 °C, the HTC heat consumption increase was clearer. The full-load Pel,net decreased at an increasing rate, while 40% load boiler fuel consumption increased. This was particularly pronounced in Case 5, where an increasing amount of wastewater must be bypassed past the heat recovery heat exchanger. This was necessary to keep the temperature of the relatively small CHP main condensate flow below saturation temperature, despite the increasing amount of heat available as flash vapor from the HTC plant.
In Case 1, the 2-stage heat recovery scheme reached its limit of efficient operation at approximately 220 °C. At a temperature of 240 °C and at 40% DH load, some HP flash vapor venting was required to prevent the feed slurry from approaching within 5 °C of boiling point. At 240 °C and 100% DH load, the wastewater heat recovery heat exchanger (HRX) had to be bypassed. As a result, the 100% load power output was reduced, and a 40% load boiler fuel consumption was increased. The created wastewater must be treated in an on-site facility.
The LHV- and HHV-based trigeneration efficiencies of the considered cases were shown as functions of HTC temperature in Figs. 6a and 6b. The efficiency variations between the cases were relatively small, and all cases – integrated or not – were within 2% of each other.

Fig. 6. HTC temperature effect on trigeneration efficiency based on a) LHV and b) HHV values
The differences between the cases expanded somewhat at 40% DH load and 240 °C HTC temperature, where the losses of the HTC process in Case 5 increased noticeably more than in other cases due to the need to bypass the HRX to maintain low enough water temperature at the LPPH. Case 1 had the best performance at the 240 °C, 40% conditions. This was due to Case 1 having the highest CHP power production under these conditions. As the relative fraction of energy products from the CHP process was increased, and the CHP part of the integrated plant has a better efficiency than the HTC, the net result was improved total efficiency. This partially compensated for the increased losses in the HTC process at this temperature.
The results obtained are based entirely on process modelling; unfortunately no data is available to compare the results to actual plants operating with Nordic forest biomass feedstock. This results in certain unavoidable uncertainties, which could be alleviated if operational data from industrial-scale plants was available. Particularly slurry heat exchanger performance (heat transfer coefficients and fouling), the HTC reactor itself (off-gas composition and heat losses) and slurry pumps had to be modelled using assumptions that should be verified and if necessary adjusted when data from operational plants becomes available.
HTC process sizing was not considered as a variable in this study; only hydrochar production rate of 5 tons per hour of 5% moisture content product was considered. Depending on the temperature and feedstock moisture (45 or 50%), this corresponds to the use of 12 to 16 tons per hour of raw chip feedstock. The optimal sizing of the HTC plant would depend on a number of variables related to the prices of electricity, heat and char product, and investment costs. The best operating strategy would likely depend on the prices as well. At full load, HTC operation yields a 1.4 to 2.1 MW loss of power generation at 220 °C. At coldest winter periods, the prices of electricity can reach very high levels; under such circumstances, the profit from hydrochar production may be insufficient to justify the loss of power generation. A careful evaluation of the expected conditions, prices, and operating strategy would thus be needed to determine the best sizing of the plant. Such analysis was ruled outside the scope of this study.
While a detailed evaluation of the economics was not performed, some general directional analysis can be made. Case 5 is clearly the least complicated option and likely to have the lowest investment and operating costs, even though it has the drawbacks of having the greatest waste water flow rate also. The advantage of Case 1 is the highest power generation of all integrated cases at almost all considered operating points: a higher net power production can be achieved only at low HTC temperatures by Case 6 at full DH load, or Case 5 at 40 % DH load. If a sufficiently high electricity price is assumed, this can be enough of an advantage to offset the likely higher investment and operating costs of the more complex Case 1. Cases 5 and 6 are broadly similar in performance, and likely in economic terms as well.
CONCLUSIONS
- It was evident from the results that integration will not bring clear efficiency benefits compared to having separate hydrothermal carbonization (HTC) and combined heat and power (CHP) plants, nor will the plant footprint be changed much. However, two of the studied cases resulted in better efficiencies than the combination of the separate processes.
- An advantage of integration was that an additional heat consumer allowed the CHP plant to run at lower district heat (DH) loads, which reduced the time when auxiliary heat-only boilers that typically fire more expensive, often fossil fuels, were needed. The unavoidable cost was the loss of some power production at full load, if the HTC plant was operated at that time.
- Another advantage was that by integrating the HTC to the CHP plant, the HTC plant size and complexity was greatly reduced. Removing a separate boiler plant was the clearest and most obvious advantage, but the HTC process was simplified as well. This was possible by using the already pressurized hot water from the CHP cycle for HTC feed slurry water, removing the need for the regenerative feed slurry heating and slurry pumping. The CHP cycle main condensate also provided a heat sink for depressurizing the product slurry in these cases. Sending the HTC reactor off-gas flow to a large boiler also reduced their possible environmental impact.
- The carbonization temperature proved to have a small impact on efficiencies up to approximately 220 °C, above which the efficiencies of all cases begin to reduce. The simplest cases at low DH load experienced the biggest reductions due to the simplified heat recovery schemes becoming insufficient. Within the range between 180 °C and
220 °C, the carbonization temperature impact on efficiency was small, but a reduction in the temperature allowed some cases to slightly increase the power output, particularly at low DH loads.
ACKNOWLEDGMENTS
This study did not receive any grant from funding agencies in the public, commercial, or not-for-profit sectors.
NOMENCLATURE
specific heat (kJ / kgK)
E energy yield (-)
conductance (W / K)
enthalpy (kJ / kg)
HHV higher heating value (MJ / kg)
LHV lower heating value (MJ / kg)
M mass yield (-)
mass flow rate (kg / s)
moisture content, wet-basis (-)
pressure (bar)
P power (W)
r ratio (-)
t temperature (°C)
temperature (K)
overall heat transfer coefficient (W / m2K)
v specific volume (m3)
volumetric flow rate (m3 / s)
x steam quality (-)
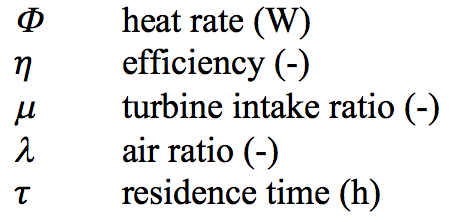
Greek letters
Superscripts
‘ saturated liquid
‘’ saturated vapor
Subscripts
A air
amb ambient conditions
aux auxiliary
b boiler
bd blowdown
c cold side of heat exchanger
d dry
D design point
DH district heat
DHC district heat condenser
el electric
em electric motor
evap evaporated water
F fuel or feedstock (raw chips)
FG flue gas
FT flash tank
FW feedwater
gen generator
h hot side of heat exchanger
HC hydrochar
HTC hydrothermal carbonization
i inside
in inlet
L liquid phase
lm logarithmic mean
LS live steam
o outside
OD off-design
opt optimum
out outlet
p pump
rad radiation
react reaction
s isentropic
S solid phase
SP slurry pump
spec specific (per kilogram)
t turbine
ub unburnt
V vapour phase
W water
W-d water-to-dry
W,vent water in reactor off-gas
Abbreviations
CHP Combined Heat and Power
DH District Heating
DHC District Heat Condenser
HHV Higher Heating Value
HP High Pressure
HRX Heat Recovery Heat Exchanger
HTC Hydrothermal Carbonization
LHV Lower Heating Value
LP Low Pressure
LPPH Low Pressure Preheater
MC Moisture Content
SCAH Steam Coil Air Heater
REFERENCES CITED
Alakangas, E. (2000). Suomessa Käytettävien Polttoaineiden Ominaisuuksia [Properties of Fuels Used in Finland] (Report No. VTT-TIED-2045), VTT Technical Research Centre of Finland, Espoo, Finland.
Alatalo, S.-M., Repo, E., Mäkilä, E., Salonen, J., Vakkilainen, E., and Sillanpää, M. (2013). “Adsorption behavior of hydrothermally treated municipal sludge & pulp and paper industry sludge,” Bioresource Technol. 147, 71-76. DOI: 10.1016/j.biortech.2013.08.034
Arpiainen, V., and Wilen, C. (2014). “Report on optimisation opportunities by integrating torrefaction into existing industries (Deliverable No. 3.2),” The European FP7 project SECTOR (Production of Solid Sustainable Energy Carriers from Biomass by Means of Torrefaction), (https://sector-project.eu/fileadmin/downloads/deliverables/
SECTOR_D3.2_VTT__final.pdf), Accessed 11 Sept 2017.
Bajpai, P. (2015). Management of Pulp and Paper Mill Waste, Springer, Cham, Switzerland. DOI: 10.1007/978-3-319-11788-1
Bergman, P. C., Boersma, A., Zwart, R., and Kiel, J. (2011). Torrefaction for Biomass Co-firing in Existing Coal-fired Power Stations (Report No. ECN-C-05-013), Energy Research Centre of Netherlands, Petten, Netherlands.
Bowman, J., Davidson, M., Penterson, J., and Toupin, K. (2009). “Biomass combustion technologies, a comparison of a biomass 50 MW modern stoker fired system and a bubbling fluidized bed system,” in: POWER-GEN International, Las Vegas, NV, USA.
Brammer, J., and Bridgwater, A. (1999). “Drying technologies for an integrated gasification bio-energy plant,” Renew. Sust. Energ. Rev. 3(4), 243-289. DOI: 10.1016/S1364-0321(99)00008-8
Difs, K., Wetterlund, E., Trygg, L., and Söderström, M. (2010). “Biomass gasification opportunities in a district heating system,” Biomass. Bioenerg. 34(5), 637-651. DOI: 10.1016/j.biombioe.2010.01.007
Dittus, F., and Boelter, L. (1985). “Heat transfer in automobile radiators of the tubular type,” Int. Commun. Heat. Mass. 12(1), 3-22. DOI: 10.1016/0735-1933(85)90003-X
Eagle, A., and Ferguson, R. (1930). “On the coefficient of heat transfer from the internal surface of tube walls,” P. Roy. Soc. A-Math Phy. 127(806), 540-566. DOI: 10.1098/rspa.1930.0076
Environmental Protection Agency (EPA) (2007). “Biomass combined heat and power, catalog of technologies,” U. S. Environmental Protection Agency, Combined Heat and Power Partnership, (https://www.epa.gov/chp/biomass-chp-catalog-technologies), Accessed 20 Sept 2017.
Erlach, B., Wirth, B., and Tsatsaronis, G. (2011). “Co-production of electricity; heat and biocoal pellets from biomass: A techno-economic comparison with wood pelletizing,” in: Proceedings of World Renewable Energy Congress – Sweden, Linköping, Sweden, pp. 508-515. DOI: 10.3384/ecp11057508
Erlach, D. B. (2014). Biomass Upgrading Technologies for Carbon-Neutral and Carbon-Negative Electricity Generation, Ph.D. Dissertation, Technische Universität, Berlin, Germany.
Fagernäs, L., Brammer, J., Wilén, C., Lauer, M., and Verhoeff, F. (2010). “Drying of biomass for second generation synfuel production,” Biomass. Bioenerg. 34(9), 1267-1277. DOI: 10.1016/j.biombioe.2010.04.005
Funke, A., and Ziegler, F. (2011). “Heat of reaction measurements for hydrothermal carbonization of biomass,” Bioresource Technol. 102(16), 7595-7598. DOI: 10.1016/j.biortech.2011.05.016
Gao, Y., Yu, B., Wu, K., Yuan, Q., Wang, X., and Chen, H. (2016). “Physicochemical, pyrolytic, and combustion characteristics of hydrochar obtained by hydrothermal carbonization of biomass,” BioResources 11(2), 4113-4133. DOI: 10.15376/biores.11.2.4113-4133
Gupta, M., Yang, J., and Roy, C. (2003). “Specific heat and thermal conductivity of softwood bark and softwood char particles,” Fuel 82(8), 919-927. DOI: 10.1016/S0016-2361(02)00398-8
Harada, T., Hata, T., and Ishihara, S. (1998). “Thermal constants of wood during the heating process measured with the laser flash method,” J. Wood Sci. 44(6), 425-431. DOI: 10.1007/BF00833405
Hoekman, S. K., Broch, A., and Robbins, C. (2011). “Hydrothermal carbonization (HTC) of lignocellulosic biomass,” Energ. Fuel. 25(4), 1802-1810. DOI: 10.1021/ef101745n
Hoekman, S. K., Broch, A., Robbins, C., Zielinska, B., and Felix, L. (2013). “Hydrothermal carbonization (HTC) of selected woody and herbaceous biomass feedstocks,” Biomass Conversion and Biorefinery 3(2), 113-126. DOI: 10.1007/s13399-012-0066-y
Hoekman, S. K., Broch, A., Felix, L., and Farthing, W. (2017). “Hydrothermal carbonization (HTC) of loblolly pine using a continuous, reactive twin-screw extruder,” Energy Conversion and Management, 134, 247-259. DOI: 10.1016/j.enconman.2016.12.035
Holmström, P. (1982). Lauhduttimet: Teoria ja käytäntö [Condensers: Theory and Practice], Sonator, Tampere, Finland.
Hu, B., Wang, K., Wu, L., Yu, S., Antonietti, M., and Titirici, M. (2010). “Engineering carbon materials from the hydrothermal carbonization process of biomass,” Adv. Mater. 22(7), 813-828. DOI: 10.1002/adma.200902812
Ilic, D. D., Dotzauer, E., and Trygg, L. (2012). “District heating and ethanol production through polygeneration in Stockholm,” Appl. Energ. 91(1), 214-221. DOI: 10.1016/j.apenergy.2011.09.030
Jin, F., and Enomoto, H. (2009). “Hydrothermal conversion of biomass into value-added products: Technology that mimics nature,” BioResources 4(2), 704-713. DOI: 10.15376/biores.4.2.704-713
Jüdes, M., Vigerske, S., and Tsatsaronis, G. (2009). “Optimization of the design and partial-load operation of power plants using mixed-integer nonlinear programming,” in: Optimization in the Energy Industry, J. Kallrath, P. M. Pardalos, S. Rebennack, and M. Scheidt (eds.), Springer, Berlin, Germany. DOI: 10.1007/978-3-540-88965-6_9
Kambo, H. S., and Dutta, A. (2014). “Strength, storage, and combustion characteristics of densified lignocellulosic biomass produced via torrefaction and hydrothermal carbonization,” Appl. Energ. 135, 182-191. DOI: 10.1016/j.apenergy.2014.08.094
Kludze, H., Deen, B., and Dutta, A. (2013). “Impact of agronomic treatments on fuel characteristics of herbaceous biomass for combustion,” Fuel Process. Technol. 109, 96-102. DOI: 10.1016/j.fuproc.2012.09.043
Koch, P. (1968). “Specific heat of oven dry spruce, pine wood and bark,” Wood Sci. 1(4), 203-214.
Kohl, T., Laukkanen, T., Järvinen, M., and Fogelholm, C. (2013). “Energetic and environmental performance of three biomass upgrading processes integrated with a CHP plant,” Appl. Energ. 107, 124-134. DOI: 10.1016/j.apenergy.2013.02.021
Kohl, T., Teles, M., Melin, K., Laukkanen, T., Järvinen, M., Park, S. W., and Guidici, R. (2015). “Exergoeconomic assessment of CHP-integrated biomass upgrading,” Appl. Energ. 156, 290-305. DOI: 10.1016/j.apenergy.2015.06.047
Komulainen, S. (2012). Voimalaitoksen Käytönaikaisen Optimoinnin Määrittely [Run-time Optimization of a Power Plant], Master’s Thesis, Lappeenranta University of Technology, Lappeenranta, Finland.
Koppejan, J., Sokhansanj, S., Melin, S., and Madrali, S. (2012). Status Overview of Torrefaction Technologies, IEA Bioenergy Task 32, Enschede, Netherlands.
Libra, J. A., Ro, K. S., Kammann, C., Funke, A., Berge, N. D., Neubauer, Y., Titirici, M., Fühner, C., Bens, O., Kern, J., and Emmerich, K. (2011). “Hydrothermal carbonization of biomass residuals: A comparative review of the chemistry, processes and applications of wet and dry pyrolysis,” Biofuels2(1), 71-106. DOI: 10.4155/bfs.10.81
Lieskovský, M., Jankovský, M., Trenčiansky, M., Merganič, J., and Dvořák, J. (2017). “Ash content vs. the economics of using wood chips for energy: Model based on data from central Europe,”BioResources 12(1), 1579-1592. DOI: 10.15376/biores.12.1.1579-1592
Ramke, H., Blöhse, D., Lehmann, H., and Fettig, J. (2009). “Hydrothermal carbonization of organic waste,” in: Proceedings of the 12th International Waste Management and Landfill Symposium, Cagliari, Sardinia, Italy.
Ramke, H., Blöhse, D., Lehmann, H., and Fettig, J. (2010). “Hydrothermale carbonisierung organischer siedlungsabfälle [Hydrothermal carbonization of organic municipal waste],” in: Bio-und Sekundärrohstoffverwertung V, K. Wiemer and M. Kern (eds.), Witzenhausen-institut, Witzenhausen, Germany.
Rautalin, A., and Wilén, C. (1992). Feeding Biomass into Pressure and Related Safety Engineering(Report No. VTT-TIED-1428), VTT Technical Research Centre of Finland, Espoo, Finland.
Reza, M. T., Uddin, M. H., Lynam, J. G., and Coronella, C. J. (2014). “Engineered pellets from dry torrefied and HTC biochar blends,” Biomass. Bioenerg. 63, 229-238. DOI: 10.1016/j.biombioe.2014.01.038
Sanders, W. P. (2004). Turbine Steam Path Vol. 3a – Mechanical Design and Manufacture, PennWell, Tulsa, OK, USA.
Sermyagina, E., Saari, J., Kaikko, J., and Vakkilainen, E. (2015a). “Hydrothermal carbonization of coniferous biomass: Effect of process parameters on mass and energy yields,” J. Anal. Appl. Pyrol. 113, 551-556. DOI: 10.1016/j.jaap.2015.03.012
Sermyagina, E., Saari, J., Zakeri, B., Kaikko, J., and Vakkilainen, E. (2015b). “Effect of heat integration method and torrefaction temperature on the performance of an integrated CHP-torrefaction plant,” Appl. Energ. 149, 24-34. DOI: 10.1016/j.apenergy.2015.03.102
Sevilla, M., Maciá-Agulló, J. A., and Fuertes, A. B. (2011). “Hydrothermal carbonization of biomass as a route for the sequestration of CO2: Chemical and structural properties of the carbonized products,” Biomass. Bioenerg. 35(7), 3152-3159. DOI: 10.1016/j.biombioe.2011.04.032
Skaar, C. (1988). Wood-Water Relations, Springer-Verlag, Berlin, Germany. DOI: 10.1007/978-3-642-73683-4
Starfelt, F., Daianova, L., Yan, J., Thorin, E., and Dotzauer, E. (2012). “The impact of lignocellulosic ethanol yields in polygeneration with district heating – A case study,” Appl. Energ. 92, 791-799. DOI: 10.1016/j.apenergy.2011.08.031
Starfelt, F., Thorin, E., Dotzauer, E., and Yan, J. (2010). “Performance evaluation of adding ethanol production into an existing combined heat and power plant,” Bioresource Technol. 101(2), 613-618. DOI: 10.1016/j.biortech.2009.07.087
Stemann, J., Putschew, A., and Ziegler, F. (2013). “Hydrothermal carbonization: Process water characterization and effects of water recirculation,” Bioresource Technol. 143, 139-146. DOI: 10.1016/j.biortech.2013.05.098
Stemann, J., and Ziegler, F. (2011). “Assessment of the energetic efficiency of a continuously operating plant for hydrothermal carbonisation of biomass,” in: Proceedings of World Renewable Energy Congress – Sweden, Linköping, Sweden, pp. 125-132. DOI: 10.3384/ecp11057125
TenWolde, A., McNatt, J. D., and Krahn, L. (1988). Thermal Properties of Wood and Wood Panel Products for use in Buildings (Report No. ORNL/Sub-87-21697/1), Oak Ridge National Laboratory, Oak Ridge, TN, USA.
Traupel, W. (1966). Thermische Turbomaschinen: 1. Thermodynamisch-Strömungstechnische Berechnung [Thermal Turbomachinery: 1. Thermodynamic and Fluid Dynamics Calculations], Springer-Verlag, Berlin, Federal Republic of Germany.
Tveit, T.-M., Savola, T., and Fogelholm, C. (2005). “Modelling of steam turbines for mixed integer nonlinear programming (MINLP) in design and off-design conditions of CHP plants,” in: Proceedings of the 46th Conference on Simulation and Modeling (SIMS 2005), Trondheim, Norway.
Wahlund, B., Yan, J., and Westermark, M. (2002). “A total energy system of fuel upgrading by drying biomass feedstock for cogeneration: A case study of Skellefteå bioenergy combine,” Biomass. Bioenerg. 23(4), 271-281. DOI: 10.1016/S0961-9534(02)00055-7
Vallejos, M. E., Felissia, F. E., and Area, M. C. (2017). “Hydrothermal treatments applied to agro- and forest-industrial waste to produce high added-value compounds,” BioResources 12(1), 2058-2080. DOI: 10.15376/biores.12.1.Vallejos
Van der Stelt, M., Gerhauser, H., Kiel, J., and Ptasinski, K. (2011). “Biomass upgrading by torrefaction for the production of biofuels: A review,” Biomass. Bioenerg. 35(9), 3748-3762. DOI: 10.1016/j.biombioe.2011.06.023
Verhoeff, F., Arnuelos, A. A., Boersma, A. R., Pels, J. R., Lensselink, J., Kiel, J. H. A., and Schukken, H. (2011). Torrefaction Technology for the Production of Solid Bioenergy Carriers from Biomass and Waste (Report No. ECN-E-11-039), Energy Research Centre of the Netherlands, Petten, Netherlands.
Yan, W., Hastings, J. T., Acharjee, T. C., Coronella, C. J., and Vásquez, V. R. (2010). “Mass and energy balances of wet torrefaction of lignocellulosic biomass,” Energ. Fuel. 24(9), 4738-4742. DOI: 10.1021/ef901273n
Zhou, W., Yang, H., Rissanen, M., Nygren, B., and Yan, J. (2012). “Decrease of energy demand for bioethanol-based polygeneration system through case study,” Appl. Energ. 95, 305-311. DOI: 10.1016/j.apenergy.2012.02.014
Žukauskas, A. (1987). “Heat transfer from tubes in crossflow,” Advances in Heat Transfer 18, 87-159. DOI: 10.1016/S0065-2717(08)70118-7
Article submitted: December 1, 2017; Peer review completed: January 28, 2018; Revised version received: April 6, 2018; Accepted: April 7, 2018; Published: May 15, 2018.
DOI: 10.15376/biores.13.3.5080-5110
Appendix A. Process schemes and main operating parameters
Case 0

Main operating parameters

Case 1

Main operating parameters

Case 2

Main operating parameters

Case 3

Main operating parameters

Case 4

Main operating parameters

Case 5

Main operating parameters

Case 6

Main operating parameters
