
Abstract
Changes in the air permeability and density profiles of 12-mm-thick oriented strand board (OSB) specimens were evaluated in relation to changes in their moisture content. The test methodology consisted of the simulation of real conditions that may occur during construction. Using a water bath, the OSB moisture content was increased from 10% to 17%, and the consequent changes in the air permeability and vertical density profile (VDP) were analyzed. The air permeability and VDP were then reanalyzed after acclimatization of the OSB to a balanced moisture content at 60% relative air humidity and 11.4 °C. After wetting the boards with an initial moisture content of 10% for 2 h and naturally re-drying them in laboratory conditions, an average increase of 11.7% in air permeability was observed. The increase in air permeability was 5.6% with a pressure difference of 50 Pa. After redrying, the boards showed a 1.1% lower average density and 14.5% lower maximum density in the surface layers. From the results, it followed that even the short-term effects of water and the related increase in moisture content of the OSB had a negative impact on the air permeability and VDP.
Download PDF
Full Article
Effect of Moisture Content on the Air Permeability of Oriented Strand Boards
Matěj Hodoušek,a,* Martin Böhm,a Anna Součková,b and Štěpán Hýsek a
Changes in the air permeability and density profiles of 12-mm-thick oriented strand board (OSB) specimens were evaluated in relation to changes in their moisture content. The test methodology consisted of the simulation of real conditions that may occur during construction. Using a water bath, the OSB moisture content was increased from 10% to 17%, and the consequent changes in the air permeability and vertical density profile (VDP) were analyzed. The air permeability and VDP were then reanalyzed after acclimatization of the OSB to a balanced moisture content at 60% relative air humidity and 11.4 °C. After wetting the boards with an initial moisture content of 10% for 2 h and naturally re-drying them in laboratory conditions, an average increase of 11.7% in air permeability was observed. The increase in air permeability was 5.6% with a pressure difference of 50 Pa. After redrying, the boards showed a 1.1% lower average density and 14.5% lower maximum density in the surface layers. From the results, it followed that even the short-term effects of water and the related increase in moisture content of the OSB had a negative impact on the air permeability and VDP.
Keywords: Air permeability; Moisture content; Oriented strand board (OSB); Vertical density profile
Contact information: a: Department of Wood Products and Wood Constructions, Czech University of Life Sciences Prague, Kamýcká 129, 165 21 Praha-Suchdol, Czech Republic; b: Timber Research and Development Institute, Prague, s.e., Na Florenci 7-9, 111 71, Prague 1;
* Corresponding author: hodousek@fld.czu.cz
INTRODUCTION
Oriented strand board (OSB) is a material made from large, flat strands of wood, where the outer layers strands are oriented parallel to the long edge of the board or to the production line, and the core layer is often formed by smaller strands oriented at right angles to the outer layers (Irle et al. 2012). The outer layers, mostly compressed to higher density, ensure the major mechanical and physical properties of the boards. Manufacturing is optimized by the correct setting of production factors such as pressing time, pressure, and step-closing time. OSB is made from wooden flakes that are not so easy to compress as medium density fiberboard (MDF). Compared to MDF manufacturing, the step-closing schedules are commonly used for better densification of OSB, while their use for MDF manufaturing could be useful for MDF density profile manipulation (Wang et al. 2001). The plasticization and further densification of the flakes are the factors that require the step-closing schedules (Wang et al. 2004). The geometry and arrangement of the strands in the surface layers are also important factors. By correctly setting these production factors, a horizontal density profile (HDP) and vertical density profile (VDP) are created (Strickler 1959; Suchsland 1962; Winistorfer and Wang 1999; Wolcott et al. 2007). The VDP is mainly the result of the press closing process, where the surface layers show a higher density than the middle layers. It was experimentally ascertained that boards with M-shaped VDPs have suitable mechanical and physical properties. The moisture content (MC) and the orientation of the strands in the surface layers have a notable impact on the formation of the VDP. A higher moisture content in surface layers results in the achievement of a higher maximum density (Andrews et al. 2001). By increasing the moisture content of the core layer, it is possible to reverse the VDP (Heebink et al. 1972). García et al. (2008) stated that strand mats with a lower strand arrangement level exhibit a more balanced VDP. Another significant factor that influences the VDP is press speed and its combination with the MC of the layer. Higher press speed combined with high MC of the layer result in higher thicknes swelling of the layer (Candan et al. 2012).
Thickness swelling occurs during the reaction of moisture on a finished OSB. Higher percentages of thickness swell occur in surface layers that have a higher density. Wang and Winistorfer (2002, 2003) tested 12-mm-thick OSBs and revealed that swelling occurs to a greater extent (74%, 64%, and 57%) in the surface layers that comprise only 39% of the total sectional thickness of the board. The air permeability of the samples of particleboard was tested by Langmans et al. (2010a) with the application of a known quantity of water for a short time period in order to simulate rain. The air permeability measured after the application of the water was approximately half compared to the measurement of the dry state. After 30 min, the air permeability had 91% to 96% of the air permeability of the dry state. This experiment only studied very short and mild exposure to moisture, which could not penetrate the paraffin layer, resulting in zero swelling or change in the VDP. During longer exposure to moisture, the paraffin impregnation fails and the board swells, which is the main assumption of this paper. According to Adcock and Irle (1997), wood cells with a higher density have a greater swelling potential. Thickness swell reduces density, and this phenomenon is more significant in higher density areas. As such, the reduction of mechanical and physical properties on the basis of swelling is notably influenced by changes in the VDP (River 2003; Xu and Winistorfer 2007). Thus, swelling occurs more in the surface layers, which ensure the air impermeability of the board. Thickness swell is associated with the loss of the mechanical properties of composite materials (Suchsland 1973; Alexopoulos 1992; Wu and Piao 1999; River 2003), which is associated with increased inherent stress in the board that arises from the impact of the various swelling rates of the materials from which it is made. For strand boards, this phenomenon has been described as the straightening of wood parts (Halligan 1970; Fan et al. 2009). The strands, which are compressed and subsequently exposed to higher humidity, swell and naturally regain their initial shape. This changes their location inside the board, and these changes cause stress in the board that disrupts the bond between the glue and wooden components (Medved et al. 2006).
Air permeability, as a physical property of OSB, is strongly dependent on its manufacturing process. Taking into account that OSB is made by pressing strands of wood together, there are still some gaps allowing air to flow. This determining factor of air permeability is porosity (Al-Hussainy et al. 2013). The porosity is influenced more by thichness of the strands than by other geometric factors (Dai et al. 2005), but in general, the smaller the strands, the smaller the gaps between them (Kruse et al. 2000), which opens the possibility to decrease the air permeability by adding a small fraction into the carpet. This leads to significant decrease of carpet permeability during production (Fakhri et al. 2006). Other factors that affect the air permeability are pressure difference (Kumaran et al.2003) or different manufacturers (Langmans et al. 2010b).
The OSB/3-type board is intended for use in humid conditions where the humidity of the ambient air exceeds 85% for only a few weeks per year, according to standard EN 300 (2006). Companies that offer the construction of wooden buildings in the Czech Republic claim a construction time ranging from three weeks to several months, and the building materials are exposed to natural elements for a certain part of this period. Due to the fact that the individual parts of the building are not yet duly integrated in the building and insulated from the exterior environment, they may absorb moisture. It often occurs that the building material is exposed to a step increase in moisture content from rain. Due to the hysteresis of wood absorption, it is necessary to consider the fact that these step changes in moisture may fundamentally change the properties of the wooden materials used in the building.
The goal of this paper is to determine the differences in the air permeability of the boards after an increase in moisture content and re-drying, and to determine the changes in the VDP.
EXPERIMENTAL
Materials
The board most commonly used for building purposes, the 12-mm-thick OSB/3, was selected for air permeability testing and VDP determination. The boards were obtained from the local manufacturer of this material. The characteristics of the boards are given in Table 1.
The wood strands used to make the boards were graded using a sieve with eye dimensions of 3.5 mm × 30 mm and the ratio of the centre wood strands/surface wood strands was 50/50.
Methods
All of the test samples had a format of 1250 mm × 2500 mm, which was also the production format. The test samples were acclimatized in the environment in which the test was performed (11.4 °C, 60% relative air humidity). The air conditions were chosen according to the air conditions during the early winter, which is the most common period for construction in Central Europe. The air permeability test was conducted on five samples.
The first test was performed on the sample acclimatized to ambient temperature, after which it was exposed to higher humidity in a dip basin. Wetting was performed via submersion of all of the test samples in water for 2 h and subsequent conditioning. One additional board was placed with the rest of the boards to ascertain the VDP in order to verify the assumption that VDP changes with a change in OSB humidity, subsequently impacting air permeability. The VDP was determined using the compact X-ray density profile analyzer – DPX300-LTE (Imal, Modena, Italy), which works on the principle of weakening the energy passing through layers of material with different densities. This method is suitable for the determination of the density profile of the material (Winistorfer et al. 1986).
Six test samples of 50 mm × 50 mm were taken from one board according to EN 326-1 (1997), and the average behaviour of the VDP was determined. During wetting, the average adsorption was 10.4 g of water. The VDP was then measured again on a wet sample.
Table 1. Production Characteristics of the OSB/3 Test Sample

The test samples were exposed to many graduated pressure differences (positive and negative) and the air-flow volume achieved for each pressure difference was measured. The maximum pressure achieved was 600 Pa and the minimum pressure was 50 Pa. After clamping the sample in the test chamber with a clamping jig, overpressure differences of the following values were achieved in the chamber: 50 Pa, 100 Pa, 150 Pa, 200 Pa, 250 Pa, 300 Pa, 450 Pa, and 600 Pa (∆pmax). The pressure differences were applied according to the test method of EN 12114. At each pressure difference value, the air-flow volume in m3/h was measured. The same procedure was used for negative pressure. For this purpose, the airtight chamber commonly used for commercial tests and for the purposes of previous studies (Hodousek et al. 2015) was used. The chamber scheme is shown in Fig. 1.
This was followed by increasing the moisture content by submerging the boards in water for 2 h. The water was subsequently drained and the boards were loosely covered with polyvinyl chloride (PVC) film for 48 h to balance the moisture content in the sample. This process was intended to simulate the building construction process where the opened package of boards is exposed to rain for a short time, after which it is left to rest for a while, and only later are the boards removed and integrated in the building. The average water absorption was 1.4 kg per board with dimensions of 1250 mm × 2500 mm (0.45 kg/m2, average MC 17.4%) and 10.4 g of water per test sample with dimensions of 50 mm × 50 mm (average MC 67.9%). The difference between absorption of the big and small specimens during the same time period is caused by the edge effect when water enters into the board through the edges where the water sorption is higher (Gu et al. 2005). The MC was determined using the oven dry method (EN 13183-1). The air permeability and VDP of the wet samples were measured.

Fig. 1. Testing apparatus used for the air permeability test (EN 12114)
The boards were then left to rest in open air with adequate mutual spacing so that air could flow between them. The average environmental conditions were 10.3 °C, 60% relative humidity and 965 hPa atmospheric pressure. After stabilisation of the board weight at the initial value, the air permeability and VDP were measured again using a procedure similar to the one described above. All of the measured values were converted to reference conditions as stipulated in EN 12114 (2001) according to the following equations,
![]()
where  is the volume air-flow related to the reference conditions (m3/h),
  is the volume air flow measured in laboratory conditions (m3/h),
  is the air density in reference conditions (1.1988 kg/m3), and
  is the air density in laboratory conditions (kg/m3), calculated from the relationship,

where  is atmospheric pressure (Pa), T is the thermodynamic temperature (K), and
  is the partial pressure of water vapour (Pa), calculated from Eq. 3,

where  is relative air humidity (%).
The measured and calculated values were subjected to statistical analysis in Statistica 12 software (StatSoft, Palo Alto, CA, USA). Statistically significant differences between the air permeability of samples before and after wetting were determined by an analysis of variance (ANOVA) with a significance level of 0.05 and by Tukey’s honest significant difference test.
RESULTS AND DISCUSSION
The OSB/3 boards were tested for air permeability according to the above-mentioned conditions. The average air permeability values calculated for 1 m2 of board are given in Table 2, including the variable coefficient for each group.
Table 2. Average Air Permeability*Note: COV- Coefficient of variation; V0– Air permeability of boards with a relative humidity of 10% before wetting with water; Vw– Air permeability measured after removal from the water bath and conditioning of the boards; V1– Air permeability of the boards after wetting with water and redrying to 10% moisture content
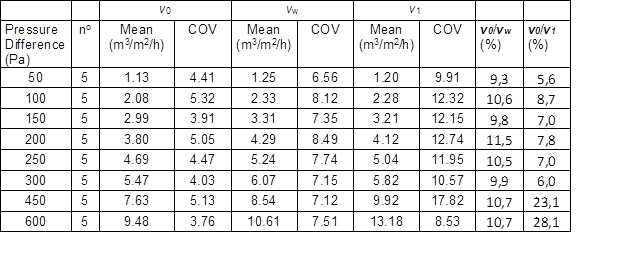
As expected, the lowest air permeability values were measured in all samples before wetting. A somewhat higher air permeability was characteristic of the samples in the final stage. The highest air permeability was characteristic of the samples measured immediately after removal from the water bath and conditioning. The second column from the right of Table 2 shows the percentage difference in the air permeability of the wet boards compared to the dry boards. The last column shows the difference between the air permeability of the boards after wetting and redrying to 10% moisture content and the boards with 10% air humidity before wetting. The average difference in the air permeability for all air pressure differences between the boards measured before wetting and the wet boards was 10.4%. The average difference between the boards with a relative air humidity of 10% before and after wetting and re-drying to 10% moisture content was 11.7%. However, the average in the second case was heavily influenced by the last two values, as the air permeabilities at the pressure differences of 450 Pa and 600 Pa increased dramatically compared to the previous levels. When the last two levels were excluded, the average air permeability difference was 7.6%.
Figure 2 shows the averages with a 95% interval of reliability for the individual groups and pressure differences. The air permeability of the sample was always lowest before wetting. For pressure differences from 50 Pa to 300 Pa, the lowest air permeability was measured in the tested sample immediately after wetting in water. The results of the dried sample after wetting were between these two values. For pressure differences (450 Pa to 600 Pa), the opposite behaviour was observed, as the highest air permeability exhibited by the samples dried to 10% of the MC after wetting. Upon inclusion of all values in the statistical analysis, it was determined with the ANOVA test and subsequent Tukey’s honest significant difference (HSD) test that both groups measured after wetting in water significantly differed from the sample measured prior to wetting (the p-values of the Tukey test were 0.0007 and 0.0002), but they did not exhibit a significant statistical difference between them.

Fig. 2. Graph of averages with a 95% interval of reliability of the measured air permeability data for the sample before and after the water bath (WB), and for all pressure differences
The increasing variance of the measured values with rising pressure difference was also observed, which is confirmed by past studies relating to air permeability (Hodoušek et al. 2014). Within the framework of one pressure difference, it is also possible to observe an increase in the variance in the wet samples, and even a somewhat higher variance in the values of samples that were dried after wetting compared to the initial sample prior to wetting. The relationships between the groups were similar for pressure differences from 50 Pa to 300 Pa. In this range, mainly the variances increased with increased pressure. Below is a separate graph (Fig. 3) for the pressure difference of 50 Pa. The behaviour of the values in Fig. 2 suggested that for the duration of the submersion of the sample in water, the wood swelled, the strands moved apart, and the bonds between them were disrupted. During the drying process, they returned to their place but the cohesion between them was already weakend. The bonds were broken, and new air gaps were partially covered. At low pressures, the air permeability was influenced mainly by pre-existing expanded air gaps. However, the air permeating at higher pressures (450 Pa and 600 Pa) had adequate force to unblock new, smaller air gaps, which increased the air permeability.
Figure 3 shows the box plot for a pressure of 50 Pa, including the average values for each group. The y-axis shows the air permeability values converted to 1 Pa of pressure difference. The air permeability values in this pressure difference that were representative of the pressure differences up to 300 Pa clearly rose 9.3% after wetting of the sample with water. Upon returning to the initial MC, the sample had a value that was 5.6% higher than the initial value (Table 2). The ANOVA test in Statistica software did not prove a significant difference between these three phases. The conversion to 1 Pa was done for the purpose of comparison with other studies. Langmans et al. (2010a) compared the achieved air permeability results with the limit for passive houses, which they experimentally set to 0.015 m3/m2/h/Pa. The certification label ‘passive house’ serves as a low energy consumption proof of the building (Feist et al. 2005). This limit was evidently too low even for the samples before wetting. To comply with this limit, it would be necessary to apply a surface treatment or combination with another material, which would lower the air permeability by 38% in the sample after wetting.

Fig. 3. Graph of the ANOVA of airflow for the pressure difference of 50 Pa
Measurement of VDP
In order to verify the change in density, the VDP was measured in one of the boards. The density profile was measured in parallel with the air permeability in all phases of the experiment (10% MC before wetting, after 2 h in WB, and 10% MC after wetting and redrying). The results showed that the change in moisture content influenced VDP, even after redrying to the initial moisture content. The aggregate values of changes in the density and thickness are shown in Table 3. The thickness, average density, maximum density, minimum density, and air permeability (K, which expressed the airflow per 1 Pa of pressure difference) are also shown. For comparison, the modulus of elasticity (MOE) value was given, which was also measured in the OSB 3 mm to 12 mm board under the same humidity conditions (Böhm 2009).
Table 3 shows that the board’s physical and mechanical properties changed with increased OSB moisture content and changes in thickness and density of the small (50 x 50 mm) sample. It was clear that under the same humidity conditions, the changes in air permeability were not as significant as the changes in MOE. After a 1.7% change in thickness due to non-recoverable thickness swelling (NTS) and a 1.1% drop in density, the air permeability increased 11.6% and MOE dropped 40.7%. This illustrated that air permeability was influenced by changes in the OSB due to a higher MC to a somewhat lesser extent than MOE.
Table 3. Aggregate Table of the Comparison of Changes in the OSB Physical and Mechanical Properties before and after Wetting

K – Airflow recalculated for 1 Pa of pressure difference; * Values measured on the air permeability sample (1250 x 2500 mm); ** Values obtained by Böhm (2009)
Upon redrying the wet sample, a higher thickness was measured. The weight was the same and the average density changed, which corresponds to wood moisture sorption hysteresis (Böhm 2009; Pavlík et al. 2012). This supported the assumption that the inner density distribution (VDP) must also change. Figure 4 shows the behaviour of density across a thick sample in the individual measurement phases.

Fig. 4. Changes in VDP upon wetting an OSB
The dotted line indicates the sample before wetting with water with 10% moisture content (adsorption). The full line indicates the results for the sample after wetting in water and redrying to 10% moisture content (desorption). Figure 4 clearly shows the fundamental differences between these two phases. There was an increase in the total thickness of the sample and a drop in the average density. On average, the maximum density of the surface layers dropped 14.5%. Figure 4 was plotted from the average values of all 6 measured test samples in all phases of the experiment. It can be said that the outer areas of the sample retained a similar density in a wet state and in the state before wetting. The major change occurred in the core layer, whose density curve was inverse to the curve of the dry samples. Similar inversion of the density profile is described by Heebing et al. (1972) in the manufacturing of strand boards, where the core layers had a higher initial moisture content than the surface layers. The current study proves that this inversion of VDP also applies to the increase of the moisture content of an already-manufactured board in its entire cross-section.
On the basis of the measurement of the air permeability of the OSBs, it was ascertained that this variable was closely related to the moisture content and sorption properties of the OSB material. In the study by Langmans et al. (2010a), a known volume of water was applied to the board surface using a pulveriser, temporarily reducing the air permeability to approximately half. In this case, the water functioned as a filling for the air gaps, and no other phenomena related to water absorption were considered. During longer exposure, the paraffin layer on the board surface partially fails, and in such a case the water may also enter the board through the edges. The experiment described above was intended to simulate the situation on building sites where the OSBs are being installed and rain falls on them. In such conditions, water might get into the packages, which may be partly absorbed by the boards before their final installation in the building. This experiment proved that the absorption of 0.45 kg/m2 of water in a 12-mm-thick OSB/3 increased air permeability. Air permeability was measured in three phases: 10% MC before wetting, immediately after wetting, and 10% MC after wetting and natural redrying. The air permeability of a wet sample was on average 10.4% higher than the initial sample. Air permeability of the sample measured after wetting and natural redrying was 7.6% higher than the initial sample, excluding high pressures. Including the high pressures, the sample measured after wetting and natural redrying was 11.7% higher. After conversion to 1 Pa, this difference was 11.6%.
The major portion of the increase in air permeability was due to the swelling of wood, which disrupted the bonds between the strands and the glue. The disruption of bonds has been described with regard to the deterioration of some mechanical properties of the board by Medved et al. (2006). However, the deterioration of the air permeability is not as noteworthy as the deterioration of the other mechanical properties of the OSBs. For example, MOE dropped up to 40.7% under the same humidity conditions (Böhm 2009). An increase in the variance of measured values was also observed and the highest variance was recorded in the re-dried sample.
During the testing of the density profile, it was ascertained that its behaviour depended upon the moisture content and sorption properties of the wood. It was already known that there is a close relationship between VDP and wood moisture content. Cai (2008) presented a method for the determination of the moisture content of solid wood using VDP results measured with a device that functions on the principle of x-ray radiation. Other authors describe how VDP is influenced by various modifications during the manufacture of the boards (Heebink et al. 1972; Andrews et al. 2001; García et al. 2008). This article monitored changes in the VDP during various moisture content phases of the OSBs. The VDP was monitored in all phases of determination of the air permeability: the initial phase (10% MC absorption), the wet sample phase (immediately after 2 h in water and stabilization of moisture content), and the final phase (10% of MC desorption). Changes in the average density and VDP behaviour were recorded. The sample measured after wetting and re-drying to 10% MC had a density of 12.2% (small sample) and 1.1% (big sample) lower than the sample measured at 10% MC before wetting. Furthermore, a drop of 14.5% in maximum density for 10% MC was observed in the small sample. The maximum density in VDP is found at the edges of the board, which contributes to major effects on mechanical and physical properties (Kelly 1977). If these outer layers are exposed to higher humidity, they swell and lose their properties (Wu and Piao 1999; Wu and Suchsland 2007). Upon the swelling of these layers, inner tension occurs, which may disrupt the adhesive forces between the binder and strands (Song 1996), thereby creating new air gaps.
The erection process of column wooden buildings often takes several days, as various interdependent operations take place during this process. If the OSB is exposed to rain during the prcess and is not yet fully integrated into the building (including all insulation, seals, and covers), it may absorb a disproportionate volume of water and lose its mechanical and physical properties due to swelling and changes in VDP. If such a board is installed in the building, its deteriorated properties, such as air permeability, may result in its classification in a lower energy class during final inspection of the air permeability of the shell. In addition, the heating costs and other related costs could be higher. The results indicated that even the short-term action of water and the related increase in moisture content of the OSB had a negative impact on the air permeability and transverse density profile. For this reason, this material must be treated consistently on the building site according to EN standards, and it is essential to ensure that relative air humidity does not rise above 85%.
CONCLUSIONS
- On the basis of laboratory tests, the moisture content increase of an OSB adversely affected its air permeability. Air permeability also increased with increased moisture content.
- The results showed that air permeability values in a sample that had been wetted increased 10.4% compared to the dry sample. The average increase in air permeability values for samples that were redried after wetting was 11.6%. An increase in the variability of the air permeability values was also observed. The highest variability was in the sample that was redried after wetting.
- By comparing the air permeability results with the results of the changes in mechanical properties performed by other authors, it was demonstrated that with the exception of high air pressures (≥ 450 Pa), the moisture content had a smaller effect on air permeability than on the mechanical properties.
- In order to achieve the theoretical limit for passive houses, it would be necessary to reduce the air permeability of the sample redried after wetting by 38%.
- By monitoring the changes in the VDP at various OSB moisture contents, the relationship between such changes and the air permeability of the board was discussed. After wetting, the board exhibited a lower maximum density in the outer areas, which were the main sources of the physical properties of the board. The numerical proof of this relation could be done in next study.
- The results of this study are particularly important for the wood frame housing industry, and they should lead to minimizing OSB exposure to moisture during construction in order to preserve the physical properties indicated by the manufacturer.
ACKNOWLEDGMENTS
The authors are grateful for the support of the Grant Agency of the Faculty of Forestry and Wood Sciences (Project No. B_04_17: “Advanced methods for modification of the physical and mechanical properties of particle boards”) and the Czech National Agency for Agricultural Research (Project No. QJ1530032).
REFERENCES CITED
Adcock, T., and Irle, M. (1997). “The effect of compaction ratio on the dimensional recovery of wood particles pressed perpendicular to the grain,” in: Proceedings of the First European Panel Products Symposium, Llandudno, Wales, UK, pp. 10-20.
Al-Hussainy, R., Ramey, H. J., and Crawford, P. B. (2013). “The flow of real gases through porous media,” Journal of Petroleum Technology 18(05), 624-636. DOI: 10.2118/1243-A-PA
Alexopoulos, J. (1992). “Accelerated aging and outdoor weathering of aspen waferboard,” Forest Products Journal 42(2), 15-22.
Andrews, C. K., Winistorfer, P. M., and Bennett, R. M. (2001). “The influence of furnish moisture content and press closure rate on the formation of the vertical density profile in oriented strandboard,” Forest Products Journal 51(5), 32.
Böhm, M. (2009). “The influence of moisture content on thickness swelling and modulus of elasticity in oriented strand board bending,” Wood Research 54(4), 79-90.
Cai, Z. (2008). “A new method of determining moisture gradient in wood,” Forest Products Journal 58(7-8), 41.
Candan, Z., Wang, S., Zhang, X., Akbulut, T., and Sisci, A.F. (2012). “Layer thickness swell characteristics of medium density fiberboard (MDF) panels affected by some production parameters,” Wood Research 57(3), 441-452.
Dai, C., Yu, C., and Zhou, X. (2005). “Heat and mass transfer in wood composite panels during hot pressing. Part II. Modeling void formation and mat permeability,” Wood and Fiber Science 37(2), 242-257.
EN 300 (2006). “Oriented strand boards (OSB) – Definitions, classification and specifications,” Czech Office for Standards, Metrology and Testing, Prague, Czech Republic.
EN 326-1 (1997). “Wood-based panels – Sampling, cutting and inspection – Part 1: Sampling and cutting of test pieces and expression of test results,” Czech Office for Standards, Metrology and Testing, Prague, Czech Republic.
EN 12114 (2001). “Thermal performance of buildings – Air permeability of building components and building elements – Laboratory test method,” Czech Office for Standards, Metrology and Testing, Prague, Czech Republic.
EN 13183-1 (2002). “Moisture content of a piece of sawn timber – Part 1: Determination by oven dry method,” Czech Office for Standards, Metrology and Testing, Prague, Czech Republic.
Fakhri, H. R., Semple, K. E., and Smith, G. D. (2006). “Permeability of OSB. Part I. The effects of core fines content and mat density on transverse permeability,” Wood and Fiber Science 38(3), 450-462.
Fan, M., Ohlmeyer, M., and Irle, M. (2009). Performance in Use and New Products of Wood Based Composites, Brunel University Press, London, UK.
Feist, W., Schnieders, J., Dorer, V., and Haas, A. (2005). “Re-inventing air heating: Convenient and comfortable within the frame of the Passive House concept,” Energy and Buildings 37(11), 1186-1203. DOI: 10.1016/j.enbuild.2005.06.020
García, P. J., Wang, S., and Moschier, W. W. (2008). “Moisture effects on in-situ vertical density profile monitoring during OSB hot-pressing,” Forest Products Journal 58(10), 47-51.
Gu, H., Wang, S., Neimsuwan, T., and Wang, S. (2005). “Comparison study of thickness swell performance of commercial oriented strandboard flooring products,” Forest Products Journal 55(12), 239-245.
Halligan, A. F. (1970). “A review of thickness swelling in particleboard,” Wood Science and Technology 4(4), 301-312. DOI: 10.1007/BF00386406
Heebink, B. G., Lehmann, W. F., and Hefty, F. V. (1972). Reducing Particleboard Pressing Time: Exploratory Study (Report No. FSRP-FPL-180), U.S. Department of Agriculture Forest Products Laboratory, Madison, WI.
Hodoušek, M., Böhm, M., Lemaster, R. L., Bureš, M., Beránková, J., and Cvach, J. (2014). “Air permeation rate of oriented strand boards (OSB/3 and OSB/4),” BioResources 10(1), 1137-1148. DOI:10.15376/biores.10.1.1137-1148
Irle, M. A., Barbu, M. C., Reh, R., Bergland, L., and Rowell, R. M. (2012). “10 Wood Composites,” Handbook of Wood Chemistry and Wood Composites, 321.
Kelly, M. W. (1977). Critical Literature Review of Relationship between Processing Parameters and Physical Properties of Particleboard (Report No. FPL-20), U.S. Department of Agriculture Forest Products Laboratory, Madison, WI.
Kruse, K., Dai, C., and Pielasch, A. (2000). “An analysis of strand and horizontal density distributions in oriented strand board (OSB),” Holz als Roh- und Werkstoff 58(4), 270-277. DOI: 10.1007/s001070050424.
Kumaran, M., Lackey, J., Normandin, N., Tariku, F., and van Reenen, D. (2003). “Variations in the hygrothermal properties of several wood-based building products,” Research in Building Physics – Proceedings of the 2nd CIB co-sponsored International Conference on Building Physics, Leuven, p. 10.
Langmans, J., Klein, R., de Paepe, M., and Roels, S. (2010a). “Potential of wind barriers to assure airtightness of wood-frame low energy constructions,” Energy and Buildings 42(12), 2376-2385. DOI: 10.1016/j.enbuild.2010.08.021
Langmans, J., Eykens, P., Klein, R., and Roels, S. (2010b). “Air permeability requirements for air barrier materials in passive houses – Comparison of the air permeability of eight commercial brands of OSB,” 5th International Symposium on Building and Ductwork Air-tightness, Copenhagen, p. 9.
Medved, S., Sernek, M., and Sega, B. (2006). “Thickness swelling and swelling pressure of wood-based panels curing. Wood resources and panel properties,” in: Conference Proceedings of the AIDIMAFurniture, Wood and Packaging Technology Institute, Valencia, Spain, pp.123-129.
Pavlík, Z., Žumár, J., Medved, I., and Černý, R. (2012). “Water vapor adsorption in porous building materials: Experimental measurement and theoretical analysis,” Transport in Porous Media 91(3), 939-954. DOI: 10.1007/s11242-011-9884-9
River, B. H. (2003). “Fracture of adhesive-bonded wood joints,” in: Handbook of Adhesive Technology, Revised and Expanded, A. Pizzi and K. Mittal (eds.), CRC Press, Madison, WI, USA, pp. 325. DOI: 10.1201/9780203912225.ch15
Song, D. (1996). A Simulated Study on Some Fundamental Aspects in Flakeboard Manufacture, Ph.D. Dissertation, University of British Columbia, Vancouver, Canada. DOI: 10.14288/1.0075222
Strickler, M. D. (1959). “Properties of douglas-fir flakeboard,” Forest Products Journal 9(7), 203-214.
Suchsland, O. (1962). “The density distribution in flakeboard,” Michigan Quarterly Bulletin, Agricultural Experiment Station, 45(1), 104-121.
Suchsland, O. (1973). “Hygroscopic thickness swelling and related properties of selected commercial particleboards,” Forest Products Journal 23(7), 26-30.
Wang, S., and Winistorfer, P. M. (2002). “Process and system for determination of layer TS of wood composites,” U.S. Patent No. 6396590.
Wang, S., and Winistorfer, P. M. (2003). “An optical technique for determination of layer thickness swell of MDF and OSB,” Forest Products Journal 53(9), 64.
Wang, S., Winistorfer, P. M., Young, T. M., and Helton, C. (2001). “Step-closing
pressing of mediate density fiberboard. Part 1: Influence on the vertical
density profile,” Holz als Roh-und Werkstoff. 59(1/2), 19-26. DOI: 10.1007/s001070050466.
Wang, S., Winistorfer, P. M. and Young, T. M. (2004). “Fundamentals of vertical density profile formation in wood composites. Part III. MDF density formation during hot-pressing,” Wood and fiber science 36, no. 1: 17-25.
Winistorfer, P. M., Davis, W. C., and Moschler Jr, W. W. (1986). “A direct scanning densitometer to measure density profiles in wood composite products,” Forest Products Journal, 36(11-12), 82-86.
Winistorfer, P. M., and Wang, S. (1999). “Densification of wood composite mats during pressing: Implications of mat structure and pressing schedules on density profile formation and panel properties,” in: Proceedings of the 4th International Conference on the Development of Wood Science, Wood Technology, and Forestry,Missenden Abbey, UK, pp. 375-382.
Wolcott, M. P., Kamke, F. A., and Dillard, D. A. (2007). “Fundamentals of flakeboard manufacture: Viscoelastic behavior of the wood component,” Wood and Fiber Science 22(4), 345-361. DOI: 10.1007/BF00195557
Wu, Q., and Piao, C. (1999). “Thickness swelling and its relationship to internal bond strength loss of commercial oriented strandboard,” Forest Products Journal 49(7-8), 50.
Wu, Q., and Suchsland, O. (2007). “Effect of moisture on the flexural properties of commercial oriented strandboards,” Wood and Fiber Science 29(1), 47-57.
Xu, W., and Winistorfer, P. M. (2007). “A procedure to determine thickness swell distribution in wood composite panels,” Wood and Fiber Science 27(2), 119-125.
Article submitted: July 5, 2017; Peer review completed: December 3, 2017; Revised version received: February 15, 2018; Accepted: May 3, 2018; Published: May 9, 2018.
DOI: 10.15376/biores.13.3.4856-4869