
Abstract
To improve prospects for high-value utilization of biomass, torrefaction pretreatments were conducted at 210, 230, 250, 270, and 300 °C with a reaction time of 30 min. The pyrolysis of torrefied biomass was also performed on a fixed-bed reactor system at 450 °C. The effect of torrefaction temperature on the yield, energy yield, structure, physical-chemical characteristics, and production composition of bio-oil was studied. The torrefaction pretreatment improved the fuel characteristics of pyrolysis products. When the torrefaction temperature was increased, the -OH and C=O contents decreased, the C=C contents increased, the pyrolysis peak temperature decreased, the residual carbon contents noticeably increased, and the Ea value remained in the range of 69 to 129 kJmol-1. The pore volume increased and the crystallinity index decreased due to degradation and recrystallization. The solid yield of pyrolysis biomass decreased sharply in contrast to the liquid yield. When the torrefaction temperature increased, the bio-oil yield decreased from 36.82 wt.% to 20.13 wt.%. The phenol content in the bio-oil markedly increased; however, oxygen-containing compounds such as acids, sugars, and furans, significantly decreased, which indicated that torrefaction pretreatment efficiently improved the quality of the fuel.
Download PDF
Full Article
Effect of the Torrefaction Temperature on the Structural Properties and Pyrolysis Behavior of Biomass
Yunwu Zheng,a,b Lei Tao,a Xiaoqin Yang,b Yuanbo Huang,b Can Liu,b Jiyou Gu,a,* and Zhifeng Zheng b,*
To improve prospects for high-value utilization of biomass, torrefaction pretreatments were conducted at 210, 230, 250, 270, and 300 °C with a reaction time of 30 min. The pyrolysis of torrefied biomass was also performed on a fixed-bed reactor system at 450 °C. The effect of torrefaction temperature on the yield, energy yield, structure, physical-chemical characteristics, and production composition of bio-oil was studied. The torrefaction pretreatment improved the fuel characteristics of pyrolysis products. When the torrefaction temperature was increased, the -OH and C=O contents decreased, the C=C contents increased, the pyrolysis peak temperature decreased, the residual carbon contents noticeably increased, and the Ea value remained in the range of 69 to 129 kJmol-1. The pore volume increased and the crystallinity index decreased due to degradation and recrystallization. The solid yield of pyrolysis biomass decreased sharply in contrast to the liquid yield. When the torrefaction temperature increased, the bio-oil yield decreased from 36.82 wt.% to 20.13 wt.%. The phenol content in the bio-oil markedly increased; however, oxygen-containing compounds such as acids, sugars, and furans, significantly decreased, which indicated that torrefaction pretreatment efficiently improved the quality of the fuel.
Keywords: Torrefaction; Biomass; Pretreatment; Production properties; Pyrolysis
Contact information: a: Key Laboratory of Bio-based Material Science & Technology, Ministry of Education; College of Materials Science and Engineering, Northeast Forestry University, Harbin 150040, China; b: University Key Laboratory of Biomass Chemical Refinery & Synthesis, Yunnan Province; College of Materials Engineering, Southwest Forestry University, Kunming 650224, China;
* Corresponding authors: biomass_x@163.com, zhengzhifeng666@163.com
INTRODUCTION
With the increasing depletion of fossil-fuel based resources and related environmental deterioration, the use of renewable resources in place of fossil-fuel based resources has become an increasingly popular action throughout the world. Biomass is a clean and efficient renewable energy fuel that can be transformed into high-grade secondary energy fuels such as synthetic gas, bio-oil, and bio-char via thermo chemical conversion technology, and it is the only fuel that can be converted to renewable liquid fuels (Banos et al. 2011; Ben and Ragauskas 2012). Pyrolysis technology is an important method for energy utilization and high efficiency of biomass. However, there are problems with its lower target production, high oxygen content (usually 35 to 40 wt.%, leading to lower calorific value), and catalyst coking and deactivation (which restricts the range of applications) (Lu et al. 2000; Yang et al. 2008). Therefore, seeking an effective pretreatment method of raw materials to reduce the oxygen content and improve the quality of bio-oil has become the focus of current research. Recent studies have shown that torrefaction can greatly improve the quality of bio-oil by lowering the acidity and oxygen content and increasing the biomass pyrolysis characteristics and the energy content (Bridgeman et al. 2008; Chew and Doshi 2011; Chiou et al. 2016; Mafu et al. 2016; Matali et al. 2016). Torrefaction is a medium thermo-chemical conversion technology that operates under a relatively low heating temperature (200 to 300 °C), a relatively low atmospheric pressure, and in an inert environment. This results in the release of oxygen-containing compounds H2O, CO2, and CO via the extensive decomposition of cellulose, hemicelluloses, and lignin (Vander Stelt et al. 2011; Park et al. 2013). Currently, the study of torrefaction technology mostly focuses on the mechanical properties, composition, structural transformations, bio-oil and bio-gas composition, and selectivity to improve the quality of bio-oil and bio-char (Arias et al. 2008; Chen et al. 2010; Pimchuai et al. 2010; Phanphanich and Mani 2011). Meng et al. (2012) studied the torrefaction pretreatment of loblolly pine and determined that torrefaction could be a potential upgrading method to improve the quality of bio-oil, to reduce the ratio of O/C in bio-oil, and to increase the content of pyrolysis lignin, which might be a useful feedstock for phenolic-based chemicals. Li et al. (2016) discussed the effect of torrefaction temperature and residual time on the properties of biomass and proposed that as the content of cellulose and hemicellulose decreased, the lignin content and caloric value increased significantly; they also demonstrated that hydrophobicity was enhanced with an increase of torrefaction temperature and residual time. Chen et al(2016) observed that a higher yield of bio-char and a lower yield of bio-oil were obtained with an increase in torrefaction temperature. They also observed that the content of oxygen-containing compounds decreased, while the higher carbon yield of aromatic hydrocarbon increased significantly with HZSM-5 catalyst. These results showed that torrefaction effectively reduced the content of acetic acid, furan, and other oxygen-containing compounds in bio-oil, which increased the calorific value and pH value. The results also showed that the torrefaction temperature lowered the O/C ratio and moisture content, which improved the quality of the bio-oil. Although baking pretreatment has been used for biomass pyrolysis to improve the quality of bio oil, the relationship between the structure and the characteristics of pyrolysis is still not clear.
The objective of this paper was to study the effect of torrefaction temperature (210 °C, 230 °C, 250 °C, 270 °C, and 300 °C) on the thermal, chemical, and physical properties of bio-char. The micro-topography structure, pore size distribution, pyrolysis behavior, kinetic parameters, and pyrolysis production were analyzed using Fourier transform infrared spectrometry (FTIR), x-ray diffraction (XRD), thermal gravimetric analysis (TGA), scanning electron microscopy (SEM), surface area and pore size analysis (BET), and gas chromatography mass spectroscopy (GC-MS) to provide the basic data for high-quality bio-char and bio-oil.
EXPERIMENTAL
Materials
The Yunnan pine particles used in this study were collected from Pu’er city in the Yunnan province. Prior to the experiments, Yunnan pine particles were sieved to a particle size in the range of 0.250 to 0.420 mm. The feedstock was dried at 105 ± 2 °C until it reached a constant weight and was then sealed in bags. The main characteristics of Yunnan pine are listed in Table 1. The proximate analysis of Yunnan pine was conducted on a TG 209 F3 Tarsus (NETZSCH-Gerätebau GmbH, Bavarian State, Germany). The moisture, ash, and volatiles were identified using ASTM standards E871 (1982), E1755 (2001), and E872 (1998), respectively. The fixed carbon content was calculated by the difference. An EA 1108 elemental analyzer (Elementar, Langenselbold, Germany) was used to determine the ultimate analysis of Yunnan pine. The cellulose, hemicellulose, and lignin contents were determined according to the method of determination of structural carbohydrates and lignin in biomass, which was provided by the National Renewable Energy Laboratory (Sluiter et al. 2008). Tetrahydrofuran AR was provided by Tianjin Zhiyuan Chemical Reagent Company (Nanjing, China). High-purity nitrogen was provided by Kunming Messer Company.
Table 1. Proximate, Ultimate, and Component Analysis of Yunnan Pine
a Air-dry basis; b By difference
Methods
Torrefaction process of biomass
First, the sample (5 g with a particle size of 40 to 60 mesh) was weighed and then placed in the bottom of three bottles to ensure uniform heating. High purity nitrogen was used to purge the bottles to create an inert atmosphere at a nitrogen flow rate of 300 mL/min. The heating furnace was then opened, and the sample was heated at the rapid heating rate of 10 °C/min up to the torrefaction temperature (210 °C, 230 °C, 250 °C, 270 °C, or 300 °C), which was held for 30 min. At the end of the experiment, the sample was cooled and weighed. The solid yield of torrefied biomass was calculated using Eq. 1 and the torrefaction process diagram as seen in Fig. 1,
 (1)
(1)
where w is the solid yield, w1 is the weight of the feedstock, w2 is the combined weight of the container and the torrefied biomass, and w3 is the weight of the container.
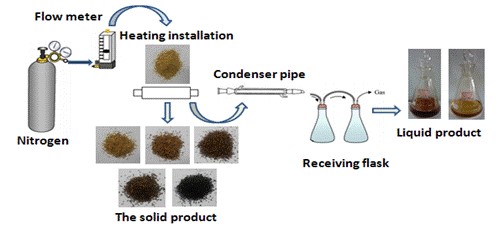
Fig. 1. Lab-scale device system for torrefaction
Pyrolysis of biomass and torrefied biomass
The fixed-bed reactor for the pyrolysis of Yunnan pine was custom designed for this research. A schematic diagram of the fixed-bed reactor for the pyrolysis process is shown in Fig. 2. The furnace was heated electrically, and the temperature was measured using a thermocouple located inside the furnace. The pyrolysis reaction was conducted in the reactor with a steel pipe passing through the hole of the furnace. The top of the reactor was connected to a straight condenser. The condenser was kept at approximately 5 °C using ice water. The distance between the top of the furnace and the condenser was approximately 30 cm. First, the dry glass fiber was inserted into the vertically installed reactor to be used for loading the feedstock. Next, 1.20 g of Yunnan pine was placed into the reactor. The bottom of the reactor was linked with the high-purity nitrogen, while the top of reactor was connected with the condenser. The reactor was purged with high-purity nitrogen for 5 min before the beginning of the experiment. Afterward, heat was applied rapidly to setting temperatures at a heating rate of 250 °C/min, which was held for 30 min. The quantity of nitrogen flow was 150 mL/min, and the pyrolysis temperature was 450 °C. Next, the obtained bio-oil was dissolved using tetrahydrofuran (THF) and then quantified. THF was used as a solvent for the bio-oil. The yield of bio-char was obtained by weighing. The yield of the gaseous products was calculated from the difference,
 (2)
(2)
 (3)
(3)
![]() (4)
(4)
where YL represents the yield of the bio-oil, YS-in-situ represents the yield of the solid residue with the in situ catalytic pyrolysis upgrading process, YG represents the yield of the non-condensable gas, M0 represents the weight of the biomass feedstock, M1 represents the weight of the liquid, M2 represents the weight of the solid residue, and M3 represents the weight of the initial catalyst.
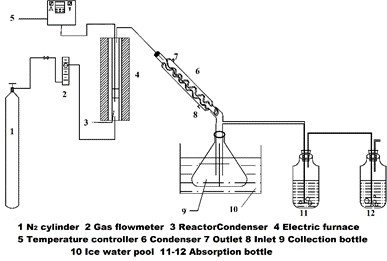
Fig. 2. Schematic diagram of fixed-bed reactor
Characterization of torrefaction and pyrolysis production
The proximate analysis of Yunnan pine was conducted on a TG 209 F3 Tarsus (Netzsch, Bavarian State, Germany). The moisture, ash, and volatile analysis used ASTM standards E 871, E 1755 and E 872, respectively. The fixed carbon content was calculated using the difference between these measurements.
A Magna-IR 560 ESP type Fourier transform infrared spectrometer (Thermo Nicolet Corporation, Massachusetts, USA) with a resolution of 4 cm-1 and equipped with ATR-FTIR was used to characterize the biomass and torrefied biochars in the range of 600 cm-1 to 4000 cm-1. The samples were placed in a potassium bromide press and then scanned 32 times using the transmission method
The thermal stability of the biomass and their derived biochars was studied using a thermo-gravimetric analysis system (TGA 209 F3, NETZSCH Co., Bavarian State, Germany). Each sample powder (5 mg dry weight) was loaded into an aluminum oxide pan. The experiments were tested from 30 to 800 °C at the heating rate of 10 °C/min and an argon gas flow rate of 20 mL/min. The kinetic parameters of biomass and their derived biochars can be determined by the Doyle’s method (Eq. 5) (Wei et al. 2016),
 (5)
(5)
where β is the heating rate (°C/min), T is the absolute temperature (K), A is the pre-exponential factor (min-1), Ea is the activation energy (kJ/mol), R is the universal gas constant (mol/K), and α is the conversion degree of the sample at any time.
The activation energy (Ea) and pre-exponential factor (A) were calculated from the slope and intercept, respectively, of the regression line by plotting ln(-ln(1-α)) versus 1/T.
Biomass and torrefied biochars were also used to study the changes in structure with a QUANTA 200 scanning electron microscope (FEI, Hillsboro, USA), which was operated at an acceleration voltage of 20 kV. The samples were mounted on circular aluminum stubs with double-sided adhesive tape and then vacuum coated with gold for examination.
X-ray diffraction data were determined from the annealed sample surfaces using an X-ray diffraction instrument (Rigaku D/max220, Tokyo, Japan). The Cu-Kα X-ray source (λ = 0.1542 nm) was operated at 40 kV and 30 mA together with a Ni-filter to extract the Kα radiation. The data were collected over a range of scattering angles (2θ) of 5° to 40° and a scanning speed of 2°/min. All measurements were conducted at room temperature and atmospheric pressure.
To investigate the crystallinity of the sample as a result of the torrefaction, the crystallinity index (CrI) was calculated with Eq. 6,
 (6)
(6)
where I002 (at 2θ=~22°) was the maximum peak intensity and Iam was the minimum intensity between the peaks at 2θ of 15.5° and 22°(Kumar et al. 2009).
According to the method of the coal crystal structure used to evaluate the micro-crystal phase structure of biomass, the characteristic parameters of the structure were calculated according to the Scherrer formula and the Bragg equation,
 (7)
(7)
 (8)
(8)
 (9)
(9)
where θ100 and θ002 are the glancing angles and β100 and β002 are the full width at half maximum values, respectively. λ was the incident wavelength (0.154 nm), and K1 and K2 are constants (0.89).
XPS measurements were performed at room temperature with monochromatic Al-K radiation (1486.6 eV) using a K-Alpha X-ray photoelectron spectrometer (supplied by Thermo Fisher Scientific Co., Massachusetts, USA). The X-ray beam was 100 W, 200 mm in diameter and laser scanned over a 2 mm by 0.4 mm area on the sample. High-energy photoemission spectra were collected using pass energy of 50 eV and a resolution of 0.1 eV. For the Ag3d5/2 line, these conditions produced a FWHM of 0.80 eV.
The C, H, N, and O content of Yunnan pine and its products were quantified using an EA 1108 elemental analyzer. First, C, N, and H were determined and the mass fraction of O was calculated by subtracting the contents of the ash, C, N, and H from the total mass of sample. Moreover, the water content of bio-oil was analyzed using Karl-Fischer titration. A mixture of methanol and chloroform with a mass ratio of 3:1 was used as the titration solvent.
The higher heating values (HHVs) of bio-char and bio-oil were calculated using Eq. 10 (Channiwala and Parikh 2002),![]() (10)
(10)
where C, H, S, O, and N represented the weight percentages of carbon, hydrogen, sulfur, oxygen, and nitrogen, respectively; A was the weight percent of ash.
The surface areas were measured using an ASAP2020 (Micrometrics, New Hampshire, USA) surface area and pore size analyzer. Prior to the measurement, the samples were out-gassed at 250 °C for 12 h under vacuum. For analysis, the samples were cooled to -196 °C in a liquid nitrogen bath. Liquid nitrogen was also used as an adsorption gas. The BET surface area was calculated from the linear portion of the BET plot. The micropore volume and the external surface areas were calculated using the t-plot method, and the BJH model determined the pore size distribution.
Gas chromatography-mass spectrometry (GC-MS) analysis of bio-oil was performed on an ITQ 900 instrument (Thermo Fisher Scientific) using an HP-5MS (30 m × 0.25 mm × 0.25 μm) capillary chromatographic column. The temperature of the injector was 280 °C, and the split ratio of the carrier gas was 1:10 using high purity helium. At first, the oven temperature was held at 50 °C for 5 min; then, the temperature was ramped from 50 °C to 280 °C at 5 °C/min-1 and held for 5 min. For the MS condition, the following parameters were used: an EI ionization method, an ionization energy of 70 eV, a scan per second over electron range (m/z) of 30 to 500 amu, and an ion source temperature of 230 °C.
RESULTS AND DISCUSSION
Physical Properties of Torrefied Bio-char
The torrefaction pretreatment primarily generated solid residue, bio-oil, and non-condensable gas (mainly composed of CO2, CO, and a small amount of CH4). The heat cracking of the biomass caused the bio-oil and non-condensing gas. As the heating temperature increased, the proportion of volatiles increased. The yield of production in is presented in Fig. 3. With an increase of torrefaction temperature from 210 °C to 300 °C, the yield of solid production decreased remarkably from 94.47 wt.% to 46.27 wt.%, and the non-condensing gas was enhanced from 0.61 wt.% to 33.62 wt.%. The higher temperature corresponded to a more intense reaction, which resulted in the generation of more volatiles that primarily escaped in the form of gas. With the increase of temperature, the solid product was reduced; also, the color gradually changed from yellow to brown and eventually became black.

Fig. 3. Effect of torrefaction temperature on production yield of biomass
Bridgwater and Peacocke (2000) proposed that the formation of char was the result of precipitation and volatile reaction as well as a second set of reactions of bio-oil. Compared with the raw material, the solid production retained the original shape, but the length was shortened, and the diameter was reduced. Subsequently, the apparent volume decreased noticeably. Torrefaction mainly consisted of the pyrolysis of hemicelluloses and the decomposition of cellulose and lignin in the temperature range of 210 °C to 300 °C. The dehydration, decarboxylation, and deacetylation reactions occurred in hemicelluloses, which contained xylan (Prins et al. 2006). Under the lower temperature, the dehydration reaction, which released the volatiles and causes the formation of the char, played a major role. With increased temperature, the cleavage of L-dextran would play a major role. The water content in the bio-oil can be generated from the dehydration reaction of organic and water evaporation during the drying process. After torrefaction, most of the water and some low molecular weight organic volatile matter were lost and the long chain polysaccharides were cracked. Because of the removal of moisture and volatile matter, the fixed carbon content of the solid product noticeably increased.
The effect of the different torrefaction conditions on biochar properties is presented in Tables 2 and 3. With an increase in the torrefaction temperature, the ash content and fixed carbon content gradually increased, the volatile content gradually decreased, and both a large amount of hemicellulose and part of the cellulose decomposed to produce water and light volatile components, which led to the reduction of the volatile content of biochar. However, the corresponding ash content and fixed carbon content increased. In addition, the HHV for torrefied samples increased from 20.93 MJ/kg to 24.34 MJ/kg, compared with 20.16 MJ/kg of the raw material. The highest increase of HHV obtained was 20.73%. This result was similar to the elemental analysis result; the elemental C contents gradually increased and the H and O elements gradually decreased with increasing temperature. The decrease in both the H content and O content may have been caused by the release of moisture during torrefaction and the formation of CH4, C2H6, and other hydrogen rich gases (Chen et al. 2012).
Table 2. Ultimate Analysis and HHV Analysis of Raw and Torrefied Biochars

a: By difference, O(wt.%)=100-C-H-N-S
Table 3. Proximate Analysis and Component Analysis of Raw and Torrefied Biochars


Fig. 4. Van Krevelen diagram of untreated and torrefied samples
Next, with the increase in the reaction temperature from 210 °C to 250 °C, the energy yields decreased slightly from 98.05% to 86.69% (reduced by 11.36%). When the temperature was 250 °C to 300 °C, and the energy yield rapidly decreased to 55.84% (reduced by 30.85%) due to the slow decomposition of hemicelluloses at 250 °C. However, above this temperature, hemicelluloses experienced rapid decomposition that was accompanied by some thermal decomposition of the cellulose and lignin, which caused the energy yield to decrease rapidly. The increase of pretreatment temperature resulted in the decomposition of cellulose and hemicellulose, which caused the holocellulose content to decrease and the lignin content to increase.
The variations in the aromatic ratios of H/C and O/C are depicted in the van Krevelen diagram, as shown in Fig. 4. The data showed a linear trend with an increase in temperature. With increased temperature, the O/C ratio and H/C ratio decreased from 0.66 to 0.39 and from 1.51 to 0.99, respectively; thus, torrefaction clearly improved the fuel properties of the sample, which was closer to the fuel characteristics of coal. In addition, lower O/C and H/C ratio values reduced the formation of smoke and water vapor in the subsequent combustion or gasification, thereby reducing the unnecessary energy loss. Thus, torrefaction pretreatment improved the energy, physical, and chemical characteristics, which has a positive effect on the quality of biomass.
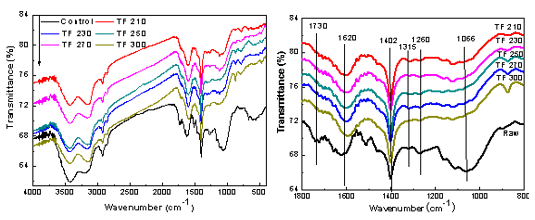
Fig. 5. FTIR spectra of raw material and their derived biochar at different torrefaction temperatures
Functional group analysis
FTIR profiles of untreated and torrefied biomass are displayed in Fig. 5. The biomass contained many oxygen-containing functional groups. Also, after torrefaction pretreatment, the bio-char retained its functional groups: observed bands at 3000 to 3700 cm-1, 1730 cm-1, 1066 cm-1, and 1620 cm-1 were attributed to the -OH stretching vibration, -C=O stretching vibration, the ether bond and the C-O stretching vibration of methoxy, and the C=C skeleton stretching vibration absorption peak of lignin aromatic ring, respectively. In addition, the characteristic band at 1315 cm-1 of the cellulose and hemicelluloses was assigned to the C-H bond bending vibration. The 1260 cm-1 band was assigned to the guaiacyl ring breaking, C-O stretching in lignin, and the C-O linkage of guaiacyl aromatic methoxyl groups. With the increase in the torrefaction temperature, the peak intensity of -OH, C=O, C-O-C, and other oxygen functional groups decreased and eventually disappeared, while the -C=C functional groups and C-H bending vibration intensified. This result indicated that upon increasing the temperature, the cellulose and hemicellulose undergo dehydration and thermal degradation reactions, which reduced the free hydroxyl content of the cellulose molecule surface. The acetyl groups on the chain of hemicellulose molecules broke and produced acetic acid, which decreased the hemicellulose content and the number of acetyl groups. The ether bond of lignin was broken, and the methoxy was removed, which caused degradation. Therefore, torrefaction pretreatment promoted the decomposition of the hydroxyl group and the methoxy reaction, causing the decarboxylation reaction to occur.
Thermogravimetric Analysis
TG and DTG curves for torrefied biomass are shown in Fig. 6. As shown in Fig. 6 and Table 4, with an increase in torrefaction temperature, the sharp peak of hemicelluloses in the DTG curves disappeared at 250 °C. At temperatures below 250 °C, only slight degradation occurred (spectra of the sample and the raw material nearly overlapped). The degradation mainly occurred between 200 °C and 450 °C.
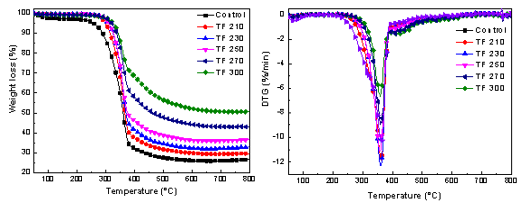
Fig. 6. TG-DTG curve of raw and their derived biochars with different torrefaction temperature
Table 4. Characteristic Parameters of Biomass and their Derived Biochars

As the ignition temperature increased gradually, the peak temperature and the value of (dw/dt)max declined from 362.9 °C to 358.8 °C and from 12.35 wt.%/min-1 to 6.59 wt.%/min-1, respectively. Furthermore, the residues increased from 26.60 wt.% to 50.55 wt.% with an increase in reaction temperature from 210 °C to 300 °C. Yang et al. (2007) found that the three primary components of biomass (cellulose, hemicelluloses, and lignin) decomposed at temperature ranges of 315 to 400 °C, 220 to 315 °C, and 160 to 900 °C, respectively. With the increased temperature, hemicellulose, and cellulose experienced complex degradation and devolatilization reactions, which resulted in the decomposition of cellulose and hemicellulose (Khan et al. 2009). Part of the cellulose and branched chain as well as the microcrystalline regions had extensive depolymerization, thus increasing the content of lignin. Lignin was partially decomposed and a small amount of cellulose was broken down and converted in the biochar. At this time in the pyrolysis process, the loss of some components decreased the maximum weight loss rate. As a result, the decomposition temperature and carbon residue rate increased.
Table 5. Kinetics Parameters of Biomass and their Derived Biochars

The Ea and A for the devolatilization and combustion stage were noticeably increased with torrefaction pretreatment compared with the raw material. As the torrefaction temperature increased, Ea increased from 69.07 kJmol-1 to 127.95 kJmol-1 (250 °C) and then decreased by 125.02 kJmol-1 (300 °C). This result may have been due to the decomposition of hemicellulose that resulted in the original composition and structure of the biomass changes, which affected the pyrolysis characteristics (Chen et al. 2014). For the char combustion stage, when the temperature increased from 210 °C to 250 °C, Ea hardly changed; upon further increase of the torrefaction temperature, Ea increased to 15.40 kJmol-1. This result may have been due to cross-linking, as well as the carbonization reaction during the high temperature pretreatment, which resulted in an increase of Ea (Zheng et al. 2015). In addition, the ash content from samples reduced the reaction rate because of the mass transfer limitation of the ash contained in samples (Zhang et al. 2016a, b).
BET analysis
The large number of pores that formed on the surface of the sample was due to the release of volatile compounds, which caused a large change in the surface structure. Table 5 lists the void structure data of the sample after torrefaction.
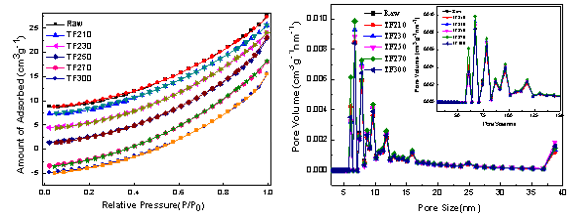
Fig. 7. Pore structure parameters of biomass and its productions
The isothermal adsorption of biomass and torrefaction-pretreated samples was studied. The specific surface area and the average pore diameter of the samples varied with the pretreatment temperature (Table 6). After torrefaction pretreatment, the total pore volume of the samples had increased. When the torrefaction temperature was 230 °C, the specific surface area of the sample increased at the expense of the average pore size, which decreased. This result was due to the rapid precipitation of water and CO2 that made the surface gaps in the sample noticeably increase. With the increase of temperature to 250 °C, the specific surface area decreased noticeably due to the softening of the portion of the organic hydrocarbon in the biomass, which blocked the part of the gaps on the surface of the sample. As a result, the specific surface area decreased. Upon further increasing the pretreatment temperature to 270 °C, a significant increase in the specific surface area occurred. At this temperature, the thermal decomposition of some hydrocarbons and volatiles also occurred. The rapid release of volatiles made the original surface of the sample gradually open the gaps. In addition, the tar blocked part of each hole and formed a new hole, such that the average pore size decreased rapidly and the specific surface area increased gradually. At 300 °C, the specific surface area decreased noticeably, the average pore size increased slightly, and a portion of the tar material further cracked and was released. In addition, the organic component (cellulose and lignin) exhibited a certain softening, which made the original pore structure deform, reorganize, and close. Thus, the average pore size increased with the decreased specific surface area. Therefore, torrefaction changed the microstructure of the material, and the specific surface area increased. A higher specific surface area and the lower average pore size were obtained at 230 °C. This sample with developed void structure was beneficial to the heat and mass transfer in the thermo-chemical conversion project, which thereby promoted the rapid development of the gas-solid reaction.
Table 6. The Pore Parameters of Biomass and its Solid Products

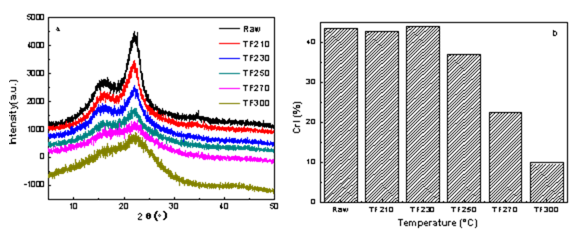
Fig. 8. XRD profiles and crystallinities of raw and biochars at different torrefaction temperatures (a: XRD profiles; b: crystallinites)
XRD analysis
Cellulose is crystalline, whereas hemicelluloses and lignin are both amorphous in lignocellulose. The XRD curves of the samples are presented in Fig. 8. The samples showed typical cellulose I diffraction angles at approximately 16°, 21°, and 34°, which corresponded to the diffraction planes of 101, 002, and 040, respectively (Yun et al. 2016). The XRD curves for most samples were similar, as indicated by two distinct peaks at 2θ = 16° and 22°, except for the sample after serious torrefaction (300 °C), which did not change the crystal structure of wood powder. However, the peak intensity gradually weakened, and more obvious changes were observed. The torrefaction treatment changed the composition of the biomass chemicals but did not alter the crystalline cellulose, and therefore, maintained the coexistence of the amorphous region and the crystalline state. In addition, torrefaction resulted in the chemical reaction of the cellulose, causing some hydrogen bonds to be broken, which somewhat destroyed the crystalline structure.
Figure 8(b) shows the change of crystallinity index (CrI) of biomass during the torrefaction process. With the increase of temperature, the crystallinity index decreased slightly from 43.60% to 42.79%, which indicated that the partial hydrogen bonding was destroyed and the macromolecular chain was broken (Zhang et al. 2016c). With a further increase in temperature, the crystallinity index increased rapidly to 44.07% (230 °C). This may have been due to part of the hemicellulose, lignin, and amorphous regions undergoing degradation, extrusion moisture, and cellulose polymerization, which generated a bridging array combination that resulted in more order. In addition, recrystallization of the amorphous region occurred because the amorphous cellulose molecules rearranged, which led to an increase of the intensity of the diffraction peak and thus an increase of the crystallinity index. As the torrefaction temperature continued to increase, the crystallinity index decreased rapidly. When the temperature was 300 °C, the lowest crystallinity index was only 9.81%, which was mainly due to the excessive degradation of crystalline cellulose (Wen et al. 2014). Therefore, the degradation of the cellulose crystalline region eventually leads to the activation of biological carbon.
Table 7. Microcrystallite Parameters of Biomass and Biochars
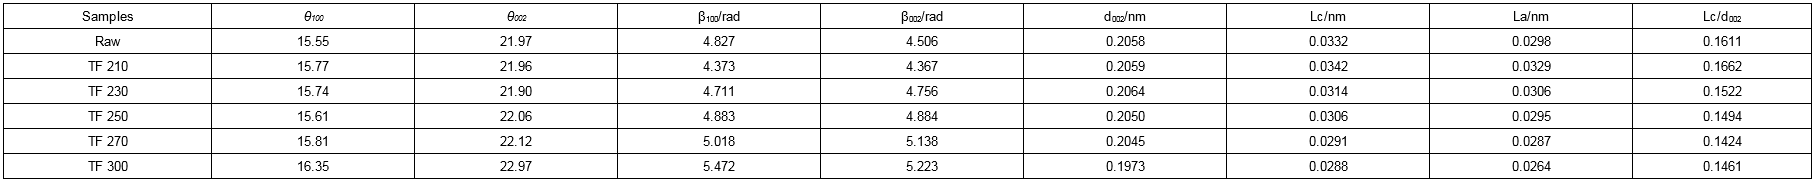
Table 7 shows the microcrystallite parameters of biomass and biochar. The values for d002 and La gradually decreased with increased torrefaction temperature. With an increase in temperature, the distance between the aromatic layers of samples increased, the aggregation degree gradually decreased, and the accumulation thickness and the average accumulation layer number (Lc/d002) were reduced. Hence, with increased temperature, the degree of crystallinity of the samples and the degree of order both decreased. These findings were consistent with the results for the degree of crystallinity.
Electron Microscopy
Figure 9 shows the SEM images of raw and torrefied biomass at increased torrefaction temperature. From Fig. 9(a), the fiber was in a regular step. With an increase in torrefaction temperature, the structure experienced different degrees of fracture that showed a variety of states. Figure 9(b) shows that when the torrefaction temperature was 210 °C, the sample structure changed and the bio-char retained a complete skeleton with an obvious rib structure. On the rib surface, which had some traces of fiber shrinkage, water and small molecules precipitated and resulted in pore structure loss of the internal part of the bio-char. When the torrefaction temperature was 250 °C (Fig. 9c), obvious pores and a layered structure were observed inside the coke. Also, more volatile products were produced, and these volatile products entered the gas phase space layer and caused the surface pores to appear and expand. In Fig. 9(d), serious damage of biomass samples was observed, with some places exhibiting hole collapse and fractures. The pore structure was highly irregular due to the melting and polymerization of the mineral salts in the internal biomass, which blocked or merged small holes in the surface of the biomass and resulted in the decrease of the specific surface area of the bio-char. The high temperature promoted the plastic deformation of biomass, and subsequently the carbonization degree increased. Lignin softened and melted at high temperature, which lead to the change in pore structure (Luo et al. 2007). This result was consistent with the specific surface area (Table 5) of the previous description.
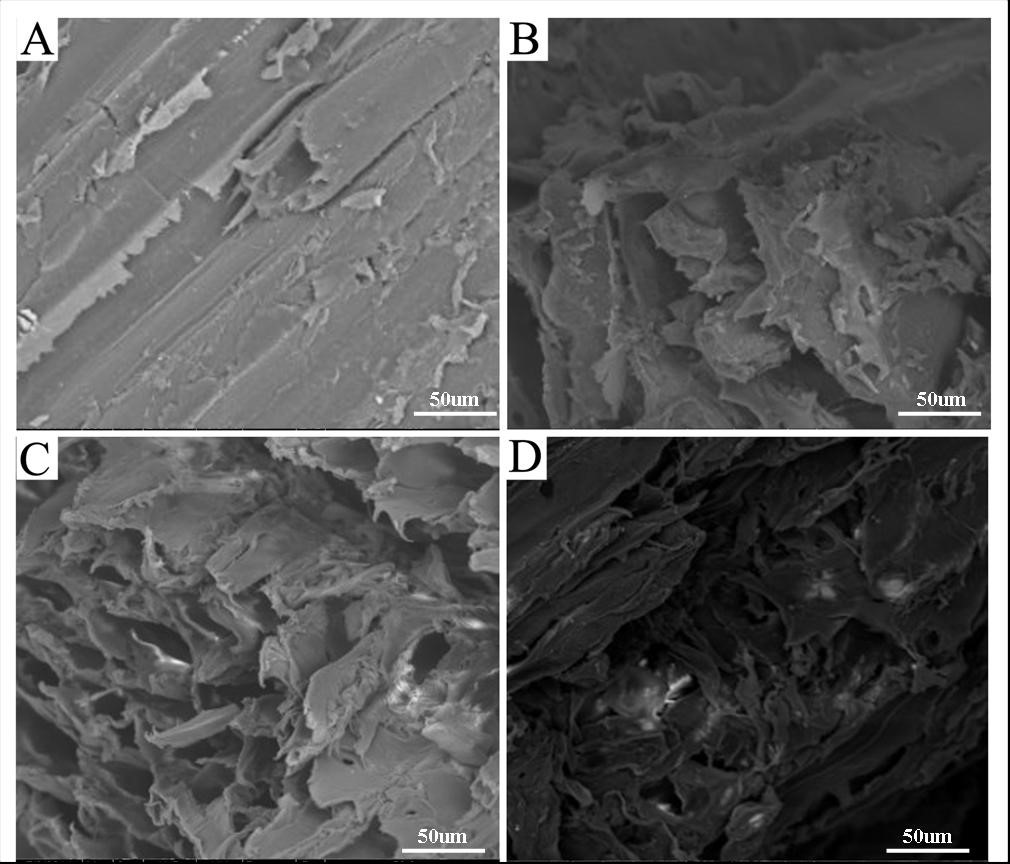
Fig. 9. SEM images (×500) of (a) raw material and torrified materials at the torrefaction temperatures of (b) 210 °C, (c) 250 °C, and (d) 300 °C.
X-ray Photoelectron Spectroscopy (XPS) Measurements
High-resolution spectra (XPS) analysis of untreated and torrefied biomass samples revealed the presence of O and C from the sample surface (Fig. 10). The relative composition of the O and C atoms and the calculated oxygen to carbon (O/C) ratio for all samples are listed in Table 8. After pretreatment, the main chemical components of the wood surface did not change. The elements of C, H, and O were mainly observed at increased torrefaction temperature. The content of O/C in the system was lower after pretreatment, with an increased C content and decreased O content and O/C ratio, which indicated decreased oxygen-containing functional groups on the material surface.
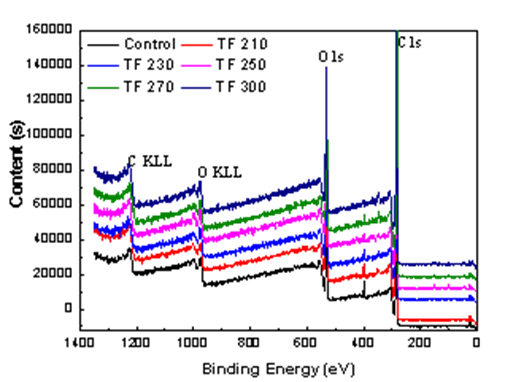
Fig. 10. XPS peak output for biomass and biochars
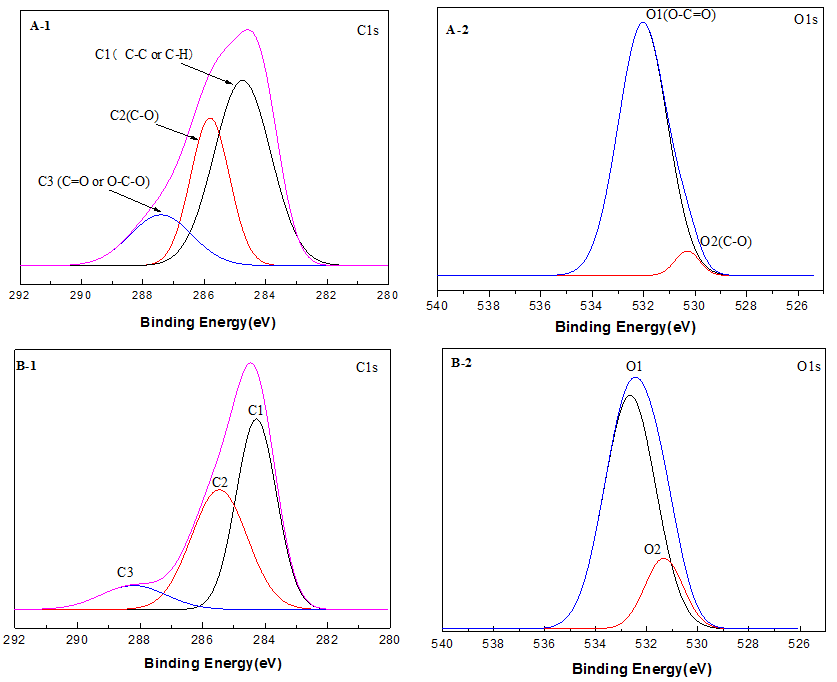
Fig. 11. X-ray photoelectron high-resolution C1s and O1s images of (a) raw material and torrified materials at the different torrefaction temperatures of (b) 250 °C
Table 8. Elemental Compositions of Wood Powder and Biochars
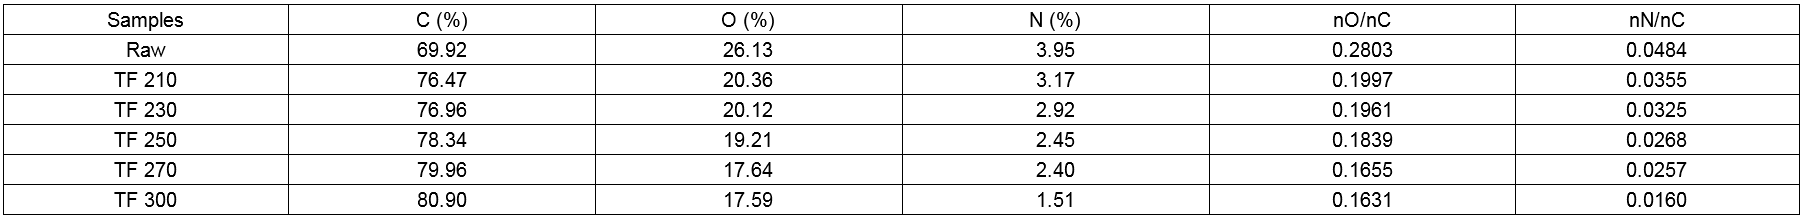
Table 9. High Resolution C1s XPS Data of Wood Powder and Biochars
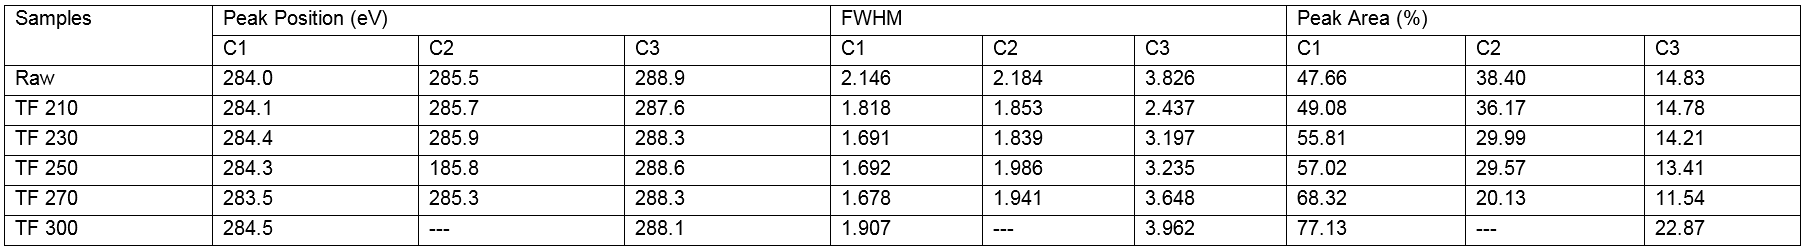
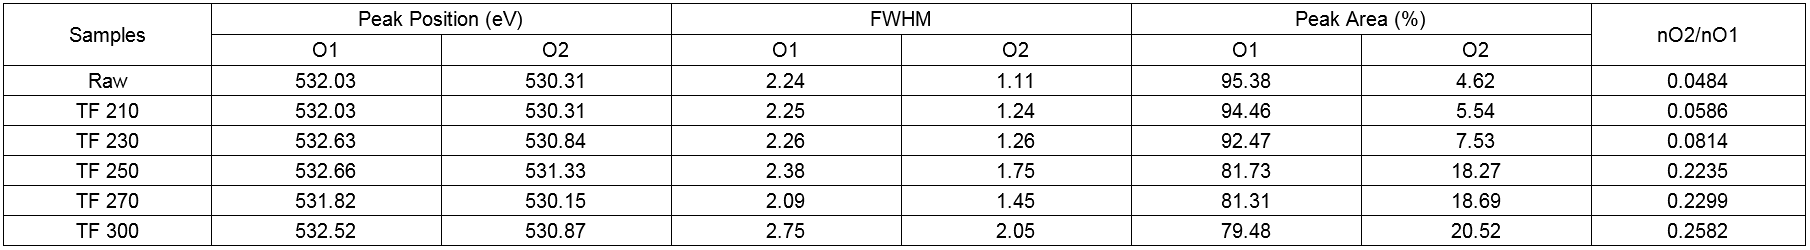
Table 10. High Resolution O1s XPS Data of Wood Powder and Biochars
High-resolution scans of the XPS spectra of C1s and O1s levels for the analysis of raw and torrefied biomass samples are shown with the deconvolution of their peak envelopes in Fig. 11(a-f). With increased torrefaction temperature, the binding modes of C and O on the surface changed. The content of C1 increased from 47.66 wt.% to 77.13 wt.% due to the carbon-carbon bonds and carbon-hydrogen bonds, whereas the content of C2 and C3 decreased noticeable from 38.40 wt.% to 20.13 wt.% and from 14.83 wt.% to 11.54 wt.% (270 °C), respectively. This result showed that the content of C-C, the non-carbohydrate content, increased. C2 is associated with the characteristic absorption of hydroxyl groups, the reduction of which is due to the reduction of cellulose and hemicellulose in wood along with the reduction of the hydroxyl content of the wood surface. From the chemical structure of the wood composition and the generation of carbonyl groups, the reduction of the hydroxyl content led to the reduction of the C3 content, which revealed that the wood surface lost a large number of oxygen-containing functional groups.
As shown in Table 10, the O1s spectrum showed two peaks that corresponded to the C-O-C or C-OH and C=O groups. The content of O2 decreased, whereas that of O1 increased, the relative area (O2/O1) of which was 0.0484. These observations indicated the binding mode of C and O on the surface was a single bond, whereas connections with double bonds were rare. With an increase in torrefaction temperature, the O2 content and the O2/O2 ratio increased, which indicated that the connection between oxygen and carbon was increased by the connection of double bonds. In short, the number of carbonyl groups (C=O) increased, which indicated that the oxidation state of the carbon in the wood increased after torrefaction. The increase in the O2 peak area was due to the increase in the number of carbonyl groups produced by the condensation reaction of lignin during the torrefaction process. However, the reduction of the O1 peak area was due to the dehydration reaction of cellulose in the process of torrefaction pretreatment and the decrease of the content of oxygen containing functional groups in the wood. The results above showed the loss of -OH groups and the formation of C=O groups upon an increase in the torrefaction temperature, which was in agreement with the FTIR spectroscopy results.
Figure 12 shows the effect of torrefaction pretreatment on the yield of production obtained from the Yunnan pinewood. With increasing torrefaction temperature, the yield of bio-oil noticeable decreased from 36.82 wt.% to 20.13 wt.%; however, the solid yield noticeably increased from 31.72 wt.% to 52.38 wt.%. Yang et al. (2007) found that there were three primary components of biomass (cellulose, hemicelluloses, and lignin), which have decomposition temperatures in the ranges of 315 to 400 °C, 220 to 315 °C, and 160 to 900 °C, respectively. Cellulose and hemicellulose are the sources of bio-oil and lignin is the primary source of biological carbon. With the increase in temperature, the thermal decomposition of biomass increased and more volatiles were lost in the process, which resulted in the reduction of the volatile content in the pyrolysis process. Furthermore, the bio-oil content produced by the component could be reduced. The gas yield decrease accompanied by the increase of bio-char was due to the enrichment of relatively stable lignin accumulation in the process of cellulose and hemicellulose pyrolysis (identical to Table 3 data). Also, lignin was the main source of the formation of bio-char; therefore, the content increased noticeable.
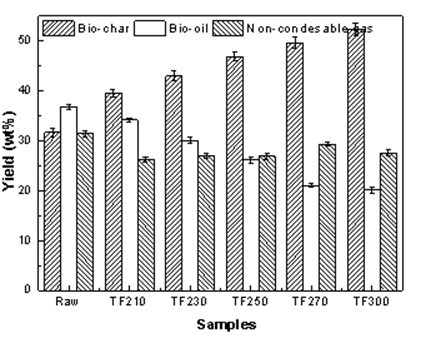
Fig. 12. The effect of torrefaction temperature on the yields of biomass pyrolysis
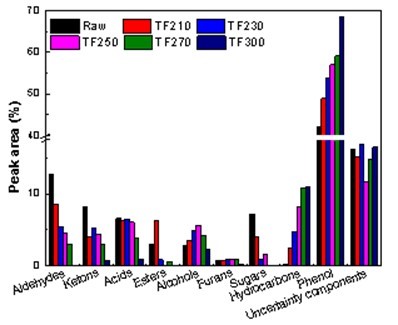
Fig. 13. Effect of torrefaction temperature on the components of bio-oil
The distribution of pyrolysis production in this study was determined based on torrefied Yunnan pinewood. Figure 13 shows the effect of torrefaction temperature on the distribution of bio-oil. Bio-oil is mainly composed of aldehydes, ketones, acids, esters, phenols, saccharides, and hydrocarbons. When torrefaction temperature was increased, the phenol content in bio-oil noticeably increased because the production of phenolic compounds was mainly caused by the occurrence of ether bond breakage and the reaction of demethyl oxygen in the process of torrefaction (Branca et al. 2014). During torrefaction, hemicellulose and cellulose became partly cracked, which resulted in the increase of the relative content of lignin. This means that torrefaction pretreatment can help in the production of phenols. In addition, the amount of carbohydrates decreased due to the decomposition of sugars from the cellulose and hemicellulose. Moreover, with increasing torrefaction temperature, the acid content decreased noticeably. The decreased acidity of bio-oil occurred because the source of acetic acid in the acid was mainly from the deacetylation reaction of hemicelluloses, most of which were broken down in the torrefaction process (Zheng et al. 2012). It is generally believed that the dehydration reaction of cellulose or hemicelluloses is a product of furfural (Cheng et al. 2011). The furfural product content decreased as the baking temperature increased.
CONCLUSIONS
Increasing the torrefaction temperature resulted in an increase in the ash content and the fixed carbon content, which was accompanied by a decrease in volatiles. Moreover, the oxygen content decreased from 41.77 wt.% to 32.62 wt.%, and the atomic ratios of O/C and H/C also decreased, with the highest calorific value of 24.34 MJ/kg. This improved the fuel characteristics of the pyrolysis products.
- Torrefaction pretreatment destroyed the structures of cellulose and hemicelluloses, which decreased the -OH and C=O content and increased the C=C content. The organic functional group became gradually simplified, and the surface was severely damaged. In addition, the pyrolysis peak temperature decreased and was accompanied by a noticeable increase in the residual carbon content. The Ea remained in the range of 69 to 129 kJmol-1, the pore volume increased, and the crystallinity index decreased due to degradation and recrystallization.
- With the increasing torrefaction temperature, the bio-oil yield decreased from 36.82 wt.% to 20.13 wt.%. However, the solid yield (31.72 wt.% to 52.38 wt.%), phenol content in the bio-oil markedly increased;, and the oxygen containing compounds such as acids, sugars, and furans all noticeable decreased.
ACKNOWLEDGMENTS
This work was supported by the National Natural Science Foundation of China (31670599), the 948 project (Grant No. 2013-4-08) in the State Forestry Administration, the Special Fund for Renewable Energy Development in Yunnan Province (Yunnan Finance Industry No. (2015) 86), the Yunnan Provincial Department of Education Major Project of Scientific Research Foundation (Grant No. ZD2014012), and the Key Laboratory of Bio-based Material Science & Technology (Northeast Forestry University), Ministry of Education (Grant No. SWZCL2016-08).
REFERENCES CITED
Arias, B., Pevida, C., Fermoso, J., Plaza, M. G., Rubiera, F., and Pis, J. J. (2008). “Influence of torrefaction on the grindability and reactivity of woody biomass,” Fuel Process Technol. 89(2), 169-175. DOI: 10.1016/j.fuproc.2007.09.002
ASTM E871 (1982). “Standard test method for moisture analysis of particulate wood fuels,” ASTM International, West Conshohocken, USA.
ASTM E 872(1998). “Test method for volatile matter in the analysis of particulate wood fuels,” ASTM International, West Conshohocken, USA.
ASTM E1755 (2001). “Standard test method for ash in biomass,” ASTM International, West Conshohocken, USA.
Banos, R., Manzano-Agugliaro, F., Montoya, F. G., Gil, C., Alcayde, A., and Gómez, J. (2011). “Optimization methods applied to renewable and sustainable energy: A review,” Renew. Sust. Energ. Rev. 15(4), 1753-1766.DOI: 10.1016/j.rser.2010.12.008
Ben, H., and Ragauskas, A. J. (2012). “Torrefaction of Loblolly pine,” Green Chem. 14(1), 72-76. DOI: 10.1039/C1GC15570A
Branca, C., Di Blasi, C., Galgano, A., and Brostrom, M. (2014). “Effects of the torrefaction conditions on the fixed-bed pyrolysis of Norway spruce,” Energ. Fuels 28(9), 5882-5891. DOI: 10.1021/ef501395b
Bridgeman, T. G., Jones, J. M., Shield, I., and Williams, P. T. (2008). “Torrefaction of reed canary grass, wheat straw and willow to enhance solid fuel qualities and combustion properties,” Fuel 87(6), 844-856. DOI: 10.1016/j.fuel.2007.05.041
Bridgwater, A. V., and Peacocke, G. V. C. (2000). “Fast pyrolysis processes for bio-mass,” Renew. Sust. Energ. Rev. 4(1), 1-73. DOI: 10.1016/S1364-0321(99)00007-6
Channiwala, S. A., and Parikh, P. P. (2002). “A unified correlation for estimating HHV of solid, liquid, and gaseous fuels,” Fuel 81(8), 1051-1063. DOI: 10.1016/S0016-2361(01)00131-4
Chen, D., Li, Y., Deng, M., Wang, J., Chen, M., Yan, B., and Yuan, Q. (2016). “Effect of torrefaction pretreatment and catalytic pyrolysis on the pyrolysis poly-generation of pine wood,” Bioresource Technol. 214, 615-622. DOI: 10.1016/j.biortech.2016.04.058
Chen, D., Zhou, J., and Zhang, Q. (2014). “Effects of torrefaction on the pyrolysis behavior and bio-oil properties of rice husk by using TG-FTIR and Py-GC/MS,” Energ. Fuels 28(9), 5857-5863. DOI: 10.1021/ef501189p
Cheng, Y. T., and Huber, G. W. (2011). “Chemistry of furan conversion into aromatics and olefins over HZSM-5: A model biomass conversion reaction,” ACS Catal. 1(6), 611-628. DOI: 10.1021/cs200103j
Chen, W. H., and Kuo, P. C. (2010). “A study on torrefaction of various biomass materials and its impact on lignocellulosic structure simulated by a thermos-gravimetry,” Energy 35(6), 2580-2586. DOI: 10.1016/j.energy.2010.02.054
Chen, Y., Wang, X., Li, K., Zhang, S., and Chen, H. (2012). “Effect of temperature on product property during biomass ploy-generation based on cotton stalk pyrolysis,” Proceedings of the Chinese Society of Electrical Engineering 32(17), 117-124.
Chew, J. J., and Doshi, V. (2011). “Recent advances in biomass pretreatment-Torrefaction fundamentals and technology,” Renew. Sust. Energ. Rev. 15(8), 4212-4222. DOI: 10.1016/j.rser.2011.09.017
Chiou, B. S., Valenzuela-Medina, D., Bilbao-Sainz, C., Klamczynski, A. P., Avena-Bustillos, R. J., Milczarek, R. R., and Orts, W. J. (2016). “Torrefaction of almond shells: Effects of torrefaction conditions on properties of solid and condensate products,” Ind. Crop. Prod. 86, 40-48. DOI: 10.1016/j.indcrop.2016.03.030
Khan, A. A., De Jong, W., Jansens, P. J., and Spliethoff, H. (2009). “Biomass combustion in fluidized bed boilers: Potential problems and remedies,” Fuel Process. Technol. 90(1), 21-50. DOI: 10.1016/j.fuproc.2008.07.012
Kumar, R., Mago, G., Balan, V., and Wyman, C. E. (2009). “Physical and chemical characterizations of corn stover and poplar solids resulting from leading pretreatment technologies,” Bioresource Technol. 100(17), 3948-3962. DOI: 10.1016/j.biortech.2009.01.075
Li, M. F., Chen, L. X., Li, X., Chen, C. Z., Lai, Y. C., Xiao, X., and Wu, Y. Y. (2016). “Evaluation of the structure and fuel properties of lignocelluloses through carbon dioxide torrefaction,” Energ. Convers. Manage. 119, 463-472. DOI: 10.1016/j.enconman.2016.04.064
Luo, K., Chen, H. P., Wang, X. H., Yang, H. P., and Zhang, S. H. (2007). “Character-ization of bio-char and its characteristics,” Renew. Energ. Res. 25(1), 17-19.
Lu, Q., Li, W. Z., and Zhu, X. F. (2009). “Overview of fuel properties of biomass fast pyrolysis oils,” Energ. Convers. Manage. 50(5), 1376-1383. DOI: 10.1016/j.enconman.2009.01.001
Mafu, L. D., Neomagus, H. W., Everson, R. C., Carrier, M., Strydom, C. A., and Bunt, J. R. (2016). “Structural and chemical modifications of typical South African biomasses during torrefaction,” Bioresource Technol. 202, 192-197.DOI: 10.1016/j.biortech.2015.12.007
Matali, S., Rahman, N. A., Idris, S. S., Yaacob, N., and Alias, A. B. (2016). “Lignocellulosic biomass solid fuel properties enhancement via torrefaction,” Procedia Engineering 148, 671-678. DOI: 10.1016/j.proeng.2016.06.550
Meng, J., Park, J., Tilotta, D., and Park, S. (2012). “The effect of torrefaction on the chemistry of fast-pyrolysis bio-oil,” Bioresource Technol. 111, 439-446. DOI: 10.1016/j.biortech.2012.01.159
Park, J., Meng, J., Lim, K. H., Rojas, O. J., and Park, S. (2013). “Transformation of lignocellulosic biomass during torrefaction,” J. Anal. Appl. Pyroly. 100, 199-206. DOI: 10.1016/j.jaap.2012.12.024
Phanphanich, M., and Mani, S. (2011). “Impact of torrefaction on the grindability and fuel characteristics of forest biomass,” Bioresource Technol. 102(2), 1246-1253. DOI: 10.1016/j.biortech.2010.08.028
Pimchuai, A., Dutta, A., and Basu, P. (2010). “Torrefaction of agriculture residue to enhance combustible properties,” Energ. Fuels 24(9), 4638-4645. DOI: 10.1021/ef901168f
Prins, M. J., Ptasinski, K. J., and Janssen, F. J. (2006). “More efficient biomass gasification via torrefaction,” Energy 31(15), 3458-3470. DOI: 10.1016/j.energy.2006.03.008
Sluiter, A., Hames, B., Ruiz, R., Scarlata, C., Sluiter, J., Templeton, D., and Crocker, D. (2008). Determination of Structural Carbohydrates and Lignin in Biomass (NREL/TP-510-42618), National Renewable Energy Laboratory, Golden, CO, USA.
Van der Stelt, M. J. C., Gerhauser, H., Kiel, J. H. A., and Ptasinski, K. J. (2011). “Biomass upgrading by torrefaction for the production of biofuels: A review,” Biomass Bioenerg. 35(9), 3748-3762. DOI: 10.1016/j.biombioe.2011.06.023
Wei, Y., Chen, M., Niu, S., You, X., and Xue, F. (2016). “Evaluation on oxy-fuel co-combustion behavior of Chinese lignite and eucalyptus bark,” J. Therm. Anal. Calorim. 123(2), 1667-1684. DOI: 10.1007/s10973-015-5050-x
Wen, J. L., Sun, S. L., Yuan, T. Q., Xu, F., and Sun, R. C. (2014). “Understanding the chemical and structural transformations of lignin macromolecule during torrefaction,” Appl. Energ. 121, 1-9. DOI: 10.1016/j.apenergy.2014.02.001
Yang, H., Yan, R., Chen, H., Lee, D. H., and Zheng, C. (2007). “Characteristics of hemicellulose, cellulose and lignin pyrolysis,” Fuel 86(12), 1781-1788. DOI: 10.1016/j.fuel.2006.12.013
Yang, C., Shen, Z., Yu, G., and Wang, J. (2008). “Effect and aftereffect of γ radiation pretreatment on enzymatic hydrolysis of wheat straw,” Bioresource Technol. 99(14), 6240-6245. DOI: 10.1016/j.biortech.2007.12.008
Yun, H., Li, K., Tu, D., Hu, C., and South, G. C. (2016). “Effect of heat treatment on bamboo fiber morphology crystallinity and mechanical properties,” Wood Res-Slovakia 61, 227-233.
Zhang, S., Chen, T., Li, W., Dong, Q., and Xiong, Y. (2016a). “Physicochemical properties and combustion behavior of duckweed during wet torrefaction,” Bioresource Technol. 218, 1157-1162. DOI: 10.1016/j.biortech.2016.07.086
Zhang, S., Dong, Q., Zhang, L., and Xiong, Y. (2016b). “Effects of water washing and torrefaction on the pyrolysis behavior and kinetics of rice husk through TGA and Py-GC/MS,” Bioresource Technol. 199, 352-361. DOI: 10.1016/j.biortech.2015.08.110
Zhang, Y., Yao, A., and Song, K. (2016c). “Torrefaction of cultivation residue of Auricularia auricula-judae to obtain biochar with enhanced fuel properties,” Bioresource Technol. 206, 211-216. DOI: 10.1016/j.biortech.2016.01.099
Zheng, A., Zhao, Z., Chang, S., Huang, Z., Zhao, K., Wei, G., and Li, H. (2015). “Comparison of the effect of wet and dry torrefaction on chemical structure and pyrolysis behavior of corncobs,” Bioresource Technol. 176, 15-22. DOI: 10.1016/j.biortech.2014.10.157
Zheng, A. Q., Zhao, Z. L., Jiang, H. M., Zhang, W., Chang, S., Wu, W. Q., and Li, H. B. (2012). “Effect of pretreatment temperature of pine on bio-oil characteristics,” Journal of Fuel Chemistry and Technology 40(1), 29-36.
Article submitted: December 22, 2016; Peer review completed: February 25, 2017; Revised version received and accepted: March 8, 2017; Published: March 23, 2017.
DOI: 10.15376/biores.12.2.3425-3447