
Abstract
Moisture changes during cyclic fluctuations of relative humidity (RH) usually affects wood service. To investigate the effects of different cyclic patterns of RH fluctuations on wood sorption, Populus euramericana was subjected to three dynamic sorption modes and a static adsorption-desorption loop. Moisture responses were measured automatically. Regarding the sorption amount, the average moisture content (MC), amplitude, and moisture sorption coefficient in a square pattern of humidity change were larger than those obtained from sinusoidal or triangular patterns, but all were less than those experienced in the static humid condition. For the sorption rate, the maximum phase lag was in the square pattern, and the corresponding value from sinusoidal pattern was about 1.5 times of that in the triangular pattern. The greatest dynamic diffusion coefficient (D) was also in square pattern, but less than the static value. Sorption kinetics were characterized by a mathematical model, which indicated that the highest dynamic MC gradient difference between center and surface was lower than that under the static condition, in the following order: square pattern > sinusoidal pattern > triangular pattern. The results could help with understanding the effects of cyclic RH changes on moisture change and the potential deformation during wood service.
Download PDF
Full Article
Effects of Cyclic Patterns of Relative Humidity on Moisture Sorption of Populus euramericana
Tiantian Yang, Erni Ma,* and Jingyu Li
Moisture changes during cyclic fluctuations of relative humidity (RH) usually affects wood service. To investigate the effects of different cyclic patterns of RH fluctuations on wood sorption, Populus euramericana was subjected to three dynamic sorption modes and a static adsorption-desorption loop. Moisture responses were measured automatically. Regarding the sorption amount, the average moisture content (MC), amplitude, and moisture sorption coefficient in a square pattern of humidity change were larger than those obtained from sinusoidal or triangular patterns, but all were less than those experienced in the static humid condition. For the sorption rate, the maximum phase lag was in the square pattern, and the corresponding value from sinusoidal pattern was about 1.5 times of that in the triangular pattern. The greatest dynamic diffusion coefficient (D) was also in square pattern, but less than the static value. Sorption kinetics were characterized by a mathematical model, which indicated that the highest dynamic MC gradient difference between center and surface was lower than that under the static condition, in the following order: square pattern > sinusoidal pattern > triangular pattern. The results could help with understanding the effects of cyclic RH changes on moisture change and the potential deformation during wood service.
Keywords: Cyclic humidity pattern; Dynamic; Moisture sorption; Relative humidity; Static; Wood
Contact information: Beijing Key Laboratory of Wood Science and Engineering, MOE Key Laboratory of Wooden Material Science and Application, Beijing Forestry University, Tsinghua Dong Road 35#, Haidian District, Beijing, 100083, China;
* Corresponding author: maerni@bjfu.edu.cn
INTRODUCTION
As an abundant natural material, wood is widely used in building, construction, furniture, artwork, etc., which benefit from its positive environmental impact, attractive technical superiority, renewability, sustainability, high strength with low weight, and good formability with low energy (Liu and Zhao 2012; Kong et al. 2018). However, its inherent hygroscopicity leads to many defects during the service of wood products. The amorphous areas of cellulose and hemicelluloses in wood contain hydroxyl groups that interact with ambient water molecules through hydrogen bonds, which changes the moisture content (MC) (Hosseinpourpia et al. 2016; Zhou et al. 2018). However, many important properties for the performance of wood products, such as strength and stiffness, are strongly dependent on MC (Tiemann 1906; Wagner et al. 2015). Some of the most troublesome issues of using wood, such as dimensional stability, biological degradation, and fastener corrosion, are affected by wood-water interactions (Skaar 1988; Engelund et al. 2013).
Moisture in wood is affected by many factors, but the relative humidity (RH) of the environment has the greatest impact (Skaar 1988). As the RH varies, the water in the atmosphere is adsorbed or desorbed by wood so that the moisture content of wood is continually changing.
A common method to investigate the way moisture interacts with wood is to determine the wood-water sorption isotherm. Sorption isotherms can be measured by obtaining the mass of a sample over a range of RH after equilibrium at a specific temperature (Engelund et al. 2013). Thus, the relation between equilibrium moisture content (EMC) and RH under constant temperature is attained by the sorption isotherm (Hoffmeyer et al. 2011), which can be divided into five types (Urquhart 1960). Type II isotherm is typical of the porous materials like wood, which characterizes the multi-molecules sorption (Simpson 1973; Willems 2015). As displayed in the sorption isotherm of type II, the EMC of wood increases with rising RH at a given temperature, as the number of accessible sorption sites monotonically increases with growing relative humidity (Willems 2014). The EMC of wood at a given RH and temperature is generally higher during the desorption process than in the adsorption process, which is called sorption hysteresis (Skaar 1988). Moreover, relative humidity affects not only the sorption amount but also the sorption rate (Droin et al. 1988), where moisture sorption kinetics are usually considered. Stamm (1959) explored the sorption process and reported that the moisture diffusion coefficient increased with moisture content. Kelly and Hart (1969) measured the rate of water vapour adsorption and desorption of yellow poplar and white oak and derived an empirical equation to fit the experimental data; however, limited success was achieved in relating the constant of the equation to the corresponding relative humidity. Ma et al. (2009) developed a theoretical equation to describe the wood adsorption and found that the adsorption rate constant first decreased and then increased slightly with a minimum value falling into the RH range from 60% to 70% as RH increased. However, previous research was conducted under constant RH, that is, the static condition. In practice, the atmospheric RH for wood products in service is varying continually (Schniewind 1967; Schniewind and Lyon 1973), i.e., under dynamic conditions. Therefore, it is important to study wood sorption under dynamic conditions.
Chomcharn and Skaar (1983) examined dynamic sorption and hygroexpansion of wood wafers under cyclic RH. Ma et al. (2005) investigated moisture responses of wood to periodical RH variations in a triangular wave. Sorption behaviors of wood subjected to squarely (Yang et al. 2015) and sinusoidally (Yang and Ma 2015) varying RH were reported systematically, and Ma et al. (2010) proposed an equation characterizing dynamic sorption kinetics by combining the surface sorption theory with Bradley sorption theory (Bramhall 1979). This model suggested that wood sorption rate was related to the rate at which sorption spaces could be made accessible to water molecules. The moisture diffusion coefficient D in the model could be dependent on species, density, MC, etc. (Ma et al. 2010).
This study investigated the effects of different cyclic patterns of RH on moisture sorption and kinetic characteristics and clarified the difference of moisture sorption between dynamic and static conditions. The results enrich the fundamental understanding of moisture sorption of wood in practice as well as provide technical parameters related to RH changes for the moisture control of wood products.
EXPERIMENTAL
Materials
Poplar (Populus euramericana) wood was harvested from the Greater Khingan Mountains in China. Clear, flat-sawn sapwood was cut into experimental specimens with the size of 20 mm in both tangential (T) and radial (R) directions with the thickness of 10 mm in longitudinal (L) direction. The average annual ring width was 3.5 mm, and the air-dried density was approximately 0.4 g.cm-3.
Methods
Experimental process
The specimens were separated into four groups and boiled in distilled water for 15 min to remove growth stress. They were air dried for 2 days and conditioned at 45% RH at 25 °C controlled by a saturated salt solution of potassium carbonate (Macromolecule 1958, Beijing Chemical Works Co., Ltd., Beijing, China) over 10 days to obtain equilibrated weights. Three groups were moved into a conditioning oven (DHS 225, YaShiLin Co., Ltd, Beijing, China) to conduct the RH cyclic tests, where the RH was changed in dynamic triangular, square, and sinusoidal patterns between 45% and 75% at 25 °C, with a cyclic period of 24 h. The remaining group with EMC conditioned in 45% RH was exposed to the conditioning oven, in which the RH was kept at 75% until the adsorption equilibrium was reached, and then decreased to 45% with holding for desorption equilibrium (defined as the static condition in this study). The equilibrium state was defined by a weight change of the sample less than 0.0001 g measured once every 24 h. Based on the pretreatment results, the equilibrium state was reached in this static condition within 2880 min (48 h). Figure 1 presents the experimental design. The RH (sensitivity ± 1%) and temperature (sensitivity ± 1 °C) in the oven were programmed to vary in discrete steps according to predetermined schedules, and a thermo-recorder (TR-72Ui, T and D Co., Ltd., Matsumoto, Japan) was placed near the specimens to monitor RH and temperature. Weight changes (mn) were measured every 15 min by an electronic analytical balance (ME104E, Mettler-toledo Co., Ltd., Columbus, USA) (sensitivity ± 0.1 mg) (Ma et al. 2010). The measured data including RH and temperature as well as weight changes were recorded automatically by the personal computer without opening the door of the conditioning oven throughout the tests, so the error from the RH change caused by opening the conditioning oven door (as in previous studies) was avoided.
Five end-matched replicates were used for each cyclic RH pattern. Each cyclic RH pattern was repeated three times, and the average value was presented as the final result. The related parameters in this experiment are summarized in Table 1.
Table 1. Main Parameters in the Experiment

Finally, the specimens were oven-dried at 103 °C for 48 h, and their oven-dried weights (m0) were measured for final determination of moisture content calculated according to Eq. 1,
 (1)
(1)
where mn is the weight of specimen during the sorption process and m0 represents the oven-dried weight of specimen.

Fig. 1. Experimental design
Theoretical model for moisture sorption
The theoretical model for moisture sorption considered both surface moisture exchange through the air-wood interface and internal diffusion within wood to investigate the dynamic moisture sorption (Ma et al. 2010). In this study, the specimen was divided into five ordinal elements along the thickness direction as 1 (Surface), 2 (Middle), and 3 (Center) symmetrically, as shown in Fig. 2.

Fig. 2. Schematic diagram of ordinal elements along the thickness direction of a specimen
Moisture exchange on the wood surface is given from mathematical model of Ma et al. (2010) as follows,
 (2)
(2)
where m is MC (%), the subscripts i-1, i are ordinal time points, a is sorption rate constant (h-1), h is RH for the surrounding atmosphere (%), is the time (h), K1 = 1.0327 – 0.000674T, K2 = 17.884 – 0.1432T + 0.0002363T2, K3 = 0.16, and T is temperature (K). K1, K2, and K3 are given by the Bradley equation (Bramhall 1979), and their values were validated by experimental isotherm curves.
For the transfer of moisture inside the wood, a numerical solution by the finite difference method (Bramhall 1979) was used, as follows,
 (3)
(3)
where D is the moisture diffusion coefficient (m2/s), the subscripts i-1, i are ordinal time points, j-1, j, j+1 are ordinal elements in thickness direction, and △l is the thickness of each element (m). The value of D was taken as a constant in the previous study. However, in the present case, it was considered to be MC-dependent and expressed by an exponential function in longitudinal direction (Skaar 1988).
D = 0.40 * 10-7 exp (0.11m) (4)
RESULTS AND DISCUSSION
General Moisture Responses
The general MC responses of poplar wood at different RH changing patterns over several cycles are shown in Fig. 3. Obviously, moisture content changes in similar shape with dynamic RH change, but with a phase lag, which is consist with previous studies (Yang et al. 2015). In addition, the dynamic MC gradually increases, especially for the minimum MC at 45% RH from cycle to cycle. This could be ascribed to there not being enough time for wood to respond to the RH. As a result, the real time MC is higher than the equilibrium MC at 45%. For the static cycle, the MC increased or decreased sharply at the beginning during the adsorption or desorption process, but it changed slowly and tended to become steady at the end.
Table 2 summarizes the average MC of poplar wood subjected to different RH changing patterns.
Table 2. Average Moisture Responses for Poplar Wood in Different Cyclic Sorption Patterns

a Data provided as the average (standard deviation) per cycle from five replicates

Fig. 3. RH and MC changes against cyclic time for poplar wood cycled at (a) triangular, (b) square, (c) sinusoidal and (d) static patterns
Generally, MC was higher in the square pattern than in the sinusoidal pattern, and the triangular MC was the lowest. However, the dynamic MC was less than the static value. This result was anticipated because the hydroxyl groups in wood could fully interact with the water molecules (Skaar 1988) under static condition with enough time provided. However, less water molecules are available to interact with hydroxyl groups of wood when there is less time to respond to the RH variation in dynamic patterns.
Amplitude and Phase Lag
The amplitude and phase lag of the moisture change are two parameters characterizing wood ability to respond to varying environments, which both depend on the reaction time of the wood-water system (Chomcharn and Skaar 1983).
Table 3 compares the effects of different RH patterns on moisture amplitude and phase lag for poplar wood. Apparently, the square pattern causes the strongest impact on dynamic amplitude during moisture sorption. As shown in Fig. 4a, this is because the amplitude is mainly determined by the MC response approaching the endpoint value. The slope of square pattern was near 0 at 45% RH and 75% RH, so that the MC could respond to the RH change more sufficiently. Comparing the sinusoidal and triangular patterns, the former slope was less, although it was larger than 0 approaching 45% RH and 75% RH. Thus the wood could respond to the RH change more easily when approaching 45% RH and 75% RH, and the dynamic MC in sinusoidal pattern could more approach the equilibrium MC at 45% RH and 75% RH with higher amplitude. Consequently, the amplitude of square pattern was the largest, while the triangular amplitude was the least relatively under dynamic condition. However, the static amplitude was greater than the dynamic value. This result was understandable because the slope of static pattern is 0 at 45% RH and 75% RH, and the time for wood to respond was longer than all the dynamic patterns.
In terms of phase lag, the largest one also appeared in the square pattern. This effect was due to the infinite slope of square pattern when the RH changed from 45% to 75%; as a result, it is more difficult to follow up the sudden change.
Differentiation can be mathematically defined as finding the rate of change at a certain point in the curve. As displayed in Fig. 4b, the result of differentiation of RH in the sinusoidal pattern was larger than in triangular pattern, so it is easier for the wood in triangular pattern to keep up with the change of RH, which could also explain its lowest phase lag.
Table 3. Amplitude and Phase Lag of Moisture Responses for Poplar Wood in Different Cyclic Sorption Patterns

a Data provided as the average (standard deviation) per cycle from five replicates
a

Fig. 4. Diagram of RH against cyclic time (a) and the differentiation of triangular pattern and sinusoidal pattern against cyclic time (b) for poplar wood
Moisture Sorption Coefficient
Moisture sorption isotherms against relative humidity for poplar wood are presented in Fig. 5. The moisture content in adsorption process was always less than in the desorption process in the three dynamic conditions and the static one, illustrating the existence of the sorption hysteresis. The slope of the sorption isotherm in Fig. 5 represents variation in MC per RH change “dm/dH”, known as the moisture sorption coefficient (MSC) (Chomcharn and Skaar 1983; Skaar 1988), an index used to evaluate wood hygroscopicity. Specifically, the amplitude above describes the wood responses to the whole RH changing range, whereas the MSC here reflects moisture variation against per RH change.

Fig. 5. Dynamic moisture sorption isotherms in the second cycle of triangular (a), square (b), sinusoidal (c) pattern and the static sorption isotherm (d) against relative humidity
As shown in Fig. 6, the MSC through the triangular RH pattern was lower than in the sinusoidal pattern. The square MSC was the highest among the dynamic values, but still lower than the static pattern, and the static MSC was approximately twice that of the dynamic value. This result reflects that more hydrogen bonds were formed, leading to greater moisture content within the same RH range in the static pattern than in the dynamic pattern (Skaar 1988).

Fig. 6. Moisture sorption coefficient in triangular, square, sinusoidal, and static pattern

Fig. 7. Comparison of theoretical curves with experimental results of dynamic sorption for poplar wood in different cyclic sorption patterns (triangular (a), square (b), sinusoidal (c), static pattern (d))
Dynamic Theoretical Sorption Modeling
Figure 7 compares the theoretical curves with experimental results in different dynamic or static patterns. The theoretical curves calculated by Eqs. 2 and 3 agreed with the experimental data. The average diffusion coefficient D, used in sorption modeling for the specimens, was calculated according to Eq. 4 and is listed in Table 4. The value of D was larger in the square pattern than in the sinusoidal pattern, followed by the triangular data. All dynamic values were lower than the static D, which was close to previous static results (Siau 1971). The static Din this experiment was about 1.3 times as much as the sinusoidal data, suggesting that the practical moisture diffusion was different from the previous static research results.
Table 4. Average Diffusion Coefficient (D) for Poplar Wood in Different Cyclic Sorption Patterns

a Data provided as the average (standard deviation) per cycle from several replicate tests.
The moisture gradient distributions at four typical time steps (adsorption beginning (I), 1/4 adsorption (II), 1/2 adsorption (III), final adsorption (IV)) during the sorption processes, calculated according to Eqs. 2 and 3, are shown in Fig. 8. The adsorption and desorption processes are abbreviated as A and D, respectively.
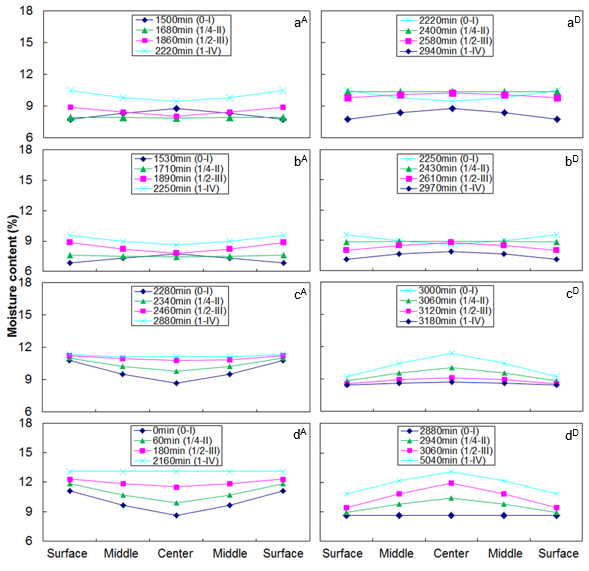
Fig. 8. Moisture distributions in the thickness direction of poplar wood under different dynamic sorption conditions: triangular (a), sinusoidal (b), square (c) during the second cycle, and static condition (d). A: adsorption, D: desorption
In the case of adsorption subjected to the triangular and sinusoidal patterns (Fig. 8 aA and bA), at the beginning of adsorption process, the RH increased for more than 1 h. However, moisture took a regular shape of desorption distribution (Jonsson 2004). When the 1/4 adsorption process was reached, the most uniform distribution was obtained by the adsorption of the surface and by desorption of the central part along the thickness direction of the specimens. At the midpoint of adsorption, the entire sample began to adsorb water, and a typical adsorption moisture distribution appeared. Therefore, initially the central part of the specimens did not respond to moistening. It took 6 h until the center part was affected. At the end of adsorption where MC reached the peak value, though RH had already decreased, the moisture gradient was lower than that at the 1/2 adsorption process. Nevertheless, the moisture gradient distribution was far from equilibrium.
For the adsorption process exposed to the square pattern (Fig. 8 cA), moisture distribution maintained a concave shape throughout the whole course. The MC difference between the surface and center decreased step-wise, and the uniform distribution was approached but not reached. A similar trend was found in the static condition (Fig. 8 dA). For the desorption process, the moisture distributions (Fig. 8 aD and dD) had the same tendencies as those for adsorption.
The MC gradient distribution is closely associated with the internal stress, causing severe deformation defects in wood (Gao 2008). To investigate the effect of RH pattern on wood MC gradient distribution, the maximum MC difference between surface and center was calculated as shown in Fig. 9. The MC gradient difference in wood was larger in the square pattern than in the sinusoidal pattern, followed by the triangular pattern. However, the MC gradient difference of square pattern between surface and center was less than that of the static condition. Again, less water molecules are available to interact with hydroxyl groups with shorter time for wood under dynamic conditions, especially the center part, leading to lower MC in the surface than the corresponding EMC in the static condition. The MC in the center was larger than the EMC; therefore, the MC gradient difference indicated a lower value. The static MC gradient difference was 1.7 times higher than the sinusoidal (daily) value. The higher MC gradient difference could result in larger moisture diffusion rate, causing a larger MC (Gao 2008). Therefore, the diffusion coefficient D and amplitude as well as the MSC discussed above were all larger in the square pattern than in the sinusoidal pattern. The MC gradient difference also suggests that the deformation was less than that triggered by the square pattern, while the triangular RH change pattern probably decreased wood deformation. This result was attributed to the abrupt change of RH in the square pattern, and the moisture in square pattern could not follow RH change at the beginning of the adsorption and desorption.

Fig. 9. The maximum MC difference between surface and center for poplar wood among different sorption patterns
CONCLUSIONS
- The square relative humidity (RH) change had the most significant effects on both sorption amount (the moisture content, the amplitude, moisture sorption coefficient) and sorption rate (phase lag, diffusion coefficient D). However, these sorption properties showed lower responses to the sinusoidal RH pattern.
- The moisture content gradient along the thickness direction from sinusoidal pattern was not as severe as that from the square pattern.
- Compared with the dynamic treatments, the static test gave higher hygroscopic results with less moisture content gradient within the specimens.
- The sinusoidal pattern was judged to be most similar to the natural weathering, and the results could further be used to evaluate the deformation of weathering-exposed wood products caused by the internal stresses developed from moisture content gradient during sorption.
ACKNOWLEDGEMENTS
The study is supported by the Fundamental Research Funds for the Central Universities (Grant No. 2019ZY03).
REFERENCES CITED
Bramhall, G. (1979). “Mathematical model for lumber drying, Part 1: Principles involved,” Wood Sci. 12(1), 14-21.
Chomcharn, A., and Skaar, C. (1983). “Dynamic sorption and hygroexpansion of wood wafers exposed to sinusoidally varying humidity,” Wood Sci Technol. 17(4), 259-277. DOI: 10.1007/BF00349914
Droin, A., Taverdet, J. L., and Vergnaud, J. M. (1988). “Modeling the kinetics of moisture adsorption by wood,” Wood Sci Technol. 22(1), 11-20. DOI: 10.1007/BF00353224
Engelund, E. T., Thygesen, L. G., Svensson, S., and Hill, C. A. S. (2013). “A critical discussion of the physics of wood-water interactions,” Wood Sci Technol. 47, 141-161. DOI: 10.1007/s00226-012-0514-7
Gao, J. M. (2008). Wood Drying, Science Press, Beijing.
Hosseinpourpia, R., Adamopoulos, S., and Mai, C. (2016). “Dynamic vapour sorption of wood and holocellulose modified with thermosetting resins,” Wood Sci. Technol. 50, 165-178. DOI: 10.1007/s00226-015-0765-1
Hoffmeyer, P., Engelund, E. T., and Thygesen, L. G. (2011). “Equilibrium moisture content (EMC) in Norway spruce during the first and second desorptions,” Holzforschung 65, 875-882. DOI: 10.1515/HF.2011.112
Jonsson, J. (2004). “Internal stresses in the cross-grain direction in glulam induced by climate variations,” Holzforschung 58(2), 154-159. DOI: 10.1515/HF.2004.023
Kelly, M. W., and Hart, C. A. (1969). “Water vapour sorption rates by wood cell walls,” Wood Sci. 1(4), 270-282.
Kong, L. Z., Guan, H., and Wang, X. Q. (2018). “In situ polymerization of furfuryl alcohol with ammonium dihydrogen phosphate in poplar wood for improved dimensional stability and flame retardancy,” ACS Sustainable Chem. Eng. 6, 3349-3357. DOI: 10.1021/acssuschemeng.7b03518
Liu, Y. X., and Zhao, G. J. (2012). Wood Resources in Materials Science, China Forestry Publishing House, Beijing. Macromolecule Academy. (1958). Physical Properties of Macromolecules, Kyoritsu Press, Tokyo.
Ma, E. N., Zhao, G. J., and Cao, J. Z. (2005). “Hygroexpansion of wood during moisture adsorption and desorption processes,” For Studies China 7(2), 43-46. DOI: 10.1007/s11632-005-0020-1
Ma, E. N., Nakao, T., and Zhao, G. J. (2009). “Adsorption rate of wood during moisture sorption processes,” Wood Res-Slovakia 54(3), 13-22.
Ma, E. N., Nakao, T., Zhao, G. J., Ohata, H., and Kawamura, S. (2010). “Dynamic sorption and hygroexpansion of wood subjected to cyclic relative humidity changes,” Wood Fiber Sci. 42(2), 229-236.
Schniewind, A. P. (1967). “Creep-rupture life of Douglas-fir under cyclic environmental conditions,” Wood Sci. Technol. 1(4), 278-288. DOI: 10.1007/BF00349759
Schniewind, A. P., and Lyon, E. D. (1973). “Further experiment of creep-rupture life under cyclic environmental conditions.” Wood Fiber 4, 334-341.
Siau, J. F. (1971). Flow in Wood, Syracuse University Press, Syracuse, NY, USA.
Simpson, W. T. (1973) “Predicting equilibrium moisture content of wood by mathematical models,” Wood and Fiber 5(1), 41-49.
Skaar, C. (1988). Wood-water Relations, Springer-Verlag, Berlin.
Stamm, A. J. (1959). “Bound-water diffusion into wood in the fiber direction,” Forest Prod. J. 9(1), 27-32.
Tiemann, H. D. (1906). Effect of Moisture upon the Strength and Stiffness of Wood, United States Department of Agriculture, Washington, D.C.
Urquhart, A. R. (1960). “Sorption isotherms,” in: Moisture in Textiles, J. W. S. Hearle and R. H. Peter (eds.), Wiley Interscience, New York.
Wagner, L., Bos, C., Bader, T. K., and de Borst, K. (2015). “Effect of water on the mechanical properties of wood cell walls – Results of a nanoindentation study,” BioResources 10 (3), 4011-4025. DOI: 10.15376/biores.10.3.4011-4025
Willems, W. (2014). “The water vapor sorption mechanism and its hysteresis in wood: the water/void mixture postulate,” Wood Sci Technol. 48 (3), 499-518. DOI: 10.1007/s00226-014-0617-4
Willems, W. (2015). “A critical review of the multilayer sorption models and comparison with the sorption site occupancy (SSO) model for wood moisture sorption isotherm analysis,” Holzforschung 69 (1), 67-75. DOI: 10.1515/hf-2014-0069
Yang, T. T., and Ma, E. N. (2015). “Dynamic sorption and hygroexpansion of wood subjected to cyclic relative humidity changes. II. Effect of temperature,” BioResources 10(1), 1675-1685. DOI: 10.15376/biores.10.1.1675-1685
Yang, T. T., Ma, E. N., and Shi, Y. (2015). “Dimensional responses of wood under cyclical changing temperature at constant relative humidity,” J. Korean Wood Sci. Technol. 43(5), 539-547. DOI: 10.5658/WOOD.2015.43.5.539
Zhang, M. H., Cazo, R., Cassens, D., and Xie, J. (2007). “Water vapor adsorption in kiln-dried red oak,” Wood Fiber Sci. 39(3), 397-403.
Zhou, H. Z., Li, J. Y., and Ma, E. N. (2018). “Static and dynamic sorption of lignin removed Populus euramericana,” Tappi Journal 17(2), 71-77. DOI: 32964/TJ17.02.71
Article submitted: March 6, 2019; Peer review completed: May 25, 2019; Revised version received: June 12, 2019; Accepted: June 15, 2019; Published: June 24, 2019.
DOI: 10.15376/biores.14.3.6397-6410