
Abstract
Fungal decay results in gradual decomposition of compounds of wood cell walls. Mass loss of wood is usually applied to characterize the decay. However, mechanisms of brown and white rot decay are significantly different, resulting in different degradation of components of wood cell walls. Either type of wood decay should differentially influence wood ultrastructure. The traditionally applied descriptors of wood ultrastructure, i.e. crystallinity, the average spacing of the crystal planes and crystallite size, characterize the ultrastructure in an insufficient way. Crystallographic texture analysis was applied in the present study to characterize changes in wood ultrastructure as a result of brown and white rot decay. The Orientation Distribution Function (ODF) was separately determined for wood decayed by brown rot and white fungi and for several levels of mass loss. A series of crystallographic descriptors was derived from the obtained ODFs. The descriptors consisted of texture index, crystalline volume fraction, and skeleton lines of the ODF. The identified crystallographic orientations confirmed different mechanisms of wood decay for brown and white rot fungi. The observations were supported by different rates of changes of the texture index and evolution of crystalline volume fraction.
Download PDF
Full Article
Effects of White and Brown Rot Decay on Changes of Wood Ultrastructure
Piotr Witomski,a Wiesław Olek,b,* and Jan T. Bonarski c
Fungal decay results in gradual decomposition of compounds of wood cell walls. Mass loss of wood is usually applied to characterize the decay. However, mechanisms of brown and white rot decay are significantly different, resulting in different degradation of components of wood cell walls. Either type of wood decay should differentially influence wood ultrastructure. The traditionally applied descriptors of wood ultrastructure, i.e. crystallinity, the average spacing of the crystal planes and crystallite size, characterize the ultrastructure in an insufficient way. Crystallographic texture analysis was applied in the present study to characterize changes in wood ultrastructure as a result of brown and white rot decay. The Orientation Distribution Function (ODF) was separately determined for wood decayed by brown rot and white fungi and for several levels of mass loss. A series of crystallographic descriptors was derived from the obtained ODFs. The descriptors consisted of texture index, crystalline volume fraction, and skeleton lines of the ODF. The identified crystallographic orientations confirmed different mechanisms of wood decay for brown and white rot fungi. The observations were supported by different rates of changes of the texture index and evolution of crystalline volume fraction.
Keywords: Crystallographic texture; X-ray diffraction; Scots pine (Pinus sylvestris L.); Wood decay; Coniophora puteana; Trametes versicolor
Contact information: a: Faculty of Wood Technology, Warsaw University of Life Sciences, Nowoursynowska 166, 02-787 Warsaw, Poland; b: Faculty of Wood Technology, Poznań University of Life Sciences, Wojska Polskiego 38/42, 60-627 Poznań, Poland; c: Institute of Metallurgy and Materials Science, Polish Academy of Sciences, Reymonta 25, 30-059 Kraków, Poland;
* Corresponding author: olek@up.poznan.pl
INTRODUCTION
Wood products are usually decayed by brown rot fungi (e.g. Kubicek 2013). The mechanisms of brown rot decay are primarily based on the action of decomposition agents that degrade cellulose and hemicelluloses, while lignin is practically not attacked (Highley et al. 1994; Green and Highley 1997; Goodell and Jellison 2001). The intensive breakage of cellulose chains is found even at the initial stage of brown rot. The late stages of decay are characterized by practically complete degradation of cellulose and hemicelluloses. However, the initial breakage of cellulose chains causes a significant loss of wood strength. Unlike brown rot, white rot can completely degrade wood structure, as it is also able to decay lignin. Moreover, white rot is characterized by a slower rate of cellulose degradation due to a different mechanism of decomposition of the cell wall components (e.g. Hastrup et al. 2012).
The significantly different mechanisms of wood degradation by brown rot and white rot fungi have to result in other changes in wood ultrastructure during the course of wood decay. The ultrastructural organization of cell wall compounds is often studied using X-ray diffraction methods. That was also the case of the influence of fungal decay on cell wall ultrastructure. Howell et al. (2009) studied changes in wood crystalline cellulose during brown rot decay and the ultrastructure changes were quantified with crystallinity as separately determined by the Ruland-Vonk method and Rietveld method. The analysis was extended by Hastrup et al. (2012), and changes in ultrastructure were studied for wood decayed by both brown and white rot fungi. However, crystallinity was determined by the same methods. A similar approach was used by Kim (2005) and the influence of white rot decay was analyzed by determining crystallinity with the Segal method. Recently, Darwish et al. (2013) applied X-ray diffraction analysis for characterizing decayed archeological wood and observed crystallinity decrease with the Segal method. The same method for crystallinity determination was used by Shangguan et al. (2014) for investigating wood decay caused by white rot fungi, and the obtained results were related to duration of the fungi development. Li et al. (2011) also applied the Segal method for crystallinity determination; however, the study was focused on wood decayed by brown rot fungi. The obtained results were again related to duration of fungi development. The reported studies were often supplemented by the estimation of the average spacing of the crystal planes (i.e. d-spacing from the 200 peak of X-ray spectra) or the crystallite size using the Scherrer equation.
Thygesen et al. (2005) as well as Bonarski and Olek (2011) pointed out problems related to the application of the discussed methods for crystallinity determination. It was emphasized among others that the most important disadvantage of the standard methods was finding a clear boundary between ordered and amorphous areas within the wood cell wall. Moreover, the so far applied characteristics of wood ultrastructure seem to describe changes in cell wall compounds in an insufficient way. Recently, Olek and Bonarski (2012, 2014) applied a series of crystallographic descriptors in order to characterize the influence of cyclic sorption and thermal modification on changes in wood ultrastructure. The descriptors were derived as a result of the performed crystallographic texture analysis and delivered valuable information not only on changes in crystalline cellulose but also on ultrastructural alteration in less organized areas of wood cell walls.
The objective of the present paper was to apply crystallographic texture analysis to characterize changes in wood ultrastructure as a result of brown and white rot decay. The applied set of the texture descriptors was related to the mass loss changes during wood decay for a better understanding of the influence of brown rot and white rot fungi on the deterioration of wood ultrastructure.
EXPERIMENTAL
The material for the investigations was obtained from Scots pine tree (Pinus sylvestris L.) with a diameter of 500 mm and length of 45000 mm. The dimensions of the samples cut from the material were 20 x 20 x 300 mm with the last dimension consistent with the longitudinal anatomical direction. Next, the samples were dried in an oven at 103 °C, and their oven dry mass was determined. The samples were also sterilized and placed in 1000 mL measuring cylinders filled with 300 mL malt-agar and covered with a mycelium of the fungi. Glass supports were placed between the samples and the agar media in order to avoid direct moisture flow between the malt-agar medium and the test samples. The malt-agar medium was prepared and sterilized for 25 min at 121°C in an autoclave according to PN-EN 113:1996/A1:2005 standard.
Two different fungi i.e. brown rot Coniophora puteana (Schum.: Fr.) P. Karst. isolate Eb.97 and white rot Trametes versicolor (L.: Fr.) Pilát. isolate Poznan were used during the investigations. The strains of the fungi were inoculated on the malt-agar medium. The samples were subjected to 27 different incubation periods including a control. The samples were incubated with fungi at 20 °C and relative humidity of 65%. Three replicates for each incubation time were prepared. A total of 78 samples exposed to C. puteana were incubated for a maximum of 26 weeks, and 3 samples were taken every week. Seventy-eight samples exposed to T. versicolor were incubated for the maximum of 52 weeks and again 3 samples were taken every second week. The selected samples were oven dried, and the mass loss was calculated. The control samples were stored at 20 °C and relative humidity of 65%. Two series of samples were obtained with increasing mass loss as a result of fungal decay. The mass loss caused by C. puteana ranged from 0% to 50% and from 0% to 51% in the case of T. versicolor. The dried samples were transferred into a climate chamber and equilibrated at temperature of 20 °C and relative humidity of 65%. The samples revealing the mass of ca. 0 (initial phase of decay), 5, 10, 15, 20, 25, 30, 35, 40%, as well as control samples were used in X-ray diffraction experiments. The samples were used to obtain rectangular prisms that were used in X-ray diffraction experiments. The thickness of the prisms was equal to ca. 6 mm and it corresponded to the radial anatomical direction. The two other dimensions of the prisms were 15 and 20 mm. The radial plane of the prisms was exposed to X-ray diffraction experiments.
The crystallographic texture experiments were made with a use of a Philips X’Pert system equipped with a texture goniometer ATC-3 in order to ensure controlled positioning of the investigated samples. Filtered X‑ray radiation CoKα (λ = 0.179026 nm) was used. During each X-ray diffraction experiment, 642 spectra were registered for 642 individual positions obtained by rotation and tilting of samples. The TL plane of earlywood was subjected to the experiments. The volume of the investigated material was equal to ca. 0.8 mm3. Sets of experimental, incomplete pole figures of (101), (001), and (010) planes were measured in the back-reflection mode (Schulz 1949). The sets of pole figures were separately determined for wood samples decayed by brown rot and white rot fungi as well as for each level of mass loss of the investigated material. The experimental pole figures after defocusing correction as well as normalization were the input data for determining the Orientation Distribution Functions (ODFs). The procedure modified by Bonarski and Olek (2006) as well as Olek and Bonarski (2006) was applied in order to obtain the ODFs for materials characterized by the monoclinic lattice symmetry. The texture-independent diffraction and background halo intensities of the crystalline and amorphous phases were accounted due to the application of the ODFs (Bonarski et al. 2000). The obtained ODFs were used to derive crystallographic descriptors quantifying changes in wood ultrastructure as induced by brown and white decay.
RESULTS AND DISCUSSION
The global changes of wood ultrastructure as described by the ODFs for the subsequent values of mass loss were separately quantified for brown and white rot with the use of the texture index (J), which was considered as the overall measure of the texture sharpness. The texture index was defined as an ODF integral over the domain of the crystallographic orientation (Bunge 1982). The definition implied that the texture index varied in the range of values of [1, ∞). Bonarski (2006) introduced the modification of the descriptor and proposed the normalized texture index (Jn). The modification resulted in expressing the texture index in a more convenient range, i.e. in the interval of [0, 1]. The determined values of Jn for the subsequent values of mass loss of Scots pinewood decayed by white and brown rot are depicted in Fig. 1. The observed values varied from 0.43 to 0.82 and from 0.52 to 0.82 for white and brown rot, respectively. However, in the case of brown rot, a rapid decrease of the property for the initial stages of the decay was found. It can be interpreted that the highly organized areas of wood tissue (i.e. crystalline cellulose) were intensively degraded at the initial stage of the decay. Much slower changes of the normalized texture index were observed for white rot when analyzing the initial decay. It was consistent with the earlier findings on white rot (e.g. Hastrup et al. 2012) indicating a slower rate of cellulose degradation.
The initial decrease of Jn was followed by some increase in its value for both brown and white rot. The observed increase is due to the fact that the normalized texture index is a relative property. During the course of wood decay, less organized areas of wood ultrastructure, i.e. hemicelluloses and non-crystalline cellulose, were also degraded. Therefore, the values of Jnhad to increase. It was observed for different stages of wood of decay and related again to different mechanisms of the decomposition of the cell wall components for brown and white rot. The advanced stages of wood decay also depicted significant differences in the rate of changes of the normalized texture index. A high rate of the property decrease was found for white rot. It was again consistent with the character of the decay mechanism that was characterized by more intensive decomposition of cell wall constituents for high values of mass loss. It was also found that at the initial stages of white rot the normalized texture index was gradually decreasing. This trend was observed up to the mass loss of 15%. By contrast, the brown rot was characterized by the significant fluctuations of the Jn values for the same range of the mass loss.
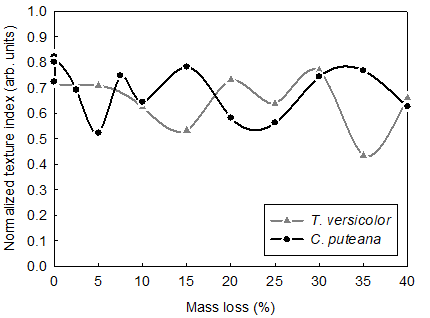
Fig. 1. Changes of the normalized texture index (Jn) for the subsequent levels of mass loss of Scots pine wood decayed by T. versicolor and C. puteana
In the case of mass loss above 15%, the values of the normalized texture index also varied for white rot. However, the changes of the property in the late stages of white decay were more frequent as compared to brown rot. The observed differences in the evolution of the normalized texture index support the already reported observations on different mechanisms of decay caused by T. versicolor and C. puteana.
Figures 2 and 3 present the integrated skeleton lines for the subsequent stages of wood decay as caused by brown rot and white rot fungi, respectively. The integrated skeleton lines represent the maximum values of the ODF, which is described in the orientation space of Euler angles (Bunge 1982). As the ODF is a function of three independent variables, the skeleton lines had to be depicted for a selected dimension of the orientation space, e.g. for the φ1 angle. The skeleton lines were obtained here as a result of the numerical integration of the elementary ODFs cells (i.e. Δφ1 by ΔΦ by Δφ2), which surrounded the maximum value in the related ODFs areas. Local maxima in the skeleton lines were identified. The maxima corresponded with the crystallographic orientations that dominated in the texture. It was found for brown and white rot fungi that the dominating texture component of the reference material, i.e. the orientation (3 ‑2 ‑1)[1 2 -1], significantly decreased even at the earliest stages of decay (Figs. 2 and 3). However, the initial decrease of the crystallographic texture was followed up by the development of other texture components. It was especially found for the mass loss of 15%. In the case of brown rot, the increase was moderate (Fig. 2) and it was found for the orientation of (1 0 0)[0 1 0]. The components of much higher intensities were noticed for white rot and it was manifested for the components labeled as the (1 0 2)[-2 5 1] and (0 0 -1)[0 1 0] (Fig. 3). Regarding the above described changes of individual orientations, the {100}<010> type component was mainly responsible for the observed fluctuations of the texture index, as depicted in Fig. 1.

Fig. 2. Integrated skeleton lines (intensity vs. φ1) of the orientation distribution function in the Euler orientation space depicted separately for mass loss levels of Scots pine wood decayed by C. puteana

Fig. 3. Integrated skeleton lines (intensity vs. φ1) of the orientation distribution function in the Euler orientation space depicted separately for mass loss levels of Scots pine wood decayed by T. versicolor
Crystallinity is another descriptor that is commonly used for describing the ultrastructure of decayed wood (e.g. Kim 2005; Howell et al. 2009; Darwish et al. 2013). However, the problems related with the property determination were already pointed out by Thygesen et al. (2005) as well as Bonarski and Olek (2011). Therefore, the concept of crystalline volume fraction was proposed by Bonarski and Olek (2011), and the parameter was applied in this study. The crystalline volume fraction was separately determined for white and brown rot and subsequent levels of mass loss (Fig. 4). The relatively small changes of the descriptor were found for white and brown rot decay, and a general tendency of crystalline volume fraction was found. However, some increase of the parameter was noticed for mass loss of 10 to 20%. It may be related to the decay of less ordered areas within wood cell wall and the relative increase of the content of highly organized areas. The phenomenon was more distinct for white rot decay (the maximum of the crystalline volume fraction was ca. 60%) and the maximum was found for the mass loss of 15%. In the case of brown rot the increase of the crystalline volume fraction was lower (up to ca. 50%), and it was noticed for higher mass loss, i.e. 20%.
Two different tendencies of crystalline volume fraction changes were observed for both types of wood decay, i.e. a general decrease of the property with mass loss as found for brown rot decay and noticeable increase for mass loss of 10 to 20% in the case of white rot decay (Fig. 4). Such a character of changes of the property depicts different mechanisms of the decay for both studied fungi. The ordered areas of wood cell walls were more intensively decomposed by brown rot fungi than by white rot ones. However, the conclusion needs further verification.

Fig. 4. Changes of the crystalline volume fraction for the subsequent levels of mass loss of Scots pine wood decayed by T. versicolor and C. puteana
The relatively high changes in the intensities of some texture components, e.g. (3 1 2)[-1 -3 0] and (3 -2 -1)[1 2 -1], as observed for mass loss evolution, indicated the significant transformation of the spatial arrangement of the texture components. The mentioned above crystallographic orientations indicated that the texture descriptors were very sensitive to the changes caused by the fungi decay, which was not necessarily related to the observed mass loss. The other descriptor applied in the present study, i.e. the texture index (Jn), represents, by definition, the total changes of the crystallographic texture comprising numerous individual texture components. For that reason the fluctuations of Jn illustrated a quite different aspect of the texture changes. For example, two different textures can be characterized by different sets of texture components due to their type and intensity, however with the same value of Jn. The described changes of the texture descriptors with mass loss were reflecting complex transformation of wood ultrastructure due to biochemical processes caused by rot and white decay. However, more detailed research in this area is still required.
CONCLUSIONS
- The observed ultrastructural changes of wood were less intensive for white rot decay than for brown rot decay. This observation was primarily due to the fact that during white rot decay, cell walls were gradually decomposed from lumens towards primary wall. Moreover, white rot fungi degraded at the same time all cell wall compounds.
- The mass loss of 0 to 20% of white rot was characterized by an increased organization of wood ultrastructure. The increase can be explained by degradation of the S3 layer which is characterized by cellulose microfibrils arranged within the 60 to 90° range and higher content of hemicelluloses as compared to the S2 layer.
- Brown rot decay was characterized by noticeable change in wood ultrastructure without observable mass loss. Moreover, the decay was marked by the simultaneous degradation of all layers of cell walls and their compounds, i.e. hemicelluloses, less organized and crystalline cellulose.
- The identified changes in crystalline structure of cell walls revealed different mechanisms of wood decomposition as caused by brown and white rot decay.
ACKNOWLEDGMENTS
The authors are grateful for the support of the Ministry of Science and Higher Education and the National Science Centre for the research grant N N309 035338.
REFERENCES CITED
Bonarski, J. T., Wróbel, M., and Pawlik, K. (2000). “Quantitative phase analysis of duplex stainless steel using incomplete pole figures,” Mater. Sci. Technol. 16, 657-662.
Bonarski, J. T. (2006). “X-ray texture tomography of near-surface areas,” Prog. Mater. Sci. 51, 61-149.
Bonarski, J., and Olek, W. (2006). “Texture function application for wood ultrastructure description. Part 1. Theory,” Wood Sci. Technol. 40, 159-171.
Bonarski, J. T., and Olek, W. (2011). “Application of the crystalline volume fraction for characterizing the ultrastructural organization of wood,” Cellulose 18(2), 223-235.
Bunge, H. J. (1982). Texture analysis in materials science, Butterworths, London.
Darwish, S. S., El Hadidi, N. M. N., and Mansour, M. (2013). “The effect of fungal decay on Ficus sycomorus wood,” Int. J. Conserv. Sci. 4(3), 271-282.
Goodell, B., and Jellison, J. (2001). “Non-enzymatic Gloeophyllum trabeum decay mechanisms: Further study,” International Research Group on Wood Preservation. Document No IRG/WP 01-10395: 1-4.
Green III, F., and Highley, T. L. (1997). “Mechanism of brown-rot decay: Paradigm or paradox,” Int. Biodeterior. Biodegrad. 39(2-3), 113-124.
Hastrup, A. C. S., Howell, C., Larsen, F. H., Sathitsuksanoh, N., Goodell, B., and Jellison, J. (2012). “Differences in crystalline cellulose modification due to degradation by brown and white rot fungi,” Fungal Biol. 116(10), 1052-1063.
Highley, T. L., Clausen, C. A, Croan, S. C., Green III, F., Illman, B. L., and Micales, J. A. (1994). “Research on biodeterioration of wood, 1987-1992. I. Decay mechanisms and biocontrol,” Forest Products Laboratory, U.S. Department of Agriculture, Research Paper FPL-RP-529.
Howell, C., Hastrup, A. C. S., Goodell, B., and Jellison, J. (2009). “Temporal changes in wood crystalline cellulose during degradation by brown rot fungi,” Int. Biodeter. Biodegr. 63(4), 414-419.
Kim, N. -H. (2005). “An investigation of mercerization in decayed oak wood by a white rot fungus (Lentinula edodes),” J. Wood Sci. 51(3), 290-294.
Li, G. -Y., Huang, L. -H., Hse, C. -Y., and Qin, T. -F. (2011). “Chemical compositions, infrared spectroscopy, and X-ray diffractometry study on brown-rotted woods,” Carbohyd. Polym.85(3), 560-564.
Kubicek, C. P. (2013). Fungi and Lignocellulosic Biomass, Wiley-Blackwell, Oxford.
Olek, W., and Bonarski, J. (2006). “Texture function application for wood ultrastructure description. Part 2. Application,” Wood Sci. Technol. 40, 336-349.
Olek, W., and Bonarski, J. T. (2012). “Influence of cyclic sorption on wood ultrastructure,” BioResources 7(2), 1729-1739.
Olek, W., and Bonarski, J. T. (2014). “Effects of thermal modification on wood ultrastructure analyzed with crystallographic texture,” Holzforschung DOI: 10.1515/hf-2013-0165.
PN-EN 113:1996/A1:2005. “Wood preservatives – Test method for determining the protective effectiveness against wood destroying basidiomycetes – Determination of the toxic values.”
Schulz, L. G. (1949). “A direct method of determining preferred orientation of a flat reflection sample using a Geiger counter X‑ray spectrometer,” J. Appl. Phys. 20, 1030-1033.
Shangguan, W., Ren, H., Lv, J., Fei, B., Chen, Z., Zhao, R., and Zhao, Y. (2014). “Cell wall property changes of white rot larch during decay process,” BioResources 9(3), 4297-4310.
Thygesen, A., Oddershede, J., Lilholt, H., Thomsen, A.B., and Ståhl, K. (2005). “On the determination of crystallinity and cellulose content in plant fibres,” Cellulose 12, 563-576.
Article submitted: July 7, 2014; Peer review completed: September 21, 2014; Revised version received: October 11, 2014; Accepted: October 12, 2014; Published: October 23, 2014.