
Abstract
The design of engineered wood products and timber structures involving numerical simulations requires knowledge of the elastic and strength properties of wood. This study characterized the elastic behavior of Uruguayan pine wood (Pinus elliottii and P. taeda). A series of compression tests with the load applied with respect to various grain directions and bending tests were performed on small and clear specimens to determine the elastic constants and establish the relationships between the longitudinal moduli of elasticity obtained by the two testing methods. Moduli of elasticity, shear moduli, and Poisson ratios were determined. The longitudinal stiffness values in compression from the same specimen obtained by the two testing methods were similar. The moduli of elasticity in tension and compression parallel to the grain for the elastic behavior was obtained from experimental bending tests, and the downshift of the neutral axis until rupture was found. Using a model that simulates the post-elastic behavior as a curve comprised of several straight lines, the stress-strain diagram for tension and compression parallel to the grain was obtained.
Download PDF
Full Article
Elastic Behavior of Fast-Growth Uruguayan Pine Determined from Compression and Bending Tests
Laura Moya a,* and Vanesa Baño b
The design of engineered wood products and timber structures involving numerical simulations requires knowledge of the elastic and strength properties of wood. This study characterized the elastic behavior of Uruguayan pine wood (Pinus elliottii and P. taeda). A series of compression tests with the load applied with respect to various grain directions and bending tests were performed on small and clear specimens to determine the elastic constants and establish the relationships between the longitudinal moduli of elasticity obtained by the two testing methods. Moduli of elasticity, shear moduli, and Poisson ratios were determined. The longitudinal stiffness values in compression from the same specimen obtained by the two testing methods were similar. The moduli of elasticity in tension and compression parallel to the grain for the elastic behavior was obtained from experimental bending tests, and the downshift of the neutral axis until rupture was found. Using a model that simulates the post-elastic behavior as a curve comprised of several straight lines, the stress-strain diagram for tension and compression parallel to the grain was obtained.
Keywords: Uruguayan pine; Pinus taeda; Pinus elliottii; Fast growing wood; Elastic constants; Elastic-plastic behavior
Contact information: a: Facultad de Arquitectura, Universidad ORT Uruguay, 2633 Br. España, 11300 Montevideo, Uruguay; b: Instituto de Estructuras y Transporte, Facultad de Ingeniería, Universidad de la República, 565 Julio Herrera y Reissig, 11200 Montevideo, Uruguay;
* Corresponding author: moya@ort.edu.uy
INTRODUCTION
In the last thirty years, Uruguay has remarkably increased the availability of wood supply because of a government policy to promote forest plantations. One quarter of a total 1 million planted hectares is dedicated to pine wood (Pinus sp.), which grows in intensively managed plantations, usually with thinning at the ages of 3, 5, and 15 years and harvesting at 25 years. This resource contains high proportions of juvenile wood, which leads to lumber with low structural properties (Moya et al. 2015). From this supply, approximately 2.7 million m3 of wood per year is available for industrial purposes other than energy production. Less than 19% is processed for sawn timber and plywood, and 1.7 million m3 of logs, mostly slash and loblolly pine (P. elliottii and P. taeda), have no industrial applications (Dieste 2014).
For a country like Uruguay, where building construction relies on masonry, steel, and concrete, information about the engineering properties of wood for structural applications lacked relevance until forest resources became available. With the current timber supply, along with several government policies intended to develop the forest-timber production chain (Uruguay XXI 2015), the design and manufacture of innovative structural products represents an opportunity for investment in value-added processes. Sawn timber and engineered wood products (EWP), such as glued laminated timber (Glulam) and cross laminated timber (CLT) designed with this available resource, could be extensively employed. Some examples of potential uses of these species are residential construction, light framing systems, prefabricated load bearing floors and walls in multi-story buildings, and long span glulam beams in buildings and civil structures. The design and modeling of wooden products and structures involving numerical simulations requires the full characterization of the elastic and strength properties of the wood (He et al. 2001; Baño et al. 2013; Nadir et al. 2014).
Because wood is commonly thought of as orthotropic, with three mutually perpendicular axes, longitudinal (L), radial (R), and tangential (T), its mechanical behavior is characterized by a strain-stress relationship, referred to as the LRT reference frame. This relationship is described by (Hooke’s law),

where  and
and  are the stress vector, strain vector, stiffness matrix, and compliance matrix, respectively. The terms of [S] relate the material elastic constants, EL or E0, ER, and ET are the moduli of elasticity, GTL, GTR, and GLR are the shear moduli, and νRT, νTR, νRL, νLR, νTL, and νLT are Poisson’s ratios.
Experimentally, the terms of [S] have been frequently determined by static tests, i.e., compression and tensile tests, on small and clear specimens for several species (Zhang and Sliker 1991; Ballarin and Nogueira 2003; Keunecke et al. 2008; Nadir et al. 2014; Vázquez et al. 2015). Other authors (Gao et al. 2016) have employed bending tests to determine the elastic constants. While a considerable amount of wood mechanics studies have focused on the determination of the elastic behavior, information about the properties in the longitudinal direction are far outnumbered by those for the other main directions. The Young’s moduli in the radial and tangential directions are usually derived from the longitudinal stiffness (Bodig and Jayne 1993). Even less is known about the elastic behavior of juvenile wood, which is frequently found in fast-growth timber harvested at an early age. The low specific gravity, short fibers, and high microfibril angle of juvenile wood seriously affects the stiffness and strength properties (Bendtsen 1978; Kretschmann and Bendtsen 1992; Cave and Walker 1994; Kretschmann 1997).
For a few species, the complete set of the main elastic parameters is reported as an estimate of average values in the Wood Handbook (USDA 2010). Table 1 shows the elastic constants for mature loblolly and slash pine wood.
Table 1. Reference Elastic Constants of Loblolly and Slash Pinea

In Uruguay, most information about the elastic properties of pine species is limited to the longitudinal modulus of elasticity obtained from static bending tests (O’Neill et al. 2002, 2003; Moya et al. 2013). Due to its easy implementation, bending tests are usually the preferred method for E0 determination, rather than axial tests. However, the modulus of elasticity differs in the compressive zone (Ec) and tensile zone (Et). In the longitudinal direction, timber under tension behaves linearly until failure, while under compression, timber is elastic-plastic. Based on Navier-Bernoulli’s hypothesis of plane strain sections remaining plane, the behavior of compressive stresses in the section of a clear wood specimen can be divided into three phases: 1) linear and elastic in the first phase, 2) elastic-plastic in the second phase, and 3) creep until failure in the third phase. The yield stress in compression (σc,y), ultimate tension stress (σt,u), ultimate compression stress (σc,u), stiffness in tension, and stiffness in compression usually define the longitudinal stress-strain curve for the different phases of wood behavior (Argüelles and Arriaga 2013). In a bending test, as the load increases, the neutral axis shifts down so that the stresses of tension and compression are equilibrated. In clear wood specimens, rupture occurs in the tensile zone after failure in the compression zone. In compression perpendicular to the grain, behavior is almost linear in the first phase and failure is caused by flattening, without a clearly defined failure (Argüelles and Arriaga 2013).
Structural calculations according to Eurocode 5 (EN 1995 2014) are simplified to elastic behavior. European standards (EN 338 2016) refer to the characteristic values of stiffness and strength for only two directions: parallel to the grain as the longitudinal direction, and perpendicular to the grain as an intermediate value between the radial and tangential directions. The strength and stiffness parallel to the grain are referred to as f0 and E0, respectively. For the perpendicular direction with respect to the grain, the strength and stiffness are referred to as f90and E90, respectively. The downward shift of the neutral axis is not taken into account for timber design.
This study characterized the elastic behavior of Uruguayan fast growing pine. The specific objectives included: i) to determine the elastic constants by compression tests; ii) to obtain the modulus of elasticity and maximum elastic stresses in compression and tension from compression and bending tests; iii) to define the stress-strain diagram in the longitudinal direction; and iv) to quantify the downward shift of the neutral axis under bending until rupture.
EXPERIMENTAL
The material for this study was obtained from pieces of pine lumber (Pinus elliottii and P. taeda) from a more general research study (Moya et al. 2009). Ten boards (150 x 60 x 3300 mm) with the physical and elastic axes of symmetry matching in the L, R, and T directions were carefully selected. From each board, two sets of small and clear samples were cut. Specimen dimensions were limited by dimensions of the boards from which they were extracted. The first set was comprised of six specimens (20 x 20 x 60 mm) for the compression parallel (a), perpendicular (b and c), and at 45° to the grain tests (d, e, f), following suggestions by Aira et al. (2014). The second set had two specimens that were cut close to one another, where one (21 x 21 x 630 mm) was for the bending tests (g), and the other (20 x 20 x 60 mm) was for the compression parallel to the grain tests (h). This second set was used to increased number of compression parallel specimens and to relate compression parallel and bending moduli of elasticity. The cutting pattern for the samples with the wood grain orientation relative to the orthotropic directions is shown in Fig. 1. All specimens were equilibrated close to a 12% moisture content (MC) in a controlled condition chamber (20 °C and 65% relative humidity).

Fig. 1. Cutting patterns for specimens taken from the same board. The letters refer to the type of test performed on the specimens: (a) parallel to the grain, (b) perpendicular to the grain tangentially, (c) perpendicular to the grain radially, (d) at 45° LT, (e) at 45° RT, (f) at 45° LR, (g) bending, and (h) compression parallel to the grain
Compression Tests
Prior to testing, a series of strain gauges (120 , 10-mm KFG-10-120-C1-11, Kyowa Americas Inc., Novi, MI, USA) were bonded to each specimen for strain registration. A typical specimen bonded with instruments is shown in Fig. 2a.
The tests were performed according to UNE 56535 (1977) and UNE 56542 (1988) in a controlled climate chamber (20 °C and 65% relative humidity), using a Universal Minebea machine (Tokyo, Japan) with a 50-kN load cell and cross head speed of 0.2 mm/min (Fig. 2b).

Fig. 2. a) Compression parallel specimen; b) test configuration
Determination of elastic constants
The elastic constants in the i direction (L, R, and T) were obtained from the set 1 and 2 compression samples by:

where Ei is the modulus of elasticity in the i direction (L, T and R); i is the normal stress in the idirection; i,j,k is the Poisson coefficient in the i, j, k (ijk) directions; and i,j,k is the strain of the gauge in the i, j, k directions, respectively.
The shear moduli were obtained from the compression tests on the specimens with the applied load oriented at 45° with respect to the direction of the grain, as suggested by Aira et al. (2014),

where Gxy is the shear modulus in the xy planes (LR, LT and RT); xy is the shear stress in the xy planes; xy is the strain in the xy planes; y´ is the normal stress; x´ and y´ are the strain gauges in the x´ and y´ directions, where x´ and y´ are the axes of a coordinate system rotated at 45 degrees respect to the main coordinate system x y.
The longitudinal Young’s moduli at 45° with respect to the three planes of symmetry were determined by,

where E45,xy is the modulus of elasticity at 45º with respect to the xy planes (LR, LT and RT); and v and v are the normal stress and normal strain, respectively.
Estimation of the elastic limit and stress at the elastic limit
For compression parallel to the grain, the elastic limit was estimated as the point where the load-strain curve deviated from a straight line that had a segment with a regression coefficient (R2) value of 0.999.
The stress values at the elastic limit for the longitudinal direction in the LT and LR planes (c,y_LT and c,y_LR, respectively) were determined by dividing the load at the elastic limit by the cross-sectional area of the test specimen.
Compression strength parallel to the grain
The compression strength parallel to the grain (fc,0) was determined by,

where Fc,0,max is the maximum load (N) and A is the cross-sectional area (mm2) of the specimen.
Bending Tests
Four-point bending tests were performed on the bending specimens from set 2 according to the standard for structural timber EN 408 (2011), as shown in Fig. 3b. The distance between the loading points and supports was 120 mm. Specimens with cross-sections matching in the RT plane were carefully selected. Two strain gauges, each positioned on the mid length of the upper and lower R face, were used to measure the compression and tension strains, respectively. The cross head speed was 4.5 mm/min.
In the elastic range of the stress-strain diagram, both the tension and compression behave linearly; therefore, the values of the modulus of elasticity in tension and compression can be obtained from the bending moment that has been determined experimentally, with the knowledge of the neutral axis location.

Fig. 3. a) bending specimen; b) test configuration
Neutral axis location
Assuming a linear distribution for both the tension and compression strains until failure, the location of the neutral axis for each associated load was determined by the intersection of the straight-line connecting strains in compression and tension with the ordinate axis. The downshift of the neutral axis (e), as a function of the compression and tension strains and the height of the specimen, was deduced from the straight-line equation, and computed by,
 (6)
(6)
where εc is the longitudinal strain in compression (unitless), εt is the longitudinal strain in tension (unitless), e is the downshift of the neutral axis with respect to the 0-value in the y-axis (mm), and h is the height (mm) of the cross-section of the specimen.
Moduli of elasticity in tension and compression parallel to the grain for the elastic behavior
The moduli of elasticity were obtained as the relation between the difference of stresses and strains, on a straight line of the stress-strain curve, using the portion of the line between 10% and 40% of the maximum load from the bending tests. The calculation is as follows,
 ;
;  (7)
(7)
where σc,40-σc,10 is the increment of stress in compression corresponding to the increment of loads F40-F10 (N/mm2), σt,40-σt,10 is the increment of stress in tension corresponding to the increment of loads F40-F10 (N/mm2), εc,40-εc,10 is the increment of strains in compression corresponding to F40-F10 (unitless), εt,40-εt,10 is the increment of strains in tension corresponding to F40-F10 (unitless), F40-F10 is the increment of load on the straight line portion of the load-strain curve (N), and F10 and F40 is 10% and 40% of the Fmax, respectively.
Stresses in compression and tension parallel to the grain
In the elastic phase, the stress-strain diagram is linear both in tension and compression; therefore the compression and tension stresses were calculated from the bending moment and location of the neutral axis for the corresponding load (Fig. 4), by:
 (8)
(8)
 (9)
(9)
where M is the bending moment obtained from the experimental tests (N/mm2), e is the downshift of the neutral axis for the corresponding load of the bending moment (mm), b and h are the width (mm) and height (mm) of the cross-section of the specimen, respectively, and σc and σt are the compression and tension stress (N/mm2), respectively, for the elastic phase.
The stress at the elastic limit in compression (σc,y) was obtained following similar methodology to that of the compression tests.
The post-elastic stress-strain curve of wood under compression parallel to the grain was simulated with three elastic-linear straight sections in the stress-strain diagram, as shown in Fig. 4. Four load states were considered: the first, for the linear and elastic behavior corresponded to Phase 1 (Fig. 4a), and the other three, for the stress-strain curve corresponded to Phase 2 (Fig. 4b). Knowing the downshift of the neutral axis for each state and that the area of the compressed side (comprised of rectangles and triangles) was equal to the area of the tensile side, the maximum stress for each straight section was calculated. Similarly, the modulus of elasticity for each section was computed as the quotient of the difference between the stresses and strains at the initial and final points of the straight line.

Fig. 4. Stress-strain curve for the load states: a) elastic behavior in Phase 1; b) post-elastic behavior in Phase 2
Bending strength
The bending strength was computed from the maximum load in the bending tests, by (EN 408 2011),
 (10)
(10)
where fm is the bending strength (N/mm2), M is the bending moment (N/mm), W is the section modulus for a rectangular cross-section (mm3), Fmax is the maximum load (kN), a is the chord shear length (mm), and b and h are the width (mm) and height (mm) of the cross-section of the specimen, respectively.
RESULTS AND DISCUSSION
Compression Tests
The compressive load-strain curves for the longitudinal, radial, tangential, and at 45° specimens were obtained using the mean values of the axial deformations from the respective parallel faces. The elastic constants were determined in the linear phase of the load-strain diagram within the range of 10% to 40% of the maximum load.
Compression parallel to the grain tests
Table 2 shows the results of the elastic and strength properties from the parallel to the grain tests. The mean values of the density and moisture content (MC) of the tested specimens were 0.421 (coefficient of variation, CoV = 10%) and 11.9 (CoV = 4%), respectively.
Table 2. Compression Parallel to the Grain Tests

A one-way analysis of variance (ANOVA) was performed on the experimental data to test the significance of the differences between the properties obtained for the LT and LR planes. No statistical differences (P > 0.05) for the stiffness (ELT versus ELR), stresses (c,y_LT versus c,y_LR), and strengths (fc,0_LT versus fc,0_LR) were found. Further comparison of the mean values of ELT and ELR for the four specimens with the same ID showed a relative difference of 3% to 5%. The experimental results of EL (ELT or ELR) were about half that of the values for loblolly (12300 N/mm2) and slash pine (13700 N/mm2) given in the Wood Handbook (USDA 2010), and could be attributed to the presence of juvenile wood in most specimens. Juvenile wood, compared to mature wood, contains higher microfibril angle and lower relative density, that acting together affects the stiffness (Kennedy 1995). It should be noted that the samples analyzed in the present study came from trees that were harvested at 25 and 15 years old. Bearing in mind that transition from juvenility to maturity in loblolly and slash pine usually occurs between 14 and 18 years old (Clark and Saucier 1989; Ballarin and Palma 2003), and the fact that during the first 30 years of growth stiffness increases 3 to 5 times (Cave and Walker 1994), it is not inconsistent that our samples showed low stiffness values.
The mean values of the Poisson’s ratios for the LT and LR planes, adjusted to 12% MC, were 0.419 and 0.507, respectively. While the first was within the range of values for loblolly and slash pine, the second was higher than the corresponding references (0.328 and 0.392, respectively) reported in Table 1.
The elastic limit was reached at an average value of the 1.3- and 1.4-times the maximum load for compression parallel to the grain in the LT and LR planes, respectively. As a result, elastic behavior was guaranteed for loads lower than 0.4-times the maximum load required in EN 408 (2011). The mean values of 27 and 26 N/mm2 for the compression strength parallel to the grain agreed with previous results for the same species (Moya et al. 2013).
Compression perpendicular to the grain tests
For compression perpendicular to the grain, the mean values of the Young’s moduli from 10 specimens per direction (R or T), adjusted to 12% MC, were an ER of 1010 N/mm2 (CoV = 10%) and ET of 517 N/mm2 (CoV = 21%). These values were close to those listed for ER and ET in the Wood Handbook (USDA 2010) for the same species (Table 1). Moreover, the anisotropy ratio on the transverse plane (ER/ET) was 2, which is in good agreement with published values. The average values of the moduli ratios were an EL/ER of 6 and EL/ET of 12, which were approximately half that of the respective ratios for loblolly (EL/ER = 11 and EL/ET = 27) and slash pine (EL/ER = 12 and EL/ET = 22) (USDA 2010). These findings suggested that juvenile wood more intensely affects the Young’s modulus in the longitudinal direction than in the other directions. In line with our findings, Kretschmann (2008) working with clear wood loblolly pine, reported that modulus of elasticity in compression perpendicular to grain either radially or tangentially, was less sensitive to changes in juvenile wood content for a given orientation, than ring orientation.
The mean values of Poisson’s ratios, adjusted to 12% MC from 10 specimens per direction (R or T), were a RT of 0.135 (CoV = 33%) and TR of 0.153 (CoV = 78%). According to Table 1, the reference RT and TR values are 0.415 and 0.375, respectively, which are 2.8- and 2.3-times higher than the experimental results obtained from the Uruguayan pine. The data of the RLand TL, not reported here, was not reliable because eccentricity of the applied load on some specimens was observed during testing. In some cases, the values were positive for one face (compression) and negative for the other (tension), which affected the average measurements, and was responsible for the inconsistency of the RL and TL values.
The coefficients of variation for the Poisson’s ratios obtained in the compression perpendicular to the grain (either radially or tangentially) tests were higher (all above 31%) than those from the compression parallel to the grain tests (below 20%). Similar observations were reported by Sliker (1985), who argued that the orientation of the wood cell axes influences the growth ring curvature, and the change from earlywood to latewood along with other factors may explain data variability.
Compression at 45° to the grain tests
The shear properties of the specimens with an off-axis angle of 45° were determined in the LR, LT, and RT planes. The mean values of the shear moduli, adjusted to 12% MC, were a GLRof 984 N/mm2 (CoV = 38%), GLT of 605 N/mm2 (CoV = 38%), and GRT of 523 N/mm2 (CoV = 38%). Ten specimens per direction were tested. The GLR was within the range of published values (USDA 2010), while the GLT was 30% lower and GRT was 3.5-times higher than the reported values. The heterogeneous results from the off-axis measurements, reflected by high coefficients of variation, could be attributed to the influence of the growth ring curvature, as suggested by Garab et al. (2010).
The mean values of 10 specimens per direction, adjusted to 12% MC, for the longitudinal moduli of elasticity at 45° to the grain in the LR, LT, and RT planes were an E45,LR of 2080 N/mm2 (CoV = 17%), E45,LT of 1271 N/mm2 (CoV = 27%), and E45,RT of 461 N/mm2 (CoV = 25%). The experimental E45,LR and E45, RT values agreed with the values reported by Aira et al. (2014) for mature P. sylvestris (E45,LR = 2187 N/mm2 with 28% CoV, and E45,RT = 310 N/mm2 with 30% CoV), while the E45, LT value was half that of the reference (E45,LT = 2385 N/mm2 with 29% CoV).
Summary of elastic constants
Table 3 summarizes the elastic parameters obtained from this study.
Table 3. Elastic Constants of Fast-Growth Uruguayan Pinea Determined from the Compression Tests

From Table 3 the following relationships between elastic constants were obtained:
- EL: ER : ET ≈ 11.07 : 1.95 : 1;
- EL: ER ≈ 5.7 : 1;
- GLR: GLT: GRT ≈ 1.9 : 1.2 : 1;
- GLR: GLT ≈ 1.6 : 1;
- EL: GLR ≈ 5.8 : 1
The relationship between modulus of elasticity in the longitudinal direction and in the radial direction was half of the value reported in the literature (Bodig and Jayne 1993). A similar difference was found for the relationship between the longitudinal stiffness and the shear modulus of elasticity in the LR plane.
Bending Tests in the Elastic Phase
The longitudinal moduli of elasticity in tension (Et) and compression (Ec) were derived from the experimental bending moment, and the ratio of Et/Ec was computed. Ec was compared with the corresponding EL obtained from the compression tests.
The typical load-strain diagrams from compression parallel to the grain and bending tests are shown in Fig. 5. For specimens 9 and 12, Fig. 5a depicts the compression load-strain diagrams from the compression parallel to the grain tests (9 (h) and 12 (h)), and Fig. 5b shows the compression and tension load-strain diagrams derived from the bending tests (9 (g) and 12 (g)).

Fig. 5. Load-strain diagrams in the LR plane from the a) compression tests and b) bending tests
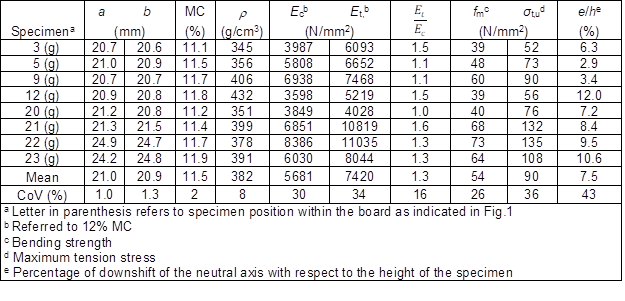
Table 4 shows the properties obtained from the bending tests. A mean value of 1.3 for the Et/Ec ratio agreed with the values reported in the literature (Conners and Medvecz 1992; Baño et al. 2012).
For the four specimens with the same ID, the mean value of Ec derived from the bending tests (Ec = 5309 N/mm2) was in agreement with the corresponding Ec obtained in the compression tests (Ec = 5311 N/mm2). These were promising results, but the insufficient number of replicates prevents drawing conclusions with regards to similarities of the moduli. It is worth noting that large differences between the moduli of elasticity from the bending and compression tests were found when eccentricity in the compression tests was observed (e.g., specimen 12 (a)).
At the maximum load in the bending tests, specimen failure occurred on the tensile side. The bending strength (fm) and location of the neutral axis (e) for the maximum stress in tension (σt,u) were estimated. Assuming a linear behavior in tension until failure and a constant Et, a mean value of 90 N/mm2 for σt,u was found. The mean value of the bending strength was 54 N/mm2, and the downshift of the neutral axis at the maximum load varied between 2.9% and 12% with respect to the height of the specimen.
Table 4. Elastic and Strength Properties Determined from the Bending Tests

The elastic limit was more difficult to determine in the bending tests than in the compression tests. The reason for this was that there was a less steep transition from the straight- to curvilinear-line of the compression load-strain diagram obtained from the bending tests compared with that obtained from the compression tests (Fig. 5). The yield stress (σc,y) obtained in the bending tests was 27 N/mm2 (CoV = 30%), which was 30% higher than the value obtained in the compression tests. This difference could be attributed to the fact that the σc,ydetermined by the bending test falls in the non-linear phase; therefore, Hooke’s law is not valid for its estimation. Similar to this finding, Pérez-Zerpa et al. (2017), using a novel method to identify the elastoplastic properties of P. taeda from artificial data, found that the yield stress from the bending tests was 45% higher than the corresponding stress obtained from the compression tests.
Measuring the longitudinal compressive strains in the bending tests addressed the problems related to load eccentricity observed during the compression testing. Furthermore, the bending test has the advantage of being able to simultaneously measure tensile and compressive strains. Thus, problems regarding insufficient clamping frequently observed during the testing of specimens in tension parallel to the grain were avoided.
Bending Tests in the Post-Elastic Phase
The stress-strain diagram in the post-elastic phase for the longitudinal direction was estimated, and is shown in Fig. 6.

Fig. 6. a) Stress-strain diagram parallel to the grain; b) stress distribution through the height of the specimen
Figure 6a depicts the stress-strain diagram for specimen 22 (g). Figure 6b shows the stress distribution through the height of specimen 23 (g), and the downshift of the neutral axis with respect to the centroid of the cross-section was determined. The stress distribution for the specimens shown in Fig. 6 was congruent with the simulation results previously reported by Baño et al. (2012). However, for most of the specimens, the diagrams obtained using the methodology previously described followed a saw-tooth pattern, as depicted in Fig. 7. The figure showed the error sensitivity of the applied method in the strain measurements. A similar response was reported by Iraola-Sáenz (2016) for the simulated post-elastic behavior with five straight lines and their corresponding slopes.

Fig. 7. Stress-strain diagram parallel to the grain (saw-tooth pattern)
CONCLUSIONS
- The experimental results of the longitudinal modulus of elasticity in compression tests were about half of the values reported in the literature for the same species, findings that could be attributed by the presence of juvenile wood observed in most specimens.
- The results from the compression tests showed that the modulus of elasticity in the radial direction had an approximate value of 1/6 of the longitudinal modulus of elasticity (ER≈ EL/6). The shear modulus in the LR plane showed an approximate value of 1/6 of the longitudinal modulus of elasticity (GLR ≈ EL/6). The Poisson’s ratios were highest in the LR plane, and were lowest in the RT plane.
- The longitudinal moduli of elasticity in tension (Et,) and compression (Ec) were derived from the experimental bending moment, and a value of 1.3 for the Et/Ec ratio was found. Additionally, the mean value of the modulus of elasticity in compression from the bending tests was close to that from the compression parallel to the grain tests.
- The downward shift of the neutral axis due to the differences in the modulus of elasticity in tension and compression parallel to the grain until tensile failure was estimated to be 7.5% with respect to the height of the specimens.
- The methodology presented in this study for the estimation of the compression yield stress was valid for the compression tests, but not for the bending tests. The mean values of the yield stress from the compression tests were 20 and 19 N/mm2 for the strains measured in the LT and LR planes, respectively.
- The simulation of the post-elastic behavior of wood in compression parallel to the grain, assuming a curve comprised of several straight lines and using the equilibrium method of areas in tension and compression for different load states, was applicable for the experimental data.
ACKNOWLEDGMENTS
This research was supported by the Agencia Nacional de Investigación e Innovación, ANII, Grant # INI_X_2013_1_101164 and INI_X_2013_1_101202. The authors gratefully acknowledge Hugo O’Neill and Matías Cagno at the Laboratorio Tecnológico del Uruguay, LATU, Juan Perlas, and Juan M. González.
REFERENCES CITED
Aira, J. R., Arriaga, F., and Iñiguez-González, G. (2014). “Determination of the elastic constants of Scots pine (Pinus sylvestris L.) wood by means of compression tests,” Biosystems Engineering 126,12-22. DOI: 10.1016/j.biosystemseng.2014.07.008
Argüelles, R., and Arriaga, F. (2013). Estructuras de Madera. Bases de Cálculo [Wood Structures. Bases of Calculation], AITIM, Madrid, Spain.
Ballarin, A., and Nogueira, M. (2003). “Caracterização elástica da madeira de Eucalyptus citriodora,” Cerne 9(1), 66-80.
Ballarin, A.W. and Palma, A.L. (2003). “Propriedades de resistencia e rigidez da madeira juvenile e adulta de Pinus taeda L.”, R. Arvore, Vicosa-MG. 27 (3), 371-380.
Baño, V., Argüelles-Bustillo, R., Regueira, R., and Guaita, M. (2012). “Determinación de la curva tensión-deformación en madera de ‘Pinus sylvestris‘ L. para la simulación numérica de vigas de madera libre de defectos,” Mater. Construcc. 62(306), 269-284. DOI: 10.3989/mc.2012.64110
Baño, V., Arriaga, F., and Guaita, M. (2013). “Determination of the influence of size and position of knots on load capacity and stress distribution in timber beams of Pinus sylvestris using finite element model,” Biosystems Engineering 114(3), 214-222. DOI: 10.1016/j.biosystemseng.2012.12.010
Bodig, J., and Jayne, B. A. (1993). Mechanics of Wood and Wood Composites, Van Nostrand Reinhold Company, New York, NY.
Cave, I.D., and Walker, J.C.F. (1994). “Stiffness of wood in fast-grown plantation softwoods: the influence of microfibril angle,” Forest Prod. J. 44(5), 43-48.
Clark, A., and Saucier, J. R. (1989). “Influence of initial planting density, geographic location, and species on juvenile wood formation in southern pine,” Forest Prod. J. 39(7-8), 42-48.
Conners, T. E., and Medvecz, P. J. (1992). “Wood as a bimodular material,” Wood Fiber Sci. 24(4), 413-423.
Dieste, A. (2014). Possible Destinations for Wood Products Manufactured in Uruguay, (Report 4), Forestry-Wood Sectorial Council, DNI, Uruguay.
EN 338 (2016). “Structural timber. Strength classes,” CEN/TC 124, Brussels, Belgium.
EN 408 (2011). “Timber structures. Structural timber and glued laminated timber. Determination of some physical and mechanical properties,” CEN/TC 124, Brussels, Belgium.
EN 1995 (2014). “Eurocode 5: Design of timber structures – Part 1-1: General – Common rules and rules for buildings,” CEN/TC 250, Brussels, Belgium.
Gao, Z., Zhang, X., Wang, Y., Yang, R., Wang, G., and Wang, Z. (2016). “Measurement of the Poisson’s ratio of materials based on the bending mode of the cantilever plate,” BioResources 11(3), 5703-5721.
Garab, J., Keunecke, D., Hering, S., Szalai, J., and Niemz, P. (2010). “Measurement of standard and off-axis elastic moduli and Poisson’s ratios of spruce and yew wood in the transverse plane,” Wood Sci. Technol. 44(3), 451-464. DOI: 10.1007/s00226-010-0362-2
He, M., Lam, F., and Foschi, R. O. (2001). “Modeling three-dimensional timber light-frame buildings,” J. Struct. Eng.-ASCE 127(8), 901-913. DOI: 10.1061/(ASCE)0733-9445(2001)127:8(901)
Iraola-Sáenz, B. (2016). Simulación del Comportamiento Mecánico de la Madera en Uniones Estructurales y su Aplicación Mediante Modelos Tridimensionales de Elementos Finitos[Simulation of the Mechanical Behavior of Wood in Structural Joints and its Application by Three-dimensional Finite Element Models], Ph.D. Dissertation, Universidad de Navarra, Pamplona, Spain.
Kennedy, R. W. (1995). “Coniferous wood quality in the future: concerns and strategies,” Wood Sci. Technol. 29(5), 321-338. DOI: 10.1007/BF00202581
Keunecke, D., Hering, S., and Niemz, P. (2008). “Three-dimensional elastic behavior of common yew and Norway spruce,” Wood Sci. Technol. 42(8), 633-647. DOI: 10.1007/s00226-008-0192-7
Kretschmann, D. E. and Bendtsen, B. A. (1992). “Ultimate tensile stress and modulus of elasticity of fast-grown plantation loblolly pine lumber,” Wood Fiber Sci. 24(2), 189-203.
Kretschmann, D. E. (1997). “Effect of juvenile wood on shear parallel and compression perpendicular to grain strength for loblolly pine,” in: Proc. CTIA/IUFRO Inter. Wood Quality Workshop, Timber Management toward Wood Quality and End Product Value, Quebec City, pp. 23-30.
Kretschmann, D. E. (2008). “The influence of juvenile wood content on shear parallel, compression, and tension perpendicular to grain strength and mode I fracture toughness of loblolly pine,” Forest Prod. J. 58(7-8), 89-96.
Moya, L., Cardoso, A., Cagno M., and O’Neill, H. (2015). “Caracterización estructural de madera aserrada de pinos cultivados en Uruguay,” Maderas. Ciencia y Tecnología 17(3), 597-612. DOI: 10.4067/S0718-221X2015005000053
Moya, L., Laguarda, F., Cardoso, A., Cagno, M., Gatto, F., and O’Neill, H. (2009). Caracterización Estructural de Madera Aserrada de Pinos (Pinus elliottii y P. taeda) Asociada a Grados Estructurales (Grant No. PR-FMV-2009-1-2772), Agencia Nacional de Investigación e Innovación, Montevideo, Uruguay.
Moya, L., Laguarda, M. F., Cagno, M., Cardoso, A., Gatto, F., and O’Neill, H. (2013). “Physical and mechanical properties of loblolly and slash pine wood from Uruguayan plantations,” Forest Prod. J. 63(3-4), 128-137. DOI: 10.13073/FPJ-D-13-00024
Nadir, Y., Nagarajan, P., and Midhun, A. J. (2014). “Measuring elastic constants of Hevea brasiliensis using compression and Iosipescu shear test,” European Journal of Wood and Wood Products 72(6), 749-758. DOI: 10.1007/s00107-014-0842-4
O’Neill, H., Tarigo, F., and Trambauer, C. (2002). Propiedades Mecánicas de Pinus elliottii Eng. del Litoral de Uruguay. Informe No 1. Grupo Técnico de Madera Aserrada de Pino GT3, Laboratorio Tecnológico del Uruguay, Montevideo, Uruguay.
O’Neill, H., Tarigo, F., and Trambauer, C. (2003). Propiedades Mecànicas de Pinus taeda L. del Litoral de Uruguay. Informe No 2. Grupo Técnico de Madera Aserrada de Pino GT3, Laboratorio Tecnológico del Uruguay, Montevideo, Uruguay.
Pérez Zerpa, J. M., Castrillo, P., and Baño, V. (2017). “Development of a method for the identification of elastoplastic properties of timber and its application to the mechanical characterization of Pinus taeda,” Constr. Build. Mater. 139, 308-319. DOI: 10.1016/j.conbuildmat.2017.02.058
Sliker, A. (1985). “Orthotropic strains in compression parallel to grain tests,” Forest Prod. J. 35(11-12), 19-26.
UNE 56535 (1977). “Características físico-mecánicas de la madera. Determinación de la resistencia a la compresión axial,” AENOR, Madrid, Spain.
UNE 56542 (1988). “Características físico-mecánicas de la madera. Determinación de la resistencia a la compresión perpendicular a las fibras,” AENOR, Madrid, Spain.
Uruguay XXI (2015). “Forestry industry,” (http://www.uruguayxxi.gub.uy/informacion/wp-content/uploads/sites/9/2016/01/Forestry-Industry-November-2015-Uruguay-XXI.pdf), Accessed 20 July 2016.
USDA (2010). Wood Handbook: Wood as an Engineering Material (General Technical Report FPL-GTR-190), U.S. Department of Agriculture, Forest Products Laboratory, Madison, WI.
Vázquez, C., Gonçalves, R., Bertoldo, C., Baño, V., Vega, A., Crespo, J., and Guaita, M. (2015). “Determination of the mechanical properties of Castanea sativa Mill. using ultrasonic wave propagation and comparison with static compression and bending methods,” Wood Sci. Technol. 49(3), 607-622. DOI: 10.1007/s00226-015-0719-7
Zhang, W., and Sliker, A. (1991). “Measuring shear moduli in wood with small tension and compression samples,” Wood Fiber Sci. 23(1), 58-68.
Article submitted: March 31, 2017; Peer review completed: June 1, 2017; Revised version received and accepted: June 22, 2107; Published: July 5, 2017.
DOI: 10.15376/biores.12.3.5896-5912