
Abstract
This paper analyzes and evaluates the European Union (EU) utilization of renewable resources in energy production and consumption. Biomass and renewable waste, with a share of 64.2% of primary renewable energy production, is the most important energy source in the EU. However, utilization of renewables in energy production and consumption differs across EU countries and is significantly influenced by various factors, including environmental, social, and economic characteristics. Cluster analysis was used to reveal these differences based on the identification and quantification of a set of factors reflecting the availability of renewable resources, utilization of renewable resources, and relevant socio-economic indicators. The results indicate that there are nine main identifiable clusters, considering the high variability of selected variables. The analysis confirmed that the economically developed EU countries with significant renewable resources have above-average primary energy production from renewable resources and biomass in particular. On the other hand, small EU countries are aggregated in numerous clusters characterized by under-average values in terms of availability and utilization of renewable resources such as wood production or energy consumption but with a relatively high share of renewable energy in gross final energy consumption.
Download PDF
Full Article
Energy Utilization of Renewable Resources in the European Union ― Cluster Analysis Approach
Ján Parobek,a,* Hubert Paluš,a Martina Kalamárová,a Erika Loučanová,a Mikuláš Šupín,a Anna Križanová,b and Katarína Repková Štofková b
This paper analyzes and evaluates the European Union (EU) utilization of renewable resources in energy production and consumption. Biomass and renewable waste, with a share of 64.2% of primary renewable energy production, is the most important energy source in the EU. However, utilization of renewables in energy production and consumption differs across EU countries and is significantly influenced by various factors, including environmental, social, and economic characteristics. Cluster analysis was used to reveal these differences based on the identification and quantification of a set of factors reflecting the availability of renewable resources, utilization of renewable resources, and relevant socio-economic indicators. The results indicate that there are nine main identifiable clusters, considering the high variability of selected variables. The analysis confirmed that the economically developed EU countries with significant renewable resources have above-average primary energy production from renewable resources and biomass in particular. On the other hand, small EU countries are aggregated in numerous clusters characterized by under-average values in terms of availability and utilization of renewable resources such as wood production or energy consumption but with a relatively high share of renewable energy in gross final energy consumption.
Keywords: Renewable resources; Biomass; Primary energy production; Consumption
Contact information: a: Department of Marketing, Trade and World Forestry, Technical University in Zvolen, Faculty of Wood Sciences and Technology, T. G. Masaryka 24, 960 53 Zvolen, Slovakia; b: Faculty of Operation and Economics of Transport and Communications, University of Žilina, Univerzitná 8215/1, 010 26 Žilina, Slovakia; *Corresponding author: parobek@tuzvo.sk
INTRODUCTION
Forests cover 38% of the European Union’s (EU) land area. Currently, there are 159 million hectares of forest in the EU, which represent 4% of the world’s forests (EUROPARL 2015). In many European countries, wood is being promoted as a renewable energy source in energy policies, resulting in significantly growing volumes of national and international markets for biomass (FAO 2014b). The primary production of renewable energies has been increasing in the long term; between 1990 and 2013, it increased by 170%. The primary production of renewable energy within the EU in 2013 was 192 million tonnes of oil equivalents (toe), which accounted for a share of 24.3% of total primary energy production from all sources. The most important source in the EU was biomass and renewable waste, accounting for 64.2% of primary renewable energy production in 2013 (EUROSTAT 2015a; 2015b). The EU Renewable Energy strategy sets a target of 20% renewable energy by 2020, with biomass foreseen as 42% of this target. Therefore, the forest sector, as an important biomass supplier, must continually strive to improve or at least maintain its market performance (Oblak and Glavonjić 2014).
The dependency of the EU on energy imports, particularly on oil and more recently on natural gas, forms the backdrop for policy concerns related to the security of energy supplies (Šupín 2013). The energy considerations of many EU countries are reflected by the emerging economic clout of renewable energies. According to Observ’ER (2013), renewable resource utilization is showing a positive trend, as renewable energies covered 14% of the gross final energy consumption in 2012. This significant progress puts the EU only 6% away from its target for 2020. The EU renewable energy share has already increased since 2006 from 9% to 14%. However, it must be remembered that the investment has naturally dropped since 2012. It follows that the level of progress by renewable energies is bound to slow down in the years to come. In 2012, the strongest increases in the renewable energy share in final energy consumption were recorded in Northern Europe, in particular Sweden (52.4%), Denmark (26.3%), and Estonia (27.8%), mostly because of a substantial growth in solid biomass consumption. The renewable energy share has also increased sharply in a number of Central European countries, such as Bulgaria (17.9%) and the Czech Republic (11.3%), primarily thanks to their investments in the renewable electricity sectors. In some West European countries, the renewable energy share also increased notably, mostly as a result of the implementation of bio-fuel certification (e.g., in France, 13.7%). In the EU, the current momentum driving the renewable energy share of gross final energy consumption is varied and depends on many factors. Therefore, the situation is different among the EU countries because of social, economic, and political variability, as well as differences in approach to using renewable energy sources. These issues will influence policy makers’ focus on preparing future energy policy for the EU. A major future energy policy will be focused on preparing the Energy Package for 2030. The future policy shall be based on the relevant background in the EU context, and at the same time it has to consider differences among the countries. Based on the abovementioned variability of a wide range of economic, social, and environmental factors, the main aim of this paper is to analyze and evaluate EU regional differences in utilization of renewable resources in energy production and consumption applying cluster analysis approach.
Cluster analysis is a term used to describe a family of statistical procedures specifically designed to discover classifications within complex data sets (Gore 2000). An outcome of cluster analysis will result in a number of clusters, where the observations within a cluster are as similar as possible while the differences between the clusters are as large as possible (Templ et al. 2008).
Clustering is a family of methods undergoing rapid development. Blashfield and Aldenderfer mentioned in their report from 1978 that in 1964 they found 25 papers containing references to the basic texts on clustering and the number has been growing ever since (Legendre and Legendre 2012). Clustering has been part of natural science for a long time; it has been used by numerical taxonomists and ecologists, and later joined by other researchers in the physical sciences, economics, and humanities. Most modern clustering methods have only been developed since the era of second-generation computers. The first programmed method was developed by Sokal and Michener in 1958 for biological purposes (Legendre and Legendre 2012). Clustering methods are useful whenever the researcher is interested in grouping together objects based on multivariate similarity. Cluster analysis can be employed as a data exploration tool as well as a hypothesis testing and confirmation tool. The most frequent use of cluster analysis is in the development of a typology or classification system (Gore 2000).
Hierarchical cluster analysis as a multivariate statistical tool has also been widely used to formulate geochemical models on the basis of available data (Meng and Maynard 2001). Furthermore, there are methods that try to group the data by simultaneously clustering objects and variables (Ji et al. 1995, 2007; Friedman and Meulman 2004; Raftery and Dean 2006; Templ et al. 2008). A number of studies used this technique to successfully classify water samples (Alther 1979; Williams 1982; Farnham et al. 2000; Alberto et al. 2001; Meng and Maynard 2001; Belkhiri et al. 2010). In connection with environmental management, the cluster analysis was used, for example, to assess the surface water (Hussain et al. 2008) or to determine spatial changes in water quality (Magyar et al. 2013). It is also widely used in hydrology to examine water types to assess ground water or river and water systems (McNeil et al. 2005; Panda et al. 2006; Menció and Mas-Pla 2008). In energy policy, the use of cluster analysis techniques, for example, serves to model renewable energy systems or to estimate the effects of changes in price and income on world oil demand (Gómez-Muñoz and Porta-Gándara 2002; Dargay and Gately 2010).
There are at least two different approaches to cluster analysis applied in the forest industry. The first point of view is focused on the forest-based industries as a cluster. This kind of analysis describes different sectors within and out of the forest sector. Viitamo and Bilas (2002) applied this approach to study the enlargement and, in particular, the competitiveness of forest-based industries in EU candidate countries. The main contribution of this study is its holistic approach to discern various forms of industrial competitiveness in selected candidate countries. On the other hand, Michinaka et al. (2011) considered cluster analysis as a statistical method in the forestry sector. They aggregated 180 countries contained within the Global Forest Products Model, using cross-sectional data for per capita gross domestic product, forest coverage, and per capita consumption of forest products. They then applied cluster analysis to estimate the elasticities of demand and tried to solve the problem of data availability in estimating elasticities by grouping countries based on variables identified on the basis of economic theory. Their results were validated by a one-way analysis of means and multiple comparisons. The countries for panel analysis were selected based on time series data availability and quality. In their study, long-run static models, short-run dynamic models, and long-run dynamic models of demand were estimated using panel data analysis for countries in each cluster using data from 1992 to 2007 and 9 to 44 countries in each cluster. They found that long-run dynamic elasticities are higher than short-run dynamic estimations, and dynamic model estimations outperform static model estimations, as shown in Root Mean-Square Error (RMSE) statistics. The statistical clustering methodology and its dynamic applications remedies the traditional ways of analyzing competitiveness, as measured unidimensionally or using various indicators separately.
EXPERIMENTAL
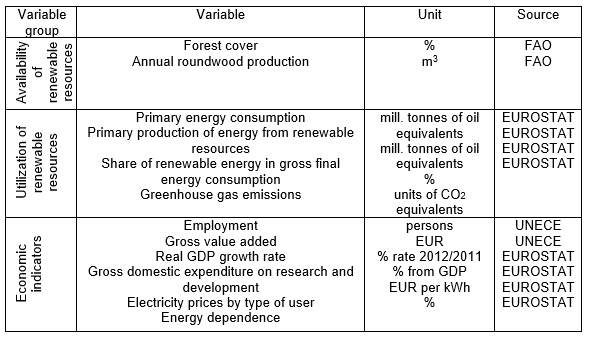
The cluster analysis depends on the purpose of use, which affects the applied variables. In the present case, secondary economic, energetics, and wood resources data from EUROSTAT (2014), FAO (2014a), and UNECE (2015) databases have been applied. Based on the three elementary approaches to identifying appropriate clustering variables i.e., inductive, deductive, and cognitive, we applied inductive methodology (Ketchen et al. 1993). The objects of the analysis were represented by 27 EU countries in 2012. For these countries, we analyzed 12 different variables (Table 1).
The results were calculated using the computer program “STATISTICA 12” (StatSoft 2013). Based on the nature of variables, all selected variables were grouped into three main areas – (i) availability of renewable resources, (ii) utilization of renewable resources, and (iii) economic indicators. Half of the identified variables represented economic indicators, while the other half were linked to the availability and utilization of renewable resources. The variables were defined according to the EUROSTAT, FAO, and UNECE glossaries.
As the variables were reported in different units, to determine distances between the EU countries, it was necessary to standardize them and eliminate dependence. A significant dependence may reduce the total number of variables. The basic methodology for the detection of similarity between two quantitative variables is the Pearson correlation coefficient, which measures the strength of a linear relationship between paired data (Pearson 1895). In cases where the coefficient ranges from 0.8 to 1 for positive correlation and from -0.8 to -1 for negative correlation, a high dependency is indicated, and one of the variables must be eliminated. The adjusted input data can be used for cluster analysis. This analysis belongs to a group of multivariate exploratory (examiners) statistical methods and is divided into non-hierarchical and hierarchical methods. For our purpose, according to pretest results, we used a hierarchical, agglomerative approach in order to identify homogenous groups of objects called clusters (in our case groups of countries). Countries grouped in a specific cluster share many characteristics, but are very dissimilar to countries not belonging to that cluster.
At the beginning of the analysis, each country represents a separate cluster. Each cluster is gradually combined in pairs until the result is a single cluster. For the examination of the similarity of objects, the degree of similarity (or dissimilarity) was employed.
Table 1. List of Variables Used for the Analysis
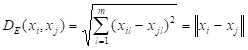
The most commonly used measure of distance, called the Euclidean distance (DE), was calculated using the Eq. 1. The Ward’s method was applied in hierarchical cluster analysis. Ward’s minimum variance method suggested a general agglomerative hierarchical clustering procedure, where the criterion for choosing the pair of clusters to merge at each step is based on the optimal value of the error sum of squares (Székely and Rizzo 2005),
 (1)
(1)
where xi and xj are variables corresponding to the countries “i” and “j”, and m is the number of variables
Firstly, the analysis creates a pair of most similar objects – the first clusters. The next steps clusters are formed on the basis of distances between clusters. This phase is essential to choose one of the agglomerative clustering algorithms. The output process of clustering distances of objects represents a different number of clusters at different levels of aggregation, which can be graphically displayed in a tree structure (as a dendrogram). Selecting the right level for the number of resulting clusters was important for the interpretation of the entire analysis and its further application. The significant increase of the Euclidean distances values was used as the standard for reading the final number of clusters and the interpretation of results across the cluster analysis. For relevant interpretation of results it was necessary to calculate averages value of clusters and aggregation of variables.
RESULTS AND DISCUSSION
Following the abovementioned methodology, the first step was the selection of appropriate variables and the elimination of some correlated dependent variables. The available data for all variables for the year 2012 were standardized by correlation analysis. The original analysis involved many variables focused on availability of resources that had to be consequently eliminated. For instance, a significant relationship between the annual roundwood production and consumption was indicated. The dependency between these variables was very high (r = 0.99) so that the annual roundwood consumption had to be left out from the set of originally applied variables. Finally, the analysis enabled the grouping of 27 EU countries into clusters using 12 different variables.
Applying Ward’s method for coupling and calculating of Euclidean distances among monitored objects, the clusters of countries were identified. Different numbers of clusters at different levels of aggregation represent the outputs of the process of objects’ distances aggregation (Fig. 1).
Selecting the right level to determine the number of resulting clusters is important for the interpretation of the entire analysis and its further application. There was a significant increase in the values of Euclidean distances in step five, at a linkage distance of 2.5 x 10⁹. Therefore, this level was used as the standard for reading the final number of clusters and the interpretation of results across the cluster analysis. There were nine clusters created, representing the nine groups of EU-27 countries. The results are presented by two clusters of six members, one of four members, one of three members, three of two members, and two one-member clusters (Table 2).
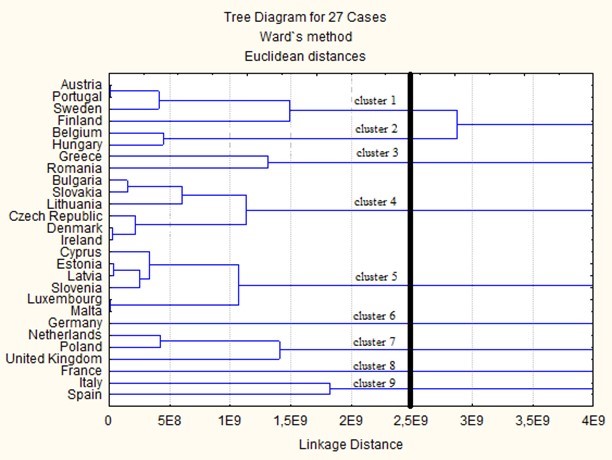
Fig. 1. Identified clusters for 27 EU countries (2012)
* E – exponent
Table 2. Sorting Countries into Clusters
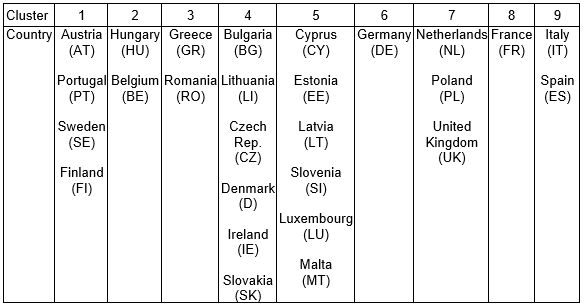
Cluster 1 includes leaders (AT, PT, SE, FI) in the use of renewable energy and the average production of primary energy from biomass. This cluster, based on the clustering averages, has the highest forest cover of all clusters and a relatively high roundwood production. This cluster has also the absolute leadership in the share of renewable energy in the gross final energy consumption, exceeding two times the EU average. However, the cluster is significantly below the EU average in terms of employment rate and energy dependence. On the other hand, this cluster allocated nearly the largest percentage of GDP (2.82% at average) as the expenditure on research and development (Table 3).
Table 3. Balanced Values of Individual Clusters
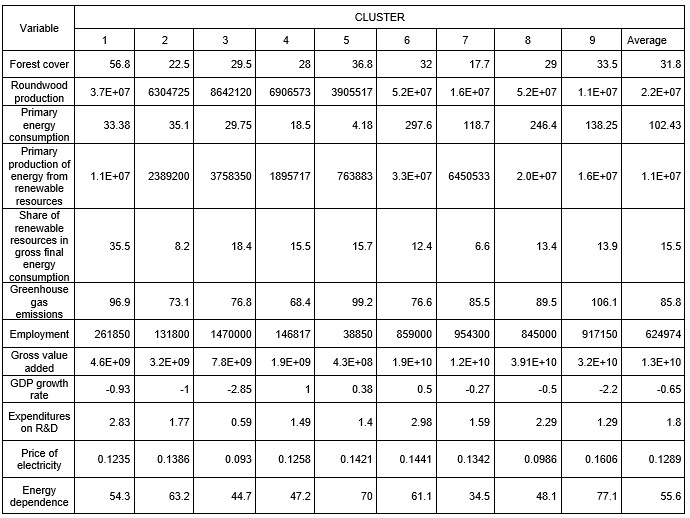
Cluster 2 is represented by countries (HU, BE) significantly below the average in the use of renewable energy and in the production of primary energy from biomass. Hungary and Belgium do not significantly excel in any of the examined areas. The only exception is the high energy dependence and the low forest cover, which is remarkable, relative to the lower than average values of the variables and relatively high expenditures on research and development (1.77%), representing approximately the EU average.
Countries (GR, RO) grouped in Cluster 3 performed slightly above the average in the use of renewable energy and below average in the production of primary energy from biomass. This confirms that Romania and Greece have significant production of solar energy, wind energy, and hydropower. This cluster is characterized by above-average use of renewable energy sources, thus following the first cluster leaders in this field. In contrast, the production of primary energy from biomass, compared with Belgium and Hungary (Cluster 2), is almost 38% higher (mostly because of Romania). This cluster is also characterized by the cheapest price of energy and the lowest GDP growth, which constitutes the most negative value of the analyzed clustering averages (-2.85). Similarly, the expenditures on research and development also show a very low level, i.e., 0.59%.
Cluster 4 records an average share in the use of renewable energy sources and significantly below average primary energy production from biomass. The cluster is represented by the countries Bulgaria, Lithuania, Czech Republic, Denmark, and Ireland. This cluster has the lowest level of greenhouse gases at a relatively high GDP growth from the perspective of cluster averages primarily because of development in Lithuania. The countries in this cluster have slightly below-average values of indicators such as forest cover at a relatively low annual volume of wood production.
The relative variables (share of renewable resources, energy dependence, etc.) are usually above-average in clusters containing small European countries with sufficient renewable resources (clusters 3, 4 and 5). These multiple clusters usually contain more small countries with low absolute values of variables.
Cluster 5 is one of the most numerous clusters in terms of number of countries involved and shows an above-average share in the use of renewable energy; however, the countries produce the smallest amount of primary energy from renewable resources. This cluster is characterized by the lowest production of wood from the perspective of the cluster average. Therefore, other values in the cluster that are also influenced by the size of countries showed the lowest values of such economic indicators such as employment rate, gross value added, and energy dependence.
Cluster 6 (DE), similarly to cluster 8 (FR), is represented only by one country. These clusters are very similar in terms of values of several indicators. Germany is a leader in the production of primary energy from biomass and below average in use of renewable energy. Furthermore, this country is one of the largest consumers of wood. Germany and France (cluster 8) are the leaders in wood production with high energy dependence, average forest cover, and a relatively low level of greenhouse gas emissions compared to other cluster averages. These two clusters, or countries, occupy the first two positions in the rank of cluster averages for the primary energy production from biomass, where France takes the second place with almost 37% lower primary energy production from biomass compared to Germany. A similar phenomenon is visible when expenditure on research and development is considered. The most important players, i.e., Germany (cluster 6), France (cluster 8), and the Nordic countries (cluster 1), created independent clusters with a positive situation of absolute variables. These results correspond with the EUROSTAT (2015b) data, where the highest primary production of energy from renewable resources reached 33.7 million toe in Germany with a share of biomass of approximately 71%. France has a primary production of energy from renewable resources of 23 million toe. However, in addition to the production of biomass (65%), there is also another important renewable resource: hydropower (26%).
The three countries in cluster 7 (NL, PL, UK) are characterized by lower primary energy production from renewable resources and the lowest share of use of renewable resources. This cluster has the lowest cluster average of forest cover, as well as the lowest energy dependence compared to other clusters.
Cluster 9 (IT, ES) is characterized by a below-average use of renewable energy and above-average primary energy production from renewable resources. In terms of monitoring these two characteristics, these countries show the most balanced values, whereas the use of renewable resource energy is slightly below average. According to EUROSTAT (2013) data, Italy had 23.5 mil toe primary production of renewable energy, mostly from biomass (45%). This cluster has a below-average relative share of renewable energy in gross final energy consumption. However, in view of the remaining characteristics, this cluster is the largest producer of greenhouse gases and has a high cost of energy and energy dependence. On the other hand, countries in this cluster have negative GDP change and low expenditures on research and development.
CONCLUSIONS
- This study covered the relative and absolute variables of macroeconomic data and data focused on renewable resources availability and utilization. Their variability among the European Union countries is very high, and macroeconomic data strongly affect the formation of clusters. Therefore, a relatively high Euclidean distance (2.5 x 10⁹) was identified to determine the nine main clusters. This finding is in favor of the statement that implementation of common EU renewable resources policy shall take into account the differences and specific conditions in respective EU countries.
- The analysis confirmed the most important clusters contain Germany and France, as well as Nordic countries and South European countries (Italy and Spain). These countries are the most important producers of primary energy from renewable resources in Europe and create independent clusters with a positive situation. Germany represents an individual cluster with the highest balanced values, followed by France. In terms of economic development, availability of renewable resources, and the use of renewable resources, these countries show above-average values in absolute variables. The analysis confirmed that economically developed countries with significant renewable resources (biomass) have above-average primary energy production from renewable resources.
- Highly industrialized Western European countries like the Netherlands, Belgium, and the United Kingdom were aggregated in below-standard clusters in terms of production of primary energy from renewable resources. This reflects the fact that these countries have low biomass production and the lowest shares of renewable energy use.
- Small EU countries created numerous clusters. Considering their scale, these countries have sufficient renewable sources. In general, these clusters have absolute balanced values under average in terms of availability and utilization of renewable resources such as wood production or energy consumption; on the other hand, they show a relatively high share of renewable energy in gross final energy consumption.
ACKNOWLEDGMENTS
The authors are grateful for the support of the Scientific Grant Agency of the Ministry of Education, Science, Research, and Sport of the Slovak Republic, and the Slovak Academy of Sciences, Grant No. 1/0387/13, “A comprehensive model of wood chain comparative advantages,” Grant No. 1/0385/13, “Modeling substitution changes in timber market under the increasing demand for renewable energy sources” and the Slovak Research and Development Agency, Grant APVV-14-0869 “Research of the utilization of wood as renewable raw material in the context of green economy.”
REFERENCES CITED
Alberto, W. D., Del Pilar, D. M., Valeria, A. M., Fabiana, P. S., Cecilia, H. A., and De Los Angeles, B. M. (2001). “Pattern recognition techniques for the evaluation of spatial and temporal variations in water quality. A case study: Suquıa River Basin (Cordoba-Argentina),” Water Research 35(12), 2881-2894. DOI: 10.1016/S0043-1354(00)00592-3
Alther, G. A. (1979). “A simplified statistical sequence applied to routine water quality analysis: A case history,” Ground Water 17(6), 556-561. DOI: 10.1111/j.1745-6584.1979.tb03356.x
Belkhiri, L., Boudoukha, A., Mouni, L. and Baouz, T. (2010). “Application of multivariate statistical methods and inverse geochemical modeling for characterization of groundwater — A case study: Ain Azel plain (Algeria),” Geoderma 159(3-4), 390-398. DOI: 10.1016/j.geoderma.2010.08.016
Dargay, J. M., and Gately, D. (2010). “World oil demand’s shift toward faster growing and less price‐responsive products and regions,” Energy Policy 38(10), 6261‐6277. DOI: 10.1016/j.enpol.2010.06.014
EUROPARL (2015). “Fact sheets on the European Union,” retrieved from http://www.europarl.europa.eu/atyourservice/en/displayFtu.html?ftuId=FTU_5.2.11.html (accessed on July 17, 2015).
EUROSTAT (2014). “Database–EUROSTAT,” retrieved from http://ec.europa.eu/eurostat/data/database (accessed on July 17, 2015).
EUROSTAT (2015a). “Energy from renewable sources,” retrieved from: http://ec.europa.eu/eurostat/statistics-explained/index.php/ Energy_from_renewable_sources (accessed on July 17, 2015).
EUROSTAT (2015b). “Primary production of renewable energy, 2003 and 2013,” retrieved from: http://ec.europa.eu/eurostat/statistics-explained/index.php?title=File:Primary_production_of_renewable_energy,_2003_and_2013_YB15.png&oldid=238270 (accessed on July 17, 2015).
FAO (2014a). “FAOSTAT – Forestry,” retrieved from http://faostat.fao.org (accessed on July 17, 2015).
FAO (2014b). “State of the world’s forests,” retrieved from: http://www.fao.org/3/a-i3710e.pdf (accessed on July 17, 2015).
Farnham, M., Stetzenbach, K. J., Singh, A. K. and Johannesson, K. H. (2000). “Deciphering groundwater flow systems in Oasis Valley, Nevada, using trace element chemistry, multivariate statistics, and geographical information system,” Mathematical Geology 32(8), 943-968. DOI: 10.1023/A:1007522519268
Friedman, J. H., and Meulman, J. (2004). “Clustering objects on subsets of attributes (with discussion),” Journal of the Royal Statistical Society 66(4), 815-849. DOI: 10.1111/j.1467-9868.2004.02059.x
Gómez-Muñoz, V. M., and Porta-Gándara, M. A. (2002). “Local wind patterns for modeling renewable energy systems by means of cluster analysis techniques,” Renewable Energy 25(2), 171-182. DOI: 10.1016/S0960-1481(01)00013-1
Gore Jr., P. A. (2000). “Cluster analysis,” in: Handbook of Applied Multivariate Statistics and Mathematical Modeling, H. E. A. Tinsley and S. D. Brown (eds.), Academic Press, San Diego, CA, pp. 297-321. DOI: 10.1016/B978-012691360-6/50012-4
Hussain, M., Munaf Ahmed, S. and Abderrahman, W. (2008). “Cluster analysis and quality assessment of logged water at an irrigation project, eastern Saudi Arabia,” Journal of Environmental Management 86(1), 297-307. DOI: 10.1016/j.jenvman.2006.12.007
Ji, H., Zhu, Y., and Wu, X. (1995). “Correspondence cluster analysis and its application in exploration geochemistry,” Journal of Geochemical Exploration 55(1-3), 137-144. DOI: 0.1016/0375-6742(95)00025-9
Ji, H., Zhu, Y., and Wu, X. (2007). “Semi-hierarchical correspondence cluster analysis and regional geochemical pattern recognition,” Journal of Geochemical Exploration 93(2), 109-119, DOI: 10.1016/j.gexplo.2006.10.002
Ketchen, D. J., Thomas, J. B., and Snow, C. C. (1993). “Organizational configurations and performance: A comparison of theoretical approaches,” Academy of Management Journal 36(6), 1278- 1313. DOI: 10.2307/256812
Legendre, P., and Legendre, L. (2012). “Numerical ecology,” Developments in Environmental Modelling 24, 1-990.
Magyar, N., Hatvani, I. G., Kovácsné Székely, I., Herzig, A., Dinka, M. and Kovács, J. (2013). “Application of multivariate statistical methods in determining spatial changes in water quality in the Austrian part of Neusiedler See,” Ecological Engineering 55, 82-92. DOI: 10.1016/j.ecoleng.2013.02.005
McNeil, V. H., Cox, M. E., and Preda, M. (2005). “Assessment of chemical water types and their spatial variation using multi-stage cluster analysis, Queensland, Australia,” Journal of Hydrology 310(1-4), 181-200. DOI: 10.1016/j.jhydrol.2004.12.014
Menció, A., and Mas-Pla, J. (2008). “Assessment by multivariate analysis of groundwater–surface water interactions in urbanized Mediterranean streams,” Journal of Hydrology 352(3-4), 355-366. DOI: 10.1016/j.jhydrol.2008.01.014
Meng, S. X., and Maynard, J. B. (2001). “Use of multivariate analysis to formulate conceptual models of geochemical behavior: Water chemical data from the Botucata Aquifer in Sao Paulo state, Brazil,” Journal of Hydrology 250(1-4), 78-97. DOI: 10.1016/S0022-1694(01)00423-1
Michinaka, T., Tachibana, S., and Turner, J. A. (2011). “Estimating price and income elasticities of demand for forest products: Cluster analysis used as a tool in grouping,” Forest Policy and Economics 13(6), 435-445. DOI: 10.1016/j.forpol.2011.05.011
Oblak, L., and Glavonjić, B. (2014). “A model for the evaluation of radio advertisements for the sale of timber products,” Drvna Industrija 65(4), 303-308. DOI: 10.5552/drind.2014.1357
Observ’ER (2013). “The state of renewable energies in Europe,” retrieved from: http://www.energies-renouvelables.org/observ-er/stat_baro/barobilan/barobilan13-gb.pdf (accessed on July 17, 2015).
Panda, U. Ch., Sundaray, S. K., Rath, P., Nayak, B. B. and Bhatta, D. (2006). “Application of factor and cluster analysis for characterization of river and estuarine water systems – A case study: Mahanadi River (India),” Journal of Hydrology 331(3-4), 434-445. DOI: 10.1016/j.jhydrol.2006.05.029
Pearson, K. (1895). “Notes on regression and inheritance in the case of two parents,” Proceedings of the Royal Society of London 58(1895), 240-242.
Raftery, A. E., and Dean, N. (2006). “Variable selection for model-based clustering,” Journal of the American Statistical Association 101(473), 168-178. DOI: 10.1198/016214506000000113
StatSoft (2013). STATISTICA 12. StatSoft Czech Republic s.r.o.
Székely, G. J., and Rizzo, M. L. (2005). “Hierarchical clustering via joint between-within distances: Extending Ward’s minimum variance method,” Journal of Classification 22(2), 151-183. DOI: 10.1007/s00357-005-0012-9
Šupín, M. (2013). “Slovak and EU market with wood pellets,” Intercathedra 29(2), 74-81.
Templ, M., Filzmoser, P., and Reimann, C. (2008). “Cluster analysis applied to regional geochemical data: Problems and possibilities,” Applied Geochemistry 23(8), 2198-2213. DOI: 10.1016/j.apgeochem.2008.03.004
UNECE (2015). “UNECE Statistics,” retrieved from http://www.unece.org/ stats/stats_h.html (accessed on July 17, 2015).
Viitamo, E., and Bilas, O. (2002). “Competitiveness of the forest sector in the EU candidate countries – Cluster analysis,” IIASA Interim Report 1.
Williams, R. E. (1982). “Statistical identification of hydraulic connections between the surface of a mountain and internal mineralized sources,” Ground Water 20(4), 466-478. DOI: 10.1111/j.1745-6584.1982.tb02767.x
Article submitted: September 2, 2015; Peer review completed: October 16, 2015; Revised version received and accepted: November 24, 2015; Published: December 3, 2015.
DOI: 10.15376/biores.11.1.984-995