
Abstract
Deep drawing of paperboard with rigid tools and immediate compression has only a small presence in the market for secondary packaging solutions due to a lack of understanding of the physical relations that occur during the forming process. As with other processes that deal with interactions between two solids in contact, the control of the factors that affect friction is important due to friction’s impact on runnability and process reliability. A new friction measurement device was developed to evaluate the factors influencing the friction behavior of paperboard such as under the specific conditions of the deep drawing process, which differ from the standard friction testing methods. The tribocharging of the contacting surfaces, generated during sliding friction, was determined to be a major influence on the dynamic coefficient of friction between paperboard and metal. The same effect could be examined during the deep drawing process. With increased contact temperature due to the heating of the tools, the coefficient of friction decreased significantly, but it remained constant after reaching a certain charging state after several repetitions. Consequently, to avoid ruptures of the wall during the forming process, tools that are in contact with the paperboard should be heated.
Download PDF
Full Article
Evaluating the Factors Influencing the Friction Behavior of Paperboard during the Deep Drawing Process
Alexander Lenske,a,* Tobias Müller,a Lars Penter,b Matti Schneider,c Marek Hauptmann,a and Jens-Peter Majschak a
Deep drawing of paperboard with rigid tools and immediate compression has only a small presence in the market for secondary packaging solutions due to a lack of understanding of the physical relations that occur during the forming process. As with other processes that deal with interactions between two solids in contact, the control of the factors that affect friction is important due to friction’s impact on runnability and process reliability. A new friction measurement device was developed to evaluate the factors influencing the friction behavior of paperboard such as under the specific conditions of the deep drawing process, which differ from the standard friction testing methods. The tribocharging of the contacting surfaces, generated during sliding friction, was determined to be a major influence on the dynamic coefficient of friction between paperboard and metal. The same effect could be examined during the deep drawing process. With increased contact temperature due to the heating of the tools, the coefficient of friction decreased significantly, but it remained constant after reaching a certain charging state after several repetitions. Consequently, to avoid ruptures of the wall during the forming process, tools that are in contact with the paperboard should be heated.
Keywords: Friction behavior; Friction measurement; Paperboard; Tribocharging; Contact electrification; Triboelectrification; Deep drawing process; 3D-forming
Contact information: a: Department of Processing Machines and Processing Technology, Technische Universität Dresden, Bergstrasse 120, 01069 Dresden, Germany; b: Institut of Machine Tools Development and Adaptive Controls, Technische Universität Dresden, Helmholtzstrasse 7a, 01069 Dresden, Germany; c: Fraunhofer Institute for Industrial Mathematics ITWM, Fraunhofer-Platz 1, 67663 Kaiserslautern, Germany; *Corresponding author: alexander.lenske@tu-dresden.de
INTRODUCTION
The process of deep drawing paperboard with rigid tools and immediate compression has been around since the 19th century (Carl and Son 1894; Gossweiler 1908). In this process, the paperboard is drawn by a punch into a cavity with the required bottom-shape, and a blank-holder is positioned a few tenths of a millimeter above the paperboard for a better distribution of the characteristic wrinkles (Scherer 1932). Directly after having passed the cavity infeed radius, the inevitable wrinkles form due to the excess material that is immediately compressed between the punch and cavity. This forming technology, which has seen no development for about 50 years, whose physical relations are not well understood, and shape accuracy is poor (Hesse and Tenzer 1963; Heinz 1966; Heinz 1967; Tenzer 1989), has received little attention in the market for secondary packaging solutions. In contrast to polymers and metal, paperboard exhibits a rather low compensation potential during mechanical and thermal loading. Wrinkles can only be avoided within low forming ratios (Hauptmann et al. 2015), and a more uniform distribution of the characteristic wrinkles is key for a meaningful improvement of the forming quality (Hauptmann et al. 2011). Based on the model of the deep-drawing of metal (Schlegel 1993), Hauptmann et al. (2011) used a hydraulic system for a permanent force control of the blank holder. Due to the continuously increasing maximum of endurable load as a function of the cross-section of the material, Hauptmann et al. (2016) used linearly increasing blank holder force profiles to improve the visual quality and forming ratio. Furthermore, Hauptmann and Majschak (2011) described the amount of thermal energy applied to the material through the forming tools, the velocity of the punch, and the moisture content of the paperboard as additional major influences on the deep drawing process of paperboard. Among other modes of failure described by Hauptmann (2010), ruptures of the wall significantly limited the quality of the formed parts due to the sliding/motion friction between the paperboard and the surface of the tool set, especially between the blank-holder and forming cavity. As for other processes involving interactions between two solids in contact, control over the factors affecting friction is important due to friction’s impact on runnability and process reliability. Because of the physical interactions between the blank-holder, paperboard, and forming cavity, the friction force cannot be measured separately from the forming force during the forming process. But knowing the behavior of the different friction forces would be helpful for modeling and further optimising the process.
Reports about measuring the coefficient of friction between paperboard and metal samples in substitute tests are often incoherent. Blume and Stecker (1967) and Baumgarten and Klingelhöffer (1979) found that the coefficient of friction experiences an incline with increasing relative velocity because of the higher numbers of interlockings at higher velocities. In contrast, Huttel and Post (2015) stated that the coefficient of friction decreased with the increase in relative velocity and contact temperature. Furthermore, the influence of velocity is affected by the roughness of the metal surface. To obtain a low coefficient of friction between paper and metal, the metal surface needs a smooth finish (Mark et al. 2002). The same correlation was shown by Bayer and Sirico (1971) for a very low velocity. Bayer described this result in terms of adhesive, abrasive, and hysteretic mechanisms. Blume and Stecker (1967) illustrated the same relationship at low velocities but found contrary results at higher velocities. With decreasing normal pressure, the coefficient of friction increased significantly due to the increasing number of interlockings between the surfaces (Blume and Stecker 1967). Huttel et al. (2014) presented a different analysis: the coefficient of friction increased significantly from 0.16 MPa to 0.3 MPa normal pressure, but it remained stable with further increase of the normal pressure. Huttel mentioned an electro-static charging due to the increasing normal pressure as a possible reason for this effect, but did not examine it in more detail. Kornfeld (1976) examined the tribocharging of insulators with filter paper and summarized that the occurring charge had no tendency towards saturation after 80 consecutive tests, each time with a fresh paper sample. Back (1991) reported from a method developed by Whitsitt at IPC to pre-conditioning the metal foil 15 times by motion against fresh paper samples before evaluating the coefficient of friction between paper samples and metal foil.
Lowell and Rose-Innes (1980) and Galembeck et al. (2014) gave an extensive review of the recent progress in friction, tribochemistry, triboelectricity, and contact electrification. When two materials, for example two insulators, are brought into contact and then separated or rubbed against each other, a static electric charge occurs (Harper 1967). The complex contact electrification mechanisms, including how insulators can charge one another, have been the subject of several studies (Diaz and Felix-Navarro 2004; Liu and Bard 2008; McCarty and Whitesides 2008; Baytekin et al. 2011a; Williams 2012a; Burgo et al. 2013), but findings have often been contradictory (Baytekin et al. 2011a; Williams 2012b). There are often large differences between the triboelectric behaviors of different samples of usually the same material, and even a single piece of insulator may show place-to-place variations over its surface, or its charging characteristics may change with time (Shaw 1917; Harper 1967; Lowell 1988; Baytekin et al. 2011a). Recent work has indicated that the presence of water as well as the asymmetric charge partitioning of ions at surface interfaces could be the main causes for triboelectrification (Zhang et al. 2015). However, Nakayama (1996) described a positive correlation between the surface potentials caused by tribocharging and the coefficient of friction between insulating solids like ceramics, polymers, and a diamond stylus. When the surface potential is low, the coefficient of friction is correspondingly low. Recent work (Burgo et al. 2013) acknowledges this conclusion and states that the relation between tribocharging produced by friction and the coefficient of friction of dielectrics may exceed all other factors involved in mechanical energy dissipation.
The influences that affect the friction behavior of paper against metal surfaces are complex and interact with each other in comparison to the different influences mentioned above. Moreover, the coefficient of friction should be treated as operating at the system level (Czichos and Habig 2010), incorporating all known operating parameters and environmental influences of the real process as contributors to the measurement of the friction. Therefore, standard tests (ISO 15359 1999) are insufficient due to the limitations of their measurement conditions in comparison to the requirements of the process of deep drawing with rigid tools and immediate compression. The purpose of this paper is to present a newly developed friction measurement device that meets the requirements of the described forming process. In this work, the friction behavior of a commercially available paperboard was determined based on the normal pressure, the relative velocity, the contact temperature and, foremost, the influence of tribocharging due to repeated tests with fresh paperboard samples. Furthermore, the results are related to the behavior of the paperboard samples during the 3-D forming process mentioned above.
EXPERIMENTAL
Materials
In the following experiments, the commercially available material called Trayforma Natura (Stora Enso, Imatra, Finland) was used. Trayforma Natura is usually applied in tray forming. It consisted of three layers of virgin-quality fiber, and was used at a grammage of 350 g/m2, a thickness of 0.43 mm to 0.45 mm, a tensile strength, in accordance with DIN EN ISO 1924-2 (2009), of 22 N/mm in the machine direction (MD) and 11.5 N/mm in the cross-direction (CD), and under standard climate conditions (23 °C; 50% relative humidity). In accordance with EN ISO 287 (2009) the moisture was determined to be 7.9% ± 0.4%.
Methods
3-D forming equipment
The 3-D forming of the paperboard blanks was conducted with a servo-hydraulic press designed for the deep drawing process with rigid tools and immediate compression (Hauptmann et al. 2011) (Fig. 1). Different from the tool-setup described in Hauptmann et al. (2011), the tools, including punch, die, and blank holder, were equally heated. The tools were composed of polished stainless steel (1.4301) and were grounded to the earth by means of contacts in the machine frame. The geometrical data of the tool set and parameters used for the deep drawing test series are listed in Table 1.
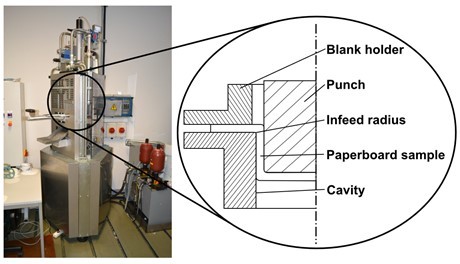
Fig. 1. Servo-hydraulic press for the deep drawing process and schematic tool-setup modified after (Hauptmann and Majschak 2011)
Table 1. Geometrical Data and Parameters of the Deep Drawing Process

Friction tester and strip-testing
To achieve a uniform distribution of the normal pressure, the friction experiments were performed using a newly constructed friction-tester that consisted of five main assemblies, hereafter referred to as the pulling system, the pushing system, the friction measurement system, the adjusting system, and the machine frame (Fig. 2).
To reproduce the friction behavior between the blank holder, the paperboard, and the forming cavity, the strip-testing method was used (Fig. 3): A paper-strip was attached to the pulling system, which consisted of an electromechanical servo-cylinder (SERAC XH12, Ortlieb, Kirchheim, Germany; constant force range ± 12 kN), one s-type force sensor (KD9363s, ME Messsysteme, Hennigsdorf, Germany; measuring range ± 10 kN; accuracy class 0.1%), and a horizontal guiding system that consisted of a low-friction sled/profile rail (HGR25R, Dreckshage, Bielefeld, Germany; friction coefficient 0.004). After this, the paper-strip was clamped between an exchangeable tool-set with a defined normal load. Then, the upper tool was attached to the pushing system and consisted of a second electromechanical servo-cylinder (Serac KH30, Ortlieb, Kirchheim, Germany; constant force range ± 30 kN), one s-type force sensor KD9363s, ME Messsysteme, Hennigsdorf, Germany; measuring range ± 10 kN; accuracy class 0.1%), and a guiding rod.
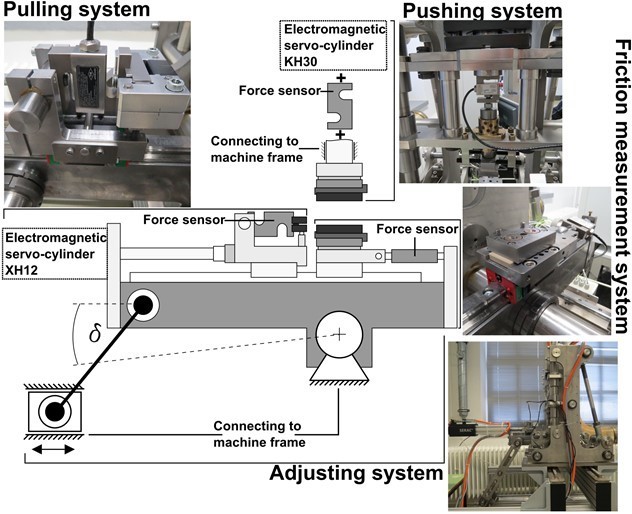
Fig. 2. Schematic and setup of the friction tester
The lower tool was attached to the same guiding system as the pulling system with a second sled, which was connected with the machine-frame through a third s-type force sensor (KD9363s ME Messsysteme, Hennigsdorf, Germany; measuring range ± 5 kN; accuracy class 0.1%). Both tools could be heated with two heating cartridges (hotrod HHP 8 x 40 140 W, Hotset, Lüdenscheid, Germany). For the measurement process, the paper strip was pulled out of the tool-set at a defined velocity and, due to the force control of the pushing system, at a constant normal pressure. During the pulling sequence, the measured force at the lower tool represented the friction force between the paperboard and the metal surface, which was evaluated in the following analysis. For set-ups that would require a higher normal force, all s-type force sensors can be easily replaced to adapt the setup for a higher measuring range.
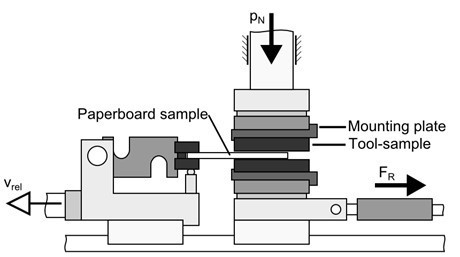
Fig. 3. Strip-testing method schematic
Contact pressure analysis
To obtain parallel contact surfaces by adjusting the tool-set, the whole mounting frame of the pulling- and friction-measurement system, including the lower tool, could be rotated by moving a slider crank linearly with respect to the upper tool (Fig. 2). Afterwards, a finer adjustment of both tool-surfaces could be performed using thin distance rings between the mounting plate and the actual tool-sample. The resulting distribution of the contact pressure between the tool-set and paperboard was analyzed using a contact pressure measurement sheet with a measurement range of 5 MPa to 10 MPa (Fujifilm Prescale LW, Dusseldorf, Germany). Without the paperboard, the machine-made surface of the tool-set had a major influence on the contact pressure distribution (Fig. 4a). When the test was performed with paperboard, the inhomogeneous distribution of the fibers in the fiber-network proved to be the major influence on the contact pressure distribution (Fig. 4b).
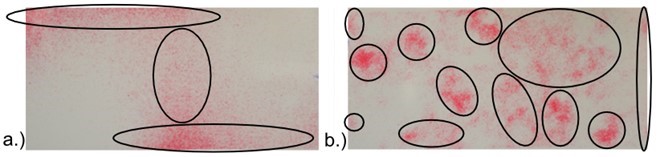
Fig. 4. Contact pressure measurements a) without paperboard and b) with paperboard
Test procedure
To ensure that there was no contamination of the paper samples, clean surgical gloves were worn, and the metal tools for the deep drawing process as well as for the friction measurement process were cleaned before each test series with a sterile cotton wipe (Dastex series 100) soaked with acetone. All of the repetitions of one test series with the same parameter setup were performed using fresh paperboard samples for each repetition, without further cleaning or discharging in-between. The tools using for the friction measurement process were composed of polished stainless steel (1.4301) and were both separately grounded on the side of the tool bulk.
Table 2. Geometrical Data and Parameters of the Friction Measurement Process

Because of the normal pressure control during the test procedure the normal force decreased with increasing sliding distance. At the end of the sliding motion, shortly before the paper-strip leaves the tools, the normal force and with it the friction force decreased towards very small values, which are not reliable any more. In the following discussion the analysis of the friction behavior is limited to 30 and 60 mm sliding distance. Table 2 shows the relation between geometrical data of the paperboard samples, the number of the test series, the number of repetitions and the parameters that were used in every corresponding test series.
RESULTS AND DISCUSSION
Force Progression after Repeated Tests
Figure 5 shows on the left side the punch force profiles for the test series with 0.3 MPa normal pressure applied with the blank holder, 20 mm/s punch velocity, and unheated tools at 23 °C for four repetitions of the deep drawing process. Generally, after two millimeters of motion the punch force inclined rapidly, followed by a smoother but constant increase to a peak force at 25 mm punch position where the paperboard material leaves the contact of the blank holder. Up to this point the punch force profile consists of two parts, the deformation force and the friction force (Hauptmann 2010). When the paperboard sample is completely drawn into the forming cavity, the punch force consists only of the friction force (Hauptmann 2010) and therefore declined significantly until the paperboard leaves the forming cavity after 50 mm.
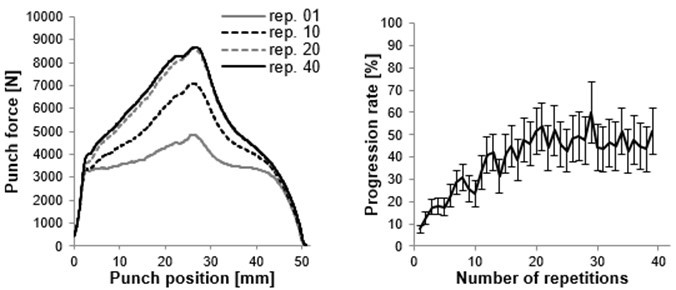
Fig. 5. Progression of the punch force profile after 1, 10, 20, and 40 repetitions (0.3 MPa, 20 mm/s, 23 °C); progression rate of the punch force profiles for 40 repetitions
After the first repetition of the deep drawing process the punch force profile increased significantly over the complete punch movement. This rising trend must be caused only by the friction force, because the increasing punch force profile after several succeeding repetitions continues even if the paperboard is completely drawn into the forming cavity after 25 mm, where only the friction force remains. The increasing trend of the friction force suggests that there is an increase in triboelectric charging due to the frictional contact between the tools and the paperboard sample, similar to the reports in previous literature (Kornfeld 1976; Nakayama 1996; Burgo et al. 2013). To evaluate the progression of this effect for the deep drawing process the progression rate is calculated as,
![]()
over the number (n) of succeeding repetitions. The progression rate in Fig. 5 increased until the 20th repetition and after that remained roughly constant. That means the deep drawing tool-set must converge to a constant charging state where the forming process runs stable. Accordingly, different test series with different parameter setups should be compared to each other only when the corresponding progression rates converge to a constant level.
Similar to the deep drawing process, the sliding force increased when performing the friction measurement process with the same operating conditions (Fig. 6). The corresponding dynamic coefficients of friction, which are calculated as,
![]()
are shown in Fig. 7.
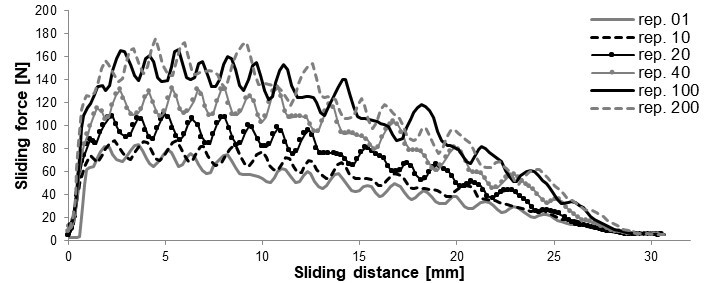
Fig. 6. Progression of the sliding force after 1, 10, 20, 40, 100, and 200 repetitions – test series 1
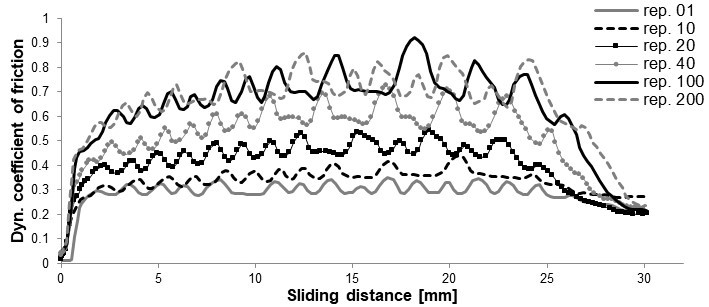
Fig. 7. Progression of the dynamic coefficient of friction after 1, 10, 20, 40, 100, and 200 repetitions – test series 1
There was no distinct peak resulting from static to dynamic friction after several repetitions. A similar curve progression was shown in Kawashima et al. (2008) for paper against aluminum foil. Barnes and Dinsmore (2016) described an experimental technique for observing the heterogeneity in surface charges at the microscale due to contact electrification in ambient conditions, which could have been an explanation for the non-linear curve progression. Baytekin et al. (2011a) described the same effect, that each surface supports a random “mosaic” of oppositely charged regions at a nanoscopic scale. Furthermore, friction force fluctuations (stick-slip) become more pronounced with each additional repetition of the friction measurement process. This may correlate to bipolar chargings at the metal-insulator interfaces (Burgo and Erdemir 2014). Burgo described the random events of force maxima, in which charges are exchanged in both directions, from the metal to the insulator and in the opposite direction.
In contrast to the results illustrated in Fig. 5, the dynamic coefficient of friction did not converge to a constant value after 20 or 40 succeeding repetitions, but after 100 or 200. To describe the progression rate of the dynamic coefficient of friction due to the triboelectric charging, the average value of the dynamic coefficient of friction of all measuring points in one repetition over the sliding distance is calculated as,
![]()
and shown in Fig. 8. The standard deviation described the non-linear progression of the friction force curve in relation to the sliding distance. In all of the following figures after Fig. 8 the standard deviation was omitted for better clarity.
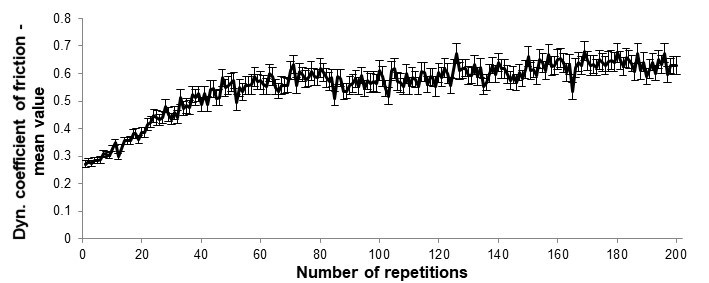
Fig. 8. Progression rate of the mean value for the dynamic coefficient of friction for 200 repetitions – test series 1
To evaluate the behavior of the progression rate of the triboelectric charging, two more test series with the same operating conditions were performed at a distance of several days between each, but only for 100 repetitions because of the marginal changes between repetition 100 and 200 in test series 1. Generally, all three-test series roughly converge to the same mean value of the coefficient of friction after 100 repetitions (Fig. 9).
But in contrast to test series 1 and 3, test series 2 started with a significant higher charging level. Hermans and Labuda (2005) described the difference between triboelectric charges due to the cleaning procedure during the manufacturing of semiconductors with dry or completely moistened wipes. Dry wipes induced a certain amount of charging with different contact partners, while completely moistened wipes induced almost no charge. Presumably, the cotton wipe used before test series 2 was not moistened enough with acetone and during the cleaning process a certain amount of triboelectric charge was induced accidentally.
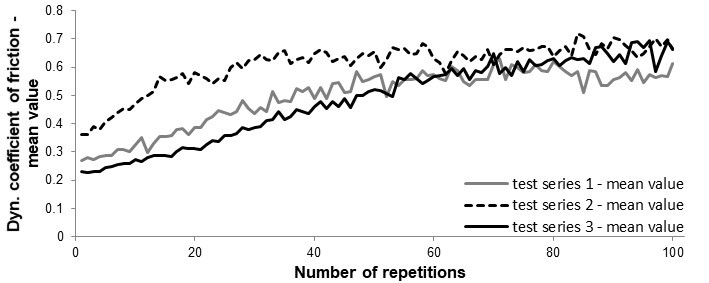
Fig. 9. Progression rates of the mean values for the dynamic coefficients of friction for 100 repetitions – test series 1, 2, and 3
On the other hand, it is possible that during the so called cleaning process a previously induced triboelectric charge could be reduced or eliminated due to contact with the acetone, a relation that was observed by Burkett et al. (1995) for isopropyl alcohol. To find additional evidence for this explanation, following 100 repetitions with fresh paperboard samples in test series 3 a second cleaning procedure of the previously charged tool set was performed with a completely acetone-soaked cotton wipe. After this, a final repetition of the friction measurement process was performed with fresh paperboard. The result of this last repetition with fresh paperboard was an abrupt descent of the friction force slightly below the level of the first repetition (Fig. 10). Accordingly, the high level of the friction force fluctuations decreased to a similar level. The same result could be observed when using a PEEK-plate instead of the acetone-soaked cotton wipe.
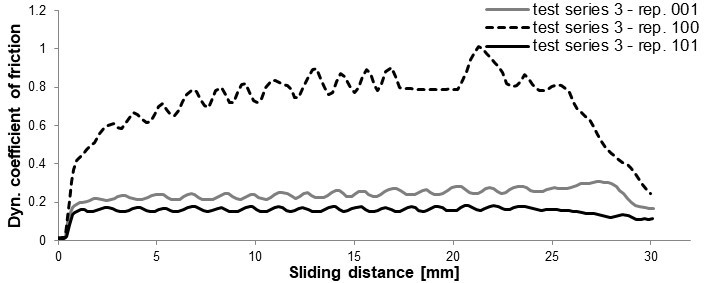
Fig. 10. Influence of the cleaning procedure with completely moistened cotton wipe (acetone) on the dynamic coefficient of friction after 100 repetitions – test series 3
Polymer materials are in relation to metal on the negative side of the triboelectric series (Shaw 1917), and therefore they should negate any previous triboelectric charge of the metal surface. However, this method is not useful for the deep drawing process to release the triboelectric charging because the adaptation of the PEEK for the geometrical circumstances in the deep drawing tools tends to be very complex.
Influence of Contact Temperature
Figure 11 shows on the left side the punch force profiles for the test series with unheated tools at 23 °C and heated tools at 60 °C or 120 °C after 40 repetitions of the deep drawing process. With increasing temperature, the punch force profile decreased significantly, similar to the findings of Hauptmann (2010), Vishtal et al. (2013), and Tanninen et al. (2017). The progression rates of all three-test series converge to a constant level, therefore the punch force profiles could be compared to each other.
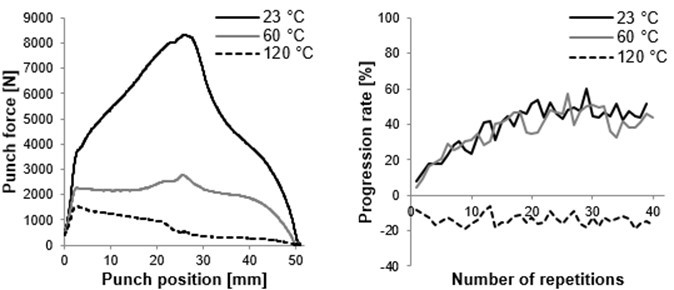
Fig. 11. Influence of contact temperature in the deep drawing process after 40 repetitions for 23 °C, 60 °C, and 120 °C (0.3 MPa, 20 mm/s); progression rates of the corresponding punch force profiles for 40 repetitions
Similar to the results of the three-test series of the deep drawing process, the dynamic coefficient of friction declined significantly with increasing contact temperature after 100 succeeding repetitions of the friction measurement process (Fig. 12, left side). Back (1991), Vishtal et al. (2013), and Huttel and Post (2015) described a similar effect with different commercial virgin papers or paperboard against a heated steel foil or metal plate. Back and Salmén (1989) and Huttel and Post (2015) assumed that the water in the paperboard sample had vaporized and acted as a type of lubricant. In contrast to the progression rate for unheated tools, the mean value of the dynamic coefficient of friction for the heated tools were relatively constant from the beginning (Fig. 12, right side). According to the water-vapor theory by Back and Salmén (1989), Lowell and Rose-Innes (1980) stated that water vapor could affect contact electrification experiments very strongly, because the surface of insulators can become very conductive under damp conditions. As a result, any charge transferred to the insulator may leak into the soil. In contrast, when the charge transfer occurs mainly through water on the surface layers of the insulators (Zhang et al. 2015), the absence of water layers due to evaporation may lead to a constant, only slightly increasing, progression curve of the coefficient of friction for the heated tools.
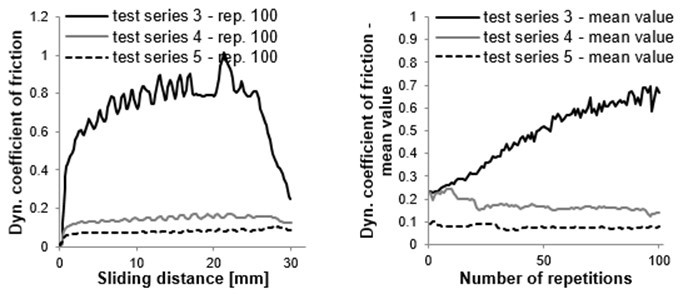
Fig. 12. Influence of the contact temperature on the progression of the dynamic coefficient of friction after 100 repetitions – test series 3, 4, and 5; Progression rates of the mean values for the dynamic coefficients of friction for 100 repetitions – test series 3, 4, and 5
Influence of the Contact Area
Figure 13 shows the influence of the contact area for the dynamic coefficient of friction, comparing test series 3 and 7 with different sample sizes but the same parameter setups. The preparation of the tool-set for test series 7 followed the results illustrated in Fig. 10. For this reason repetition 101 of test series 3 is compared to repetition 1 of test series 7, assuming that the tool set is in both cases completely released of any triboelectric charge. There was no difference between both dynamic coefficients of friction, which supports the assumption that there is no influence of the contact area for completely discharged surfaces. On the other hand, comparing both test series after 100 repetitions, the dynamic coefficient of friction for test series 3 was significantly higher than for test series 7. On the right side of Fig. 13 the progression rates of the mean values of the dynamic coefficients of friction for both test series show that test series 7 probably tended to reach a constant charging state similar to test series 3.
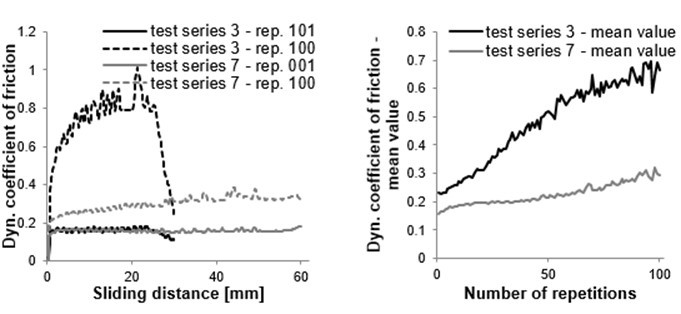
Fig. 13. Influence of contact area on the progression of the dynamic coefficient of friction after 1 and 100 repetitions – test series 3 and 7; Progression rates of the mean values for the dynamic coefficients of friction for 100 repetitions – test series 3 and 7
To find additional evidence for this assumption, test series 7 was continued until 200 succeeding repetitions and therefore could be compared to test series 1 (Fig. 14). After 200 repetitions, the paperboard samples in test series 7 tended to rupture because the sustainable tensile strength was reached. Rose and Ward (1956) examined the variation of charge with contact area for metal-dielectric compressions. The charge remains equal with three different sample sizes. On the other hand, the charge transfer must be influenced by the time under contact, because with increasing sample size the charging rate decreased significantly. Kornfeld et al. (1976) described a similar effect due to charging a sample against time. This leads to the assumption that the dynamic coefficient of friction for the higher contact area may have converged to a constant charging state too, but before this could happen the paperboard ruptured.
Figure 15 shows the influence of contact temperature for the larger paperboard samples at 63 mm sliding distance. Similar to the results with smaller samples, the dynamic coefficient of friction decreased significantly with increasing temperature. Furthermore the dynamic coefficient of friction for heated tools and smaller sample size tended to be slightly higher than for paperboard samples with 63 mm length.
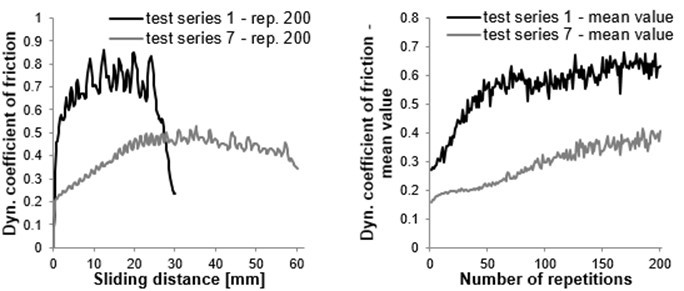
Fig. 14. Influence of contact area after 200 repetitions – test series 1 and 7; Progression rates of the mean values for the dynamic coefficients of friction for 200 repetitions – test series 1 and 7
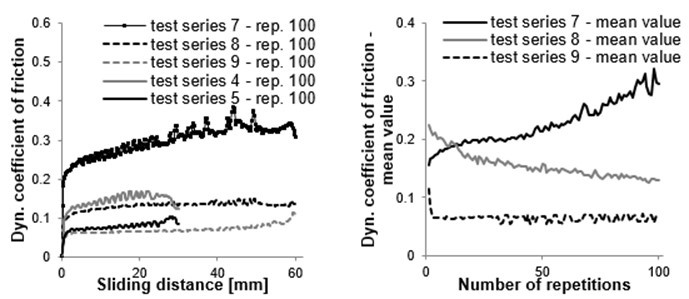
Fig. 15. Influence of contact area and contact temperature on the progression of the dynamic coefficient of friction after 100 repetitions – test series 4, 5, 7, 8, and 9; Progression rates of the mean values for the dynamic coefficients of friction for 100 repetitions – test series 7, 8, and 9
Influence of Relative Velocity
The influence of relative velocity on the dynamic coefficient of friction after 100 succeeding repetitions for both sample sizes is shown in Fig. 16 and Fig. 17. With lesser relative velocity, the coefficient of friction seemed to be higher than with higher relative velocity for samples with 33 mm length. On the other hand, larger samples behaved in a contradictory manner when the coefficient of friction increased with higher relative velocity.
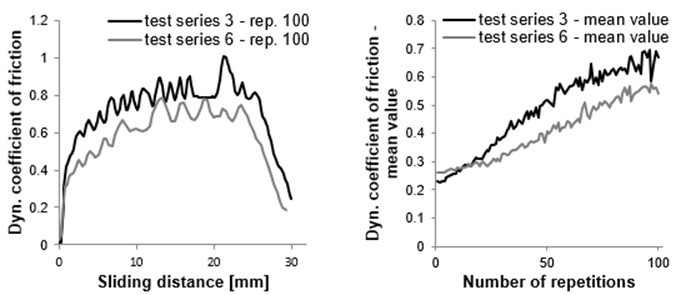
Fig. 16. Influence of relative velocity on the progression of the dynamic coefficient of friction after 100 repetitions – test series 3 and 6; Progression rates of the mean values for the dynamic coefficients of friction for 100 repetitions – test series 3 and 6
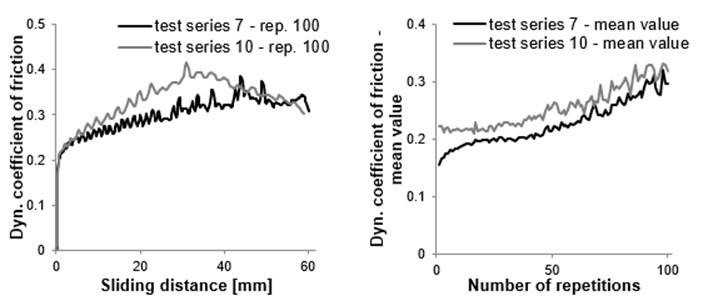
Fig. 17. Influence of relative velocity on the progression of the dynamic coefficient of friction after 1 and 100 repetitions – test series 7 and 10; Progression rates of the mean values for the dynamic coefficients of friction for 100 repetitions – test series 7 and 10
Elsdon and Mitchell (1976) described a dependency at ambient temperatures between tribocharging and the contact velocity. With increased velocity, the transferred charge also increased. Elsdon assumed that the time for charge transfer depended upon mechanical-transient contact-area effects, conduction effects, and charge-transfer transient effects, but it was not possible to quantify these contributions accurately. Without any correlation to charge transfer and contact electrification, Blume and Stecker (1967) and Baumgarten and Klingelhöffer (1979) presented similar results, and both assumed that the amount of interlockings in the real contact area could be time-dependent. In contrast, Huttel and Post (2015) stated that the coefficient of friction decreased with the increase in relative velocity and contact temperature. He assumed that the water vapor due to the heating of the paperboard samples acts like a lubricant for higher relative velocities. With lesser velocities, the water vapor has enough time to evaporate and therefore does not serve as lubricant. However, there should be more test series in future work regarding the effect of the relative velocity on the tribocharging.
CONCLUSIONS
- A new friction measurement device was developed to meet the requirements of the described forming process. Because of the modular design of the device, all of the vital assemblages can be easily replaced to adjust the measurement range according to the needs of the situation.
- The punch force profile resulting of the deep drawing process with unheated tools is mainly influenced by tribocharging of the tool surface during several succeeding repetitions with fresh paperboard samples. The progression rate of the punch force profile should be used to check if the punch force profile converge to a constant level and therefore is comparable to other test series with different parameter setups.
- The major influence on the dynamic coefficient of friction between paperboard and metal was the tribocharging of the surfaces in contact due to sliding friction, equal to the results for the deep drawing process.
- The tribocharging of the tool surface could be released due to contact with a sterile cotton wipe, which was completely moistened with acetone. The same effect had a PEEK-plate, but was considered as too complex for the application in the deep drawing process.
- The friction force fluctuations (stick-slip) became more pronounced with every additional repetition of the measurement routine and were therefore related to the overall charging state of the tool-surface.
- The contact area due to two different sample sizes had, for completely discharged tool surfaces, no influence of the dynamic coefficient of friction. However, the smaller sample size had a significantly higher charging rate than the larger sample size. Furthermore, the tribocharging for smaller sample sizes and unheated tools converged to a constant charging state, which is reproducible in different test series. In contrast, the tribocharging due to the larger sample size did not tend to become saturated, nor did the coefficient of friction. The progression curves for the ambient contact temperature might have converged to a constant charging state like the curves that represented the test series with smaller sample size, but before that could happen the paperboard ruptured because of its limited tensile strength. However, if unheated steel tools were used, this could cause problems for the forming process with regard to the runnability and process reliability.
- The dynamic coefficient of friction decreased with increased contact temperature for both evaluated sample sizes, but remained constant after it reached a certain charging state after several repetitions.
- The influence of the relative velocity was for both sample sizes contradictory. With lesser relative velocity the coefficient of friction seemed to be higher than with higher relative velocity for the smaller sample size. In contrast to that, larger samples behaved in a contradictory manner, in which the coefficient of friction increased with higher relative velocity. There should be more test series in the future regarding the influence of relative velocity.
- To avoid ruptures of the wall section of the deep drawn carton shell during the deep drawing process, tools consisting of polished steel, which are in sliding contact with the paperboard, should be heated at least minimally.
- Before each test series investigating the dynamic coefficient of friction between paperboard and metal, the metal tools should be cleaned with a completely moistened acetone wipe to guarantee the comparability between test series with different parameter set-ups. Furthermore, to investigate the correlation between triboelectric charging and the coefficient of friction, the number of repetitions of the measurement procedure should be enough (e., 50, 100, or 200) to illustrate the friction behavior completely.
ACKNOWLEDGMENTS
The authors would like to thank the German Federation of Industrial Research Associations (AiF) for their funding of the project 18047N. Furthermore, thanks are also directed to Coesfeld Materialtest GmbH & Co. KG for their technical support developing the friction tester, and to Stefan Büttner from the Chair of Processing Machines and Mobile Machines of the TU Dresden for his software support. We acknowledge support by the German Research Foundation and the Open Access Publication Funds of the TU Dresden.
REFERENCES CITED
Back, E. L., and Salmén, N. L. (1989). “The properties of NSSC-based and waste-based corrugating medium,” Paper Technol. 10(30), 16-23.
Back, E. (1991). “Paper-to-paper and paper-to-metal friction,” in: TAPPI International Paper Physics Conference, Kona, USA, pp. 49-65.
Barnes, A. M., and Dinsmore, A. D. (2016). “Heterogeneity of surface potential in contact electrification under ambient conditions: A comparison of pre- and post-contact states,” Journal of Electrostatics 81, 76-81. DOI: http://dx.doi.org/10.1016/j.elstat.2016.04.002
Baumgarten, H. L., and Klingelhöffer, H. (1979). “Über die Reibung an
Papieroberflächen und den Wechsel zwischen Haften und Gleiten [About friction between paper surfaces and the change between sticking and gliding],” Wochenblatt für Papierfabrikationen 107(23-24), 941-946.
Bayer, R. G., and Sirico, J. L. (1971). “The friction characteristics of paper,” Wear 16, 269-277. DOI: https://doi.org/10.1016/0043-1648(71)90030-5
Baytekin, H. T., Patashinski, A. Z., Branicki, M., Soh, S., and Grzybowski, B. A. (2011a). “The mosaic of surface charge in contact electrification,” Science 333, 308-312. DOI: 10.1126/science.1201512
Blume, P., and Stecker, A. (1967). “Physikalische Eigenschaften von Lochstreifenpapier [Physical properties of punch paper],” Feinwerktechnik 71(6), 268-271.
Burgo, T. A. L., Silva, C. A., Balestrin, L. B. S., and Galembeck, F. (2013). “Friction coefficient dependence on electrostatic tribocharging,” Scientific Reports 3(2384), 1-8. DOI: 10.1038/srep02384
Burgo, T. A. L., and Erdemir, A. (2014). “Bipolar tribocharging signal during friction force fluctuations at metal-insulator interfaces,” Angewandte Chemie –International Edition 53(45), 12101-12105. DOI: 10.1002/anie.201406541
Burkett, S. L., Charlson, E. M., Charlson, E. J., Yasuda, H. K., Yang, D.-J. (1995). “The effect of cleaning procedures on surface charging of various substrates,” IEEE Transactions on Semiconductor Manufacturing 8(1), 10 – 16
Carl, D. (1894). “Verfahren und Vorrichtung zur Herstellung von Schachteln aus Pappe, Leder, Blech und dgl. auf der Ziehpresse [Method and device for producing boxes made of cardboard, leather, sheet metal and the like on drawing presses],” Austria Patent No. 2000.
Czichos, H., and Habig, K. -H. (2010). Tribologie Handbuch – Tribometrie, Tribomaterialien, Tribotechnik, Vol. 3, Springer, Wiesbaden, Germany.
Diaz, A. F., and Felix-Navarro, R. M. (2004). “A semi-quantitative tribo-electric series for polymeric materials: The influence of chemical structure and properties,” Journal of Electrostatics 62, 277-290. DOI: http://dx.doi.org/10.1016/j.elstat.2004.05.005
DIN EN ISO 1924-2 (2009). “Paper and board – Determination of tensile properties – Part 2: Constant rate of elongation method (20 mm/s),” Deutsches Institut für Normung [German institute for standardization], Berlin, Germany.
Elsdon, R., and Mitchell, F. R. G. (1976). “Contact electrification of polymers,” Journal of Physics D- Applied Physics 9, 1445-1460.
EN ISO 287 (2009). “Paper and board – Determination of moisture content of a lot – Oven drying method,” European Committee for Standardization, Brüssels, Belgium.
Galembeck, F., Burgo, T. A. L., Balestrin, L. B. S., Gouveia, R. F., Silva, C. A., and Galembeck, A. (2014). “Friction, tribochemistry and triboelectricity: Recent progress and perspectives,” Royal Society of Chemistry Advances 4, 64280-64298. DOI: 10.1039/C4RA09604E
Gossweiler, K. (1908). “Verfahren zum Ziehen von Hohlgefäßen aus Pappe [Method for drawing hollow vessels from cardboard],” Austria Patent No. 34760.
Harper, W. F. (1967). Contact and Frictional Electrification, Clarendon Press, Oxford.
Hauptmann, M. (2010). Die Gezielte Prozessführung und Möglichkeiten zur Prozessüberwachung Beim Mehrdimensionalen Umformen von Karton Durch Ziehen [Process Control and Process Monitoring Options in Multidimensional Forming of Cartonboard through Drawing], Ph.D. Dissertation, Technische Universität Dresden, Dresden, Germany.
Hauptmann, M., and Majschak, J.-P. (2011). “New quality level of packaging components from paperboard through technology improvement in 3D forming,” Packaging Technology and Science 24(7), 419-432. DOI: 10.1002/pts.941
Hauptmann, M., Wallmeier, M., Erhard, K., Zelm, R. and Majschak, J.-P. (2015). “The role of material composition, fiber properties and deformation mechanisms in the deep drawing of paperboard,” Cellulose 22, 3377-3395. DOI: 10.1007/s10570-015-0732-x
Hauptmann, M., Weyhe, J., and Majschak, J.-P. (2016). “Optimisation of deep drawn paperboard structures by adaption of the blank holder force trajectory,” Journal of Materials Processing Technology 232, 142-152. DOI: http://dx.doi.org/10.1016/j.jmatprotec.2016.02.007
Heinz, O. (1966). “Ungenügende Ziehqualität und ihre Ursachen, [Insufficient drawing quality and its causes],” Papier und Druck, Fachteil Buchbinderei und Papierverarbeitung 6, 89-95.
Heinz, O. (1967). “Ziehkraftdiagramme beim Ziehen von Karton und Pappe [Drawing diagrams for drawing cardboard],” Papier und Druck, Fachteil Buchbinderei und Papierverarbeitung 9, 136-139.
Hermans, L., and Labuda, W. (2005). “Elektrische Oberflächen-Ladungen im Fertigungs-Umfeld der Halbleiter-Industrie [Electric surface charges in the manufacturing environment oft he semiconductor industry],” ReinRaumTechnik 1-3, 1-32.
Hesse, F., and Tenzer, H.-J. (1963). Arbeitsverfahren der Papierverarbeitung, Grundlagen der Papierverarbeitung [Working Methods of Paper Processing, Fundamentals of Paper Processing], Vol. 2., Verlag für Fach- und Bibliothekswesen, Leipzig, Germany
Huttel, D., Groche, P., May, A., and Euler, M. (2014). “Friction measurement device for fiber material forming processes,” Advanced Materials Research 966-967, 65-79. DOI: 10.4028/www.scientific.net/AMR.966-967.65
Huttel, D., and Post, P. -P. (2015). Anwendung wirkmedienbasierter Verfahren zum Tiefziehen von Papier und Karton (IGF 17788N) [Application of Media-based Methods for Deep-drawing of Paper and Cardboard (IGF 17788N)], German Federation of Industrial Research Association (AiF), Darmstadt, Germany.
ISO 15359 (1999). “Paper and board – Determination of the static and kinetic coefficients of friction – Horizontal plane method,” European Committee for Standardization, Brüssels, Belgium.
Kawashima, N., Sato, J., and Yamauchi, T. (2008). “Paper friction – Effect of real contact area,” SEN-I GAKKAISHI 64(11), 329-335.
Kornfeld, M. I. (1976). “Frictional electrification,” Journal of Physics D: Applied Physics 9, 1183-1192.
Liu, C., and Bard, A. J. (2008). “Electrostatic electrochemistry at insulators,” Nature Materials 7 (2008), 505-509.
Lowell, J., and Rose-Innes, A. C. (1980). “Contact electrification,” Advances in Physics 29(6), 947-1023.
Lowell, J. (1988). “Contact charging: The effect of sample history,” Journal of Physics D- Applied Physics 21, 138-147.
McCarty, L. S., and Whitesides, G. M. (2008). “Electrostatic charging due to separation of ions at interfaces: Contact electrification of ionic electrets,” Angewandte, Chemie International Edition 47, 2188. DOI: 10.1002/anie.200701812
Nakayama, K. (1996). “Tribocharging and friction in insulators in ambient air,” Wear 194, 185-189. DOI: 10.1016/0043-1648(95)06840-6
Rose, G. S., and Ward, S. G. (1956). “Contact electrification across metal-dielectric and dielectric-dielectric interfaces,” British Journal of Applied Physics 8(1957), 121-126.
Scherer, K. (1932). Untersuchungen über die Ziehfähigkeit und den Ziehvorgang von Pappe [Investigation on the Drawing Ability and the Drawing of Cardboard], Ph.D Dissertation, Sächsische Technische Hochschule zu Dresden, Dresden, Germany.
Schlegel, M. (1993). “Druckgeregelte Stickstofffedersysteme [Pressure controlled nitrogen spring systems],” Bleche, Rohre, Profile 40(1993),7-8
Shaw, P. E. (1917). “Experiments on tribo-electricity- The tribo-electric series,” Proceedings of the Royal Society 94, 16-33.
Tanninen, P., Matthews, S., Ovaska, S.-S., Varis, J., Backfolk, K. (2017). “A novel technique for the evaluation of paperboard performance in press-forming,” Journal of Materials Processing Technology 240, 284-292.
Tenzer, H. -J. (1989). Leitfaden der Papierverarbeitungstechnik [Guide to Paper Processing], Verlag für Fach- und Bibliothekswesen, Leipzig, Germany.
Vishtal, A., Hauptmann, M., Zelm, R., Majschak, J.-P., Retulainen, E. (2013). “3D Forming of paperboard: The influence of paperboard properties of formability,” Packag. Technol. Sci. 27 (9), 677-691.
Williams, M. W. (2012a). “What creates static electricity?,” American Scientist 100(2012), 316. DOI: 10.1511/2012.97.316
Williams, M. (2012b). “Triboelectric charging of insolators – Mass transfer versus electrons/ions,” Journal of Electrostatics 7(2), 233-234. DOI: http://dx.doi.org/10.1016/j.elstat.2012.01.001
Zhang, Y., Pähtz, T., Liu, Y., Wang, X., Zhang, R., Shen, Y., Ji, R., and Cai, B. (2015). “Electric field and humidity trigger contact electrification,” Physical Review X 5, 1-9. DOI: 10.1103/PhysRevX.5.011002
Article submitted: January 31, 2017; Peer review completed: May 2, 2017; Revised version received and accepted: September 19, 2017; Published: September 21, 2017.
DOI: 10.15376/biores.12.4.8340-8358