
Abstract
The dyeing properties of basswood veneer treated by dichlorotriazine reactive dye in a dip dyeing method were evaluated. The effects of dye concentration, dyeing temperature and time, volume ratio, and dyeing agent were observed relative to the dye-uptake and K/S, using gray correlation analysis. Results showed that various dip dyeing factors had remarkable influences on dye-uptake and K/S, especially dyeing temperature and volume ratio. Fourier transform infrared spectroscopy (FTIR), scanning electron microscopy (SEM), and energy-dispersive X-ray spectroscopy (EDX) results indicated that reactive dyes were successfully combined with basswood and diffused into the wood fiber lumens and ray cells. Furthermore, thermogravimetric analysis (TGA) demonstrated that the residue of dyed veneer was higher than undyed, and the temperature at maximum degradation rate of dyed and undyed veneer was different.
Download PDF
Full Article
Evaluation of the Dyeing Properties of Basswood Veneer Treated by Dichlorotriazine Reactive Dye Based on Gray Correlation Analysis
Jihang Hu,a,b,c,d Ying Li,a Liu Yi,a,b,c,d Hongwu Guo,a,b,c,d,* and Li Li a,b,c,d,*
The dyeing properties of basswood veneer treated by dichlorotriazine reactive dye in a dip dyeing method were evaluated. The effects of dye concentration, dyeing temperature and time, volume ratio, and dyeing agent were observed relative to the dye-uptake and K/S, using gray correlation analysis. Results showed that various dip dyeing factors had remarkable influences on dye-uptake and K/S, especially dyeing temperature and volume ratio. Fourier transform infrared spectroscopy (FTIR), scanning electron microscopy (SEM), and energy-dispersive X-ray spectroscopy (EDX) results indicated that reactive dyes were successfully combined with basswood and diffused into the wood fiber lumens and ray cells. Furthermore, thermogravimetric analysis (TGA) demonstrated that the residue of dyed veneer was higher than undyed, and the temperature at maximum degradation rate of dyed and undyed veneer was different.
Keywords: Wood dyeing; Dichlorotriazine reactive dye; Gray correlation analysis
Contact information: a: MOE Key Laboratory of Wooden Material Science and Application, Beijing Forestry University, Beijing 100083, China; b: Beijing Key Laboratory of Wood Science and Engineering, Beijing Forestry University, Beijing 100083, China; c: MOE Engineering Research Center of Forestry Biomass Materials and Bioenergy, Beijing Forestry University, Beijing 100083, China; d: College of Materials Science and Technology, Beijing Forestry University, Beijing100083, China;
* Corresponding authors: ghw5052@163.com; bjfu_lili@126.com
INTRODUCTION
With the rapid development of furniture and the interior decoration industry, customers are paying more attention to the veneers of precious species. In addition, there is an increase in the number of customers who like to use colorful furniture and other wood materials to decorate rooms. Therefore, wood staining has been widely used in wood veneer, maintaining the uniformity of color or improving decorative properties. It can also be used to treat low-quality trees to increase their value (Xu et al. 1997; Chen et al. 2001; Chen 2003; Liao and Deng 2006; Cao 2009; Guo and Guan 2010; Liu 2011). The big concerns are exploring dyes with more colors and increasing the range of dye applications.
- Hill (1937) proposed that wood could be dyed as fancy buttons and buckles for ladies’ coats. J. P. Gill (1948) considered that the popular walnut, oak, and mahogany hues are obtained by shading with oil-soluble dyes. Nishida Hakutaro (1950) stained different woods with direct dyes, acid dyes, alkaline dyes, and vegetable dyes. Moreover, researchers in Italy, Germany, and other countries have carried out attempts at wood dyeing. In particular, the companies ALPI and TABU in Italy first put laminated veneers on the market. However, very few researchers have published papers about important staining technology. It was not until the end of the twentieth century that a large number of Chinese scholars began to explore the wood dyeing technology.
There are various kinds of dyes applied in wood staining, such as acid dyes (Zhao et al. 1993; Duan et al. 1997; Chen et al. 2000; Yu et al. 2001; Guo 2006; Chang et al. 2008; Shao et al. 2011; Liu et al. 2015), disperse dyes (Qu 2007), and basic dyes (Guan 2003; Li 2007; Chen 2008; Chang 2010), but there exist some problems in the above methods. In the process of acid dye and basic dye treatment, the pH of the dye bath should be controlled with the assistance of some reagents that are not environmentally friendly. Moreover, the interaction between wood and acid dyes are merely physical adsorption, which results in poor color fastness. In addition, there is no chemical reaction allowing a covalent bond joining the wood and dye molecule. Compared with the above dyes, reactive dyes are much more ideal for use and have many advantages, such as good color fastness, leveling tendency, bright hues, low cost, and environmentally friendliness. Therefore, many recent efforts have been devoted to the study of wood dyeing with reactive dyes.
Research up to this point has merely focused on the fastness of reactive dyes on veneer or dye-uptake and color, while few articles have been concerned with comprehensive research and mechanisms (Yu et al. 2002; Li et al. 2010; Lv 2012; Li 2013). Cao (2009) and Liu (2011) employed reactive dyes to treat precious wood, and Li (2013) studied the influences of various factors on dye-uptake and color. Li (2014) explored how to improve the dyeing properties of poplar wood by pretreatment, dyeing process factors, and dyeing assistant which could improve the light-fastness of dyed poplar. Yu (2014) studied the process of dyeing birch veneer with reactive brilliant red X-3B. However, few studies have been concerned with comprehensive research and dyeing mechanisms.
In this work, we aimed to investigate the effects of dichlorotriazine reactive dye on dyeing basswood veneer. Then we explored the effects of various factors on dye-uptake and color. Most importantly, we obtained the significant influence factors for dyeing basswood with Gray theory analysis. In addition, FTIR, SEM, and EDX were used to explore the mechanism of interaction between dye molecules and wood fiber. We also used TGA to investigate the stability of dyed basswood veneer. This work may help to produce a new promoter assistant that could enhance dichlorotriazine reactive dye utilization and color fastness in basswood veneer.
EXPERIMENTAL
Materials
The basswood was peeled and then tailored into 100 mm ×100 mm ×1 mm veneers. The veneers were air-dried to a moisture content of approximately 12%. Reactive Brilliant Blue X-BR (C.I. Reactive Blue 4), which is a dichlorotriazine reactive dye mostly used in textile dyeing, was provided by Guang Chun Dye Plant in Beijing, China. Sodium sulfate was used as a dyeing assistant, and sodium carbonate was used for fixing dye. All of the additives were of reagent grade and provided by Yi Xiu Bo Gu Company (China).
Dyeing Method
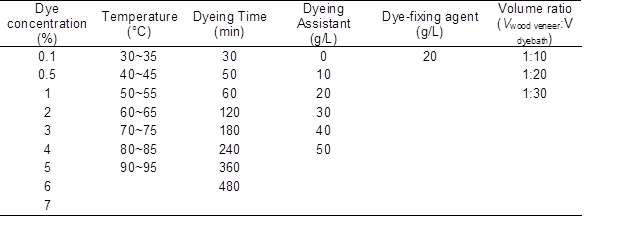
A natural pressure dip-dye method was used for basswood veneer dyeing. Wood veneers were horizontally immersed in the dye bath designed for the present experiments. Spaces between each veneer specimen were provided to avoid overlapping and to ensure leveling. This system was important due to the expected hydrolysis reaction of dye and veneer (Scheme 1, Fang and Wang 2013). And another dye bath without wood veneers was set as the control group. Then, the experimental group and control group were placed into and out of an electro thermostatic water bath at the same time. Samples treated with varying experimental factors, such as dye concentration, staining time, temperature, volume ratio, and amount of dyeing assistant, were obtained. The basic conditions of the single factor were dye concentration (1%), dyeing temperature (50 to 55 °C), dyeing time (60 min), the dosage of dyeing assistant (40 g/L), volume ratio (1:20), and dye-fixing agent (20 g/L). Only one factor was changed at a time, the other factors remaining the same in each group of single factor test, while the dosage of dye-fixing agent was always 20 g/L. The dye concentration was from 0.1% to 7.0%, the staining time was from 30 min to 8 h, the temperatures were from 40 to 90 °C, the volume ratio was 1 to 10 (Vwood veneer: Vdyebath), 1 to 20, and 1 to 40, and the amount of dyeing assistant was from 0 g/L to 50 g/L. After dyeing, the residual dyestuff on the surface of the dyed veneer was washed away by distilled water and then air-dried to a moisture content of 12%.
The experimental parameters are illustrated in Table 1.
Table 1. Single Factor Experimental Conditions for Dyeing Basswood
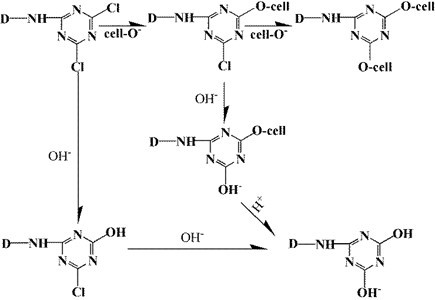
Scheme 1. The mechanism of reaction between the dye and wood
Measurement of Dye Uptake
Dye-uptake was characterized by dye bath absorption, which expressed the degree of dye transfer from dye bath to veneer. A double beam UV visible spectrophotometer (TU-1901, Beijing Purkinje General Instrument Co., Ltd, China) was used to measure the absorption at the maximum absorption wavelength (λmax). The maximum absorption wavelength of Reactive Brilliant Blue X-BR was 210 nm. Ultimate dye-uptake stands for the percentage of the added dye that has transferred to the veneer. The dye-uptake was calculated as follows,
![]()
where A0 and At are the absorption of the dye liquor at λmax, which were from the control group and the experimental group, separately.
The reaction of dye and wood are as shown in Scheme 1.
Measurement of Color
The surface reflectance of the samples was measured by colorimeter (CM-2300d, Konica Minolta, Japan). The Kubelka-Munk equation provides for calculation of a ratio, K/S, from measured reflectance values as shown in Eq. 2,
![]()
where K is the coefficient of absorption, S is the coefficient of scattering, and R is the fractional reflectance at a specific wavelength. The maximum λ was 670 nm. This study was carried out at the maximum wavelength. K/S associates the reflectance of the substrate with the dye concentration. The K/S spectrum as a function of wavelength can be used to identify the apparent absorption maxima. Typically, based on the Kubelka–Munk theory, one can assume that K/S is approximately linear to the variation of chromophores in this range of absorption values.
Gray Correlation Analysis
Gray correlation analysis is applicable to any size and law of samples and it is easy to calculate. Based on gray correlation analysis, the results of the qualitative analysis and the quantitative will always be consistent. Gray correlation analysis is based on the similarity of sequence curve geometry to determine its relevance. The more similar the curves are, the higher correlation of the corresponding sequences is (Liu et al. 2010). With gray relational analysis, one can determine which factors influence dyeing rate and K/S the most.
It is assumed that
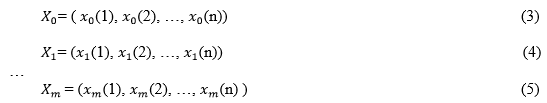
are correlation element sequences. The real number ( (k) , (k)) accorded with the following conditions:
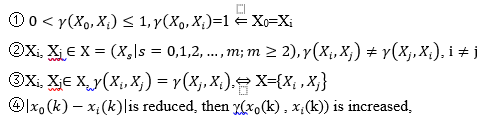
The quantity is the Gray correlation degree of X0 and Xi, and ①~④ are named the Gray Correlation axioms. In Theorem 1 it is assumed that (0,1), then,
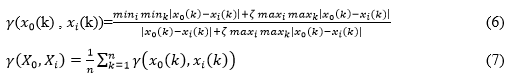
where ζ is the resolution factor, and is satisfied with the Gray Correlation axioms.
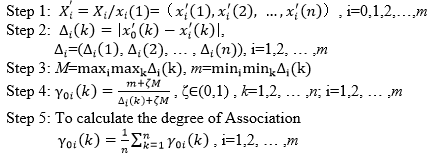
According to the Theorem 1, there are five calculation steps for gray correlation degree as follows:
SEM and EDX
The distribution of reactive dyes within the wood cell cavity and wood ray were observed using a SEM (Hitachi S-3400N, Japan) at an accelerating voltage of 10 kV. The tangential sections of dyed and undyed wood veneers were placed on conductive adhesives and then coated with gold. Moreover, the dyed and undyed wood samples were analyzed with energy dispersive X-ray analysis (EDX) to determine the content of characteristic elements. The dyed sample was treated in dye concentrate 1%, dyeing temperature 60 to 65 °C, dyeing time 60 min, dyeing assistant 40 g/L, dye-fixing agent 20 g/L, and volume ratio 1:20.
Fourier Transform Infrared Spectroscopy (FTIR)
FTIR was used to characterize the surface chemical composition of the basswood veneer treated with the Reactive Brilliant Blue X-BR. All samples which were crushed and tableted with potassium bromide were placed on the diamond crystal of the FTIR spectrometer (Nico-let Nexus 670, USA) in the range of 4000 to 400 cm−1. A total of 64 scans were performed at 8 cm-1 resolution. The dyed sample was treated in dye concentrate 1%, dyeing temperature 60 to 65 °C, dyeing time 60 min, dyeing assistant 40 g/L, dye-fixing agent 20 g/L, and volume ratio 1:20.
Thermogravimetric Analysis
The thermal stability of the unstained and stained basswood veneers was evaluated by TGA. Non-isothermal degradation measurements were performed on a Q5000 TGA device (TA Instruments, USA). Tests were run from room temperature to 700 °C at a heating rate of 10 °C∙min-1 under a nitrogen atmosphere (100 mL/min) to avoid thermo-oxidation. The maximum degradation rate was calculated as the mass (%) at peak temperature divided by peak temperature. The dyed sample was treated in dye concentrate 1%, dyeing temperature 60 to 65 °C, dyeing time 60 min, dyeing assistant 40 g/L, dye-fixing agent 20 g/L, and volume ratio 1:20.
RESULTS AND DISCUSSION
Effect of Dye Concentration on Dye Uptake and K/S
Figure 1 shows the relationship between the dye concentration, dye uptake, and K/S. K/S and dye uptake sharply increased to the highest (16.4%) when dye concentration was between 0.1% and 1%. With dye concentration increasing, K/S first rose to 8.38 at the dye concentration of 1.5% and then almost leveled off, while the dye uptake showed a decreasing tendency. This meant that the reaction between dye molecules and veneer was almost completely restricted to the surface of the sample, so there was only a slight change in K/S and an obvious decrease in dye uptake when the concentration of dye was greater than 1.5%.
With increasing dye concentration, the number of dye molecules was increased per unit volume (Sun et al. 2012). The diffusion of dye molecules into the samples was hindered because of the hydrogen bonds between dye molecules.
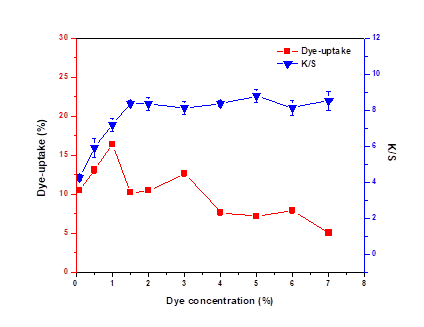
Fig. 1. Effect of dye concentration on dye uptake and K/S
Effect of Temperature on Dye Uptake and K/S
As the temperature of the dye bath was varied from 30 to 90 °C the dye uptake and K/S showed similar behaviors, at first increasing and then decreasing. Dye uptake reached its peak at 60 °C, while the peak of K/S occurred at 80 °C. This could be ascribed to the fact that as a kind of low-temperature dye, the relatively high temperature of the dye bath affected the activity of the dichlorotriazine reactive dye.
The hydrolysis rate of the dye was higher than the reaction rate of the dye and wood. When the dyeing temperature increased higher than 60 °C, the dye uptake decreased (Liao 2006).
In addition, it could be inferred that numerous extractives from unpretreated veneers might dissolve in the dye bath, which would hinder the diffusion of dye.
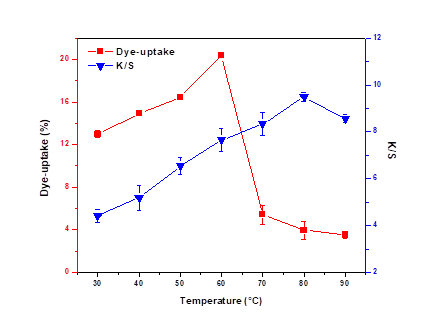
Fig. 2. Effect of dyeing temperature on dye uptake and K/S
Effect of Dyeing Time on Dye Uptake and K/S
It can be seen from Figure 3 that the dye uptake and K/S showed similar behaviors ranging from 30 to 60 min. With increasing dyeing time, the dye molecules agglomerated around pores, which prevented the dye molecules from penetrating into the veneer, so the dye uptake rate slightly decreased. However, the agglomeration of dye molecules was not hindered by the reaction between the wood surface and dye, so the K/S increased. If the dyeing time is more than 3 h, dye molecules have traces of hydrolysis, there was a slightly decrease in the dye uptake. However, the reaction between dyes and the surface of veneer was almost completed, so there was little impact on K/S (Meng 2007).
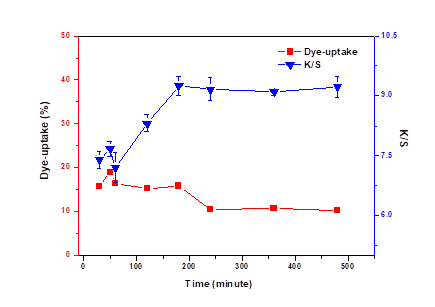
Fig. 3. Effect of dyeing time on dye-uptake and K/S
Effect of Dyeing Assistant on Dye Uptake and K/S
The addition of salts such as sodium sulfate is believed to increase the degree of activity of dichlorotriazine reactive dyes in water (Song and Shen 2009). Because dyes with larger activity will be less attracted to water, dyes may transfer to the basswood veneer more easily. Therefore, the addition of salts increases the dye-uptake of dye. However, a greater amount of sodium sulfate would cause the aggregation of dyes. It can be seen from Fig. 4 that at first dye uptake and K/S both increased when the addition of salts was below 10 g/L and then leveled off with the amount of salts between 10 g/L and 30 g/L. Owing to the fact that sodium sulfate could reduce the repulsion of electric charge on wood and dye ions in the dye bath (Deng et al. 2010), the dye uptake increased greater than K/S when the salt concentration was 40 g/L. Both dye uptake and K/S decreased when the addition was above 40 g/L because the excessive amount of salts caused dye agglomeration and deposition (Deng et al. 1998).
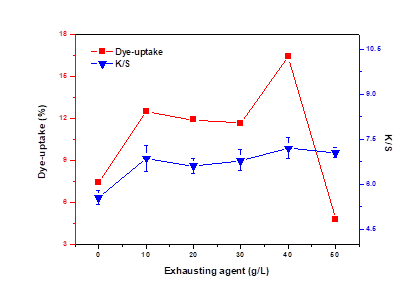
Fig. 4. Effect of dyeing assistant on dye-uptake and K/S
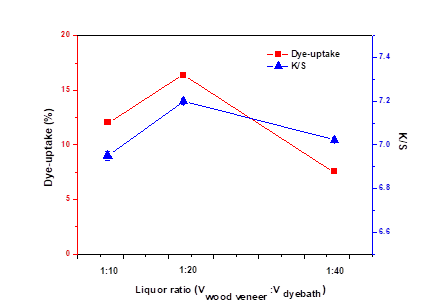
Fig. 5. Effect of volume ratio on dye-uptake and K/S
Effect of Volume Ratio on Dye Uptake and K/S
Based on the previous studies, we chose three kinds of volume ratio to be researched (Liao et al. 2005; Cao 2009; Li 2013). Generally, a low bath ratio can lead to dark shades and non-uniform dyeing. Although a high bath ratio can produce good dyeing, it increases the cost and wastes resources. Therefore, it is of great importance to choose the appropriate volume ratio. As can be seen from Fig. 5, dye uptake and K/S showed the same trend with increasing volume ratio and reached their peaks at the volume ratio of 1 to 20.
Gray Correlation Analysis
We assume K/S (Y1) and dye uptake (Y2) as the evaluation sequence, and the concentration (X1), temperature (X2), time (X3), dosage of dyeing assistant (X4), and volume ratio (X5) as related sequence factors.
Y1=(4.28, 5.91, 7.20, 8.38, 8.36, 8.12, 8.36, 8.80, 8.13, 8.52, 8.74, 4.43, 5.19, 6.55, 7.65, 8.34, 9.50, 8.56, 7.40, 7.68, 7.21, 8.32, 9.25, 8.37, 8.09, 9.22, 5.56, 6.87, 6.61, 6.79, 7.20, 7.05, 6.95, 7.20, 7.02)
Y2=(10.53%, 13.11%, 16.40%, 10.21%, 10.46%, 11.55% ,12.63%, 7.67%, 7.18%, 7.91%, 5.06%, 12.98%, 14.90%, 16.40%, 20.41%, 5.40%, 3.96%, 3.52%, 15.72%, 18.97%, 16.40%, 15.03%, 15.88%, 10.56%, 11.70%, 10.29%, 7.39%, 12.48%, 11.89%, 11.65%, 16.40%, 4.77%, 12.02%, 16.40%, 7.54%)
X1=(0.10%, 0.50%, 1%, 1.50%, 2%, 2.50%, 3%, 4%, 5%, 6%, 7%, 1%, 1%, 1%, 1%, 1%, 1%, 1%, 1%, 1%, 1%, 1%, 1%, 1%, 1%, 1%, 1%, 1%, 1%, 1%, 1%, 1%, 1%, 1%, 1%)
X2= (50, 50, 50, 50, 50, 50, 50, 50, 50, 50, 50, 30, 40, 50, 60, 70, 80, 90, 50, 50, 50, 50, 50, 50, 50, 50, 50, 50, 50, 50, 50, 50, 50, 50, 50)
X3=(60, 60, 60, 60, 60, 60, 60, 60, 60, 60, 60, 60, 60, 60, 60, 60, 60, 60, 30, 50, 60, 120, 180, 240, 360, 480, 60, 60, 60, 60, 60, 60, 60, 60, 60)
X4=(40, 40, 40, 40, 40, 40, 40, 40, 40, 40, 40, 40, 40, 40, 40, 40, 40, 40, 40, 40, 40, 40, 40, 40, 40, 40, 0, 10, 20, 30, 40, 50, 40, 40, 40)
X5=(1:20, 1:20, 1:20, 1:20, 1:20, 1:20, 1:20, 1:20, 1:20, 1:20, 1:20, 1:20, 1:20, 1:20, 1:20, 1:20, 1:20, 1:20, 1:20, 1:20, 1:20, 1:20, 1:20, 1:20, 1:20, 1:20, 1:20, 1:20, 1:20, 1:20, 1:20, 1:20, 1:10, 1:20, 1:40)
We calculated the gray related degree of Y1 and Y2 with X1, X2, X3, X4, and X5 by the five steps, respectively, then obtained the results as follows:
![]()
Obviously it was found that![]() , which means that temperature (X2) has the strongest influence on K/S (Y1), and the dye concentration (X1) has the weakest influence on K/S (Y1). In the same way, the gray related degree of dye uptake (Y2) and volume ratio (X5) was a maximum, so the volume ratio has the greatest effect on ultimate dye-uptake.
, which means that temperature (X2) has the strongest influence on K/S (Y1), and the dye concentration (X1) has the weakest influence on K/S (Y1). In the same way, the gray related degree of dye uptake (Y2) and volume ratio (X5) was a maximum, so the volume ratio has the greatest effect on ultimate dye-uptake.
SEM and EDX Analysis
Figure 6 shows the morphologies of the undyed wood (Figs. 6a and c) and the dyed wood (Figs. 6b and d) with dichlorotriazine reactive dye. Empty vessel walls were obvious in undyed wood (Fig. 6a), while the empty places in the dyed wood were filled with a small amount of dye molecules (Fig. 6b). Noticeably, the surface of wood ray cells in undyed wood veneer was smooth, which can be seen from Fig. 6c. It can see from Fig. 6d there are numerous dye molecules aggregated around the surface of wood rays.
By SEM-EDX, the elemental composition of the undyed wood and dyed wood samples were determined, and the results are shown in Table 2. As can be seen from Table 2, it can be determined that the atoms (Fig. 6b) were those of dye molecules. Comparing the data between Figs. 6c and d, the characteristic elements in the dye were obviously increased (Fig. 7), which means that the agglomerates were dye molecules.
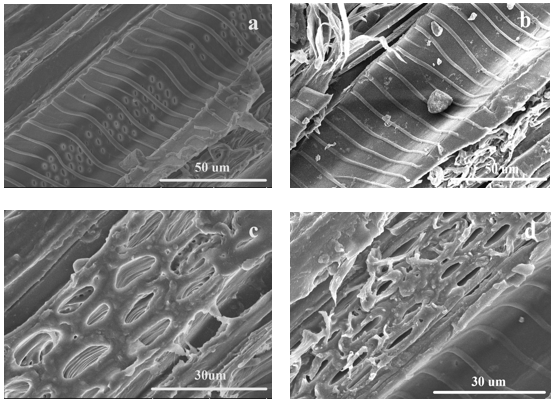
Fig. 6. Scanning electron micrographs: (a) and (c) undyed basswood samples; (b) and (d) dyed basswood sample
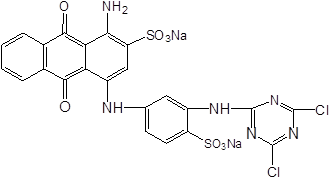
Fig. 7. The molecular structure of dyes
Table 2. SEM-EDX Values of Nitrogen, Sulfur, and Chlorine in Fig. 6

FTIR Analysis
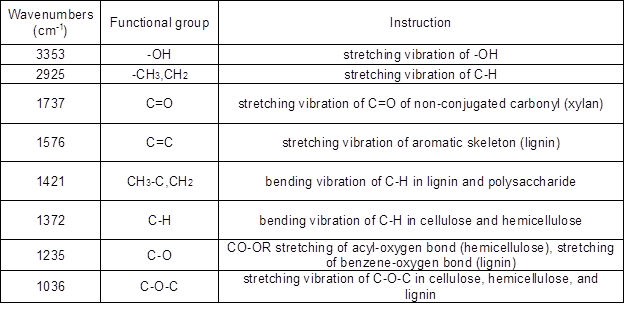
It can be seen from Fig. 8 that there are three strong absorption peaks for the basswood veneer without dyeing when the wavenumbers ranged between 1700 and 3500 cm-1. These peaks corresponded to the functional groups of hydroxyl, methyl, methylene, and carbonyl. The absorption peak of hydroxyl was at 3353 cm-1, which is the characteristic infrared peak of cellulose. That means that a large amount of cellulose and hemicellulose was present in the basswood veneer. The cellulose, hemicellulose, and lignin exhibited an absorption peak at 2925 cm-1, which was attributed to the resonance of C-H. The absorption peak at 1740 cm-1 was quite obvious (Table 3), associated with the stretching vibration of C-O, which indicated that there was a mass of carbohydrate, aldehyde, and keto in basswood (Ding 2011; Li 2011; Liu et al. 2015).
Compared with unstained basswood veneer, the absorption peaks of dyed veneer were reduced at 3353, 2925, 1737, 1235, and 1036 cm-1 because of the substitution reaction between wood and dyes (Scheme 2(Fang and Wang 2013)), so the functional groups in wood decreased. However, the absorption peak increased at 1576 and 1421 cm-1. These diversifications can be seen in Fig. 8 because there were many benzene rings in the dye molecules by substitution reaction into the wood (Fig. 7).
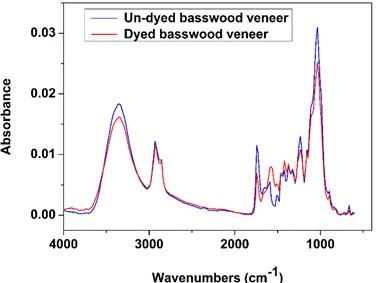
Fig. 8. FTIR spectra of undyed and dyed wood veneer
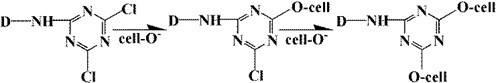
Scheme 2. The mechanism of reaction between the dye and wood
Table 3. Characteristic Band Assignments of FT-IR Spectra of Dyed Wood
TG Analysis
Thermal stability was investigated using thermographimetric analysis (TGA). Weight loss traces and their differential TG curves recorded within 40 to 700 °C are shown in Fig. 9. The first degradation region from 50 to 120 °C is related to release of moisture from the wood, so the undyed and dyed wood had the same tendency. The thermal degradation profiles revealed that most of the degradation events occurred between 200 and 400 °C (Dong et al. 2014). At this stage, the residue of dyed wood veneer was greater than that of the undyed veneer (Table 4), which means the reaction between dyes and veneer reduced the degradation of the veneer. Otherwise, the temperature at maximum degradation rate changed obviously, we can see from Fig. 9 and Table 8. The temperature of dyed wood at the maximum degradation rate was 326 °C, and the undyed wood had a maximum degradation rate at 373 °C. It turns out that the basswood veneer had a chemical reaction with dichlorotriazine reactive dye.
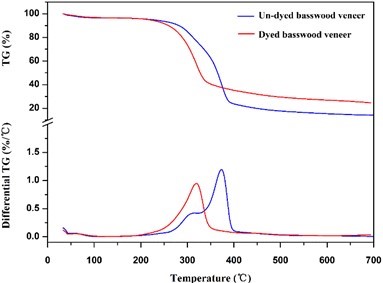
Fig. 9. TG and differential TG patterns of dyed and undyed basswood veneer
Table 4. Thermogravimetric Parameters for Thermal Degradation of Dyed and Undyed Basswood Veneer
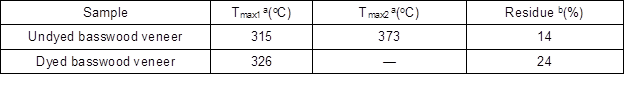
a Temperature at maximum degradation rate
b Values determined at 700 °C at heating rate of 10 °C min-1
CONCLUSIONS
- This study was carried out to improve the decorative property of basswood by dyeing with Reactive Brilliant Blue X-BR. From the data of dye-uptake and K/S, Reactive brilliant blue has a good staining effect on basswood. Through the analysis of Grey Correlation, dyeing temperature had stronger influence on K/S than other factors, and the dyes concentration had the weakest influence on K/S. In the same way, the grey related degree of dye-uptake and volume ratio was highest, so the volume ratio had the most significant effect on ultimate dye-uptake.
- SEM analysis showed that a small amount of the dye molecules diffused into wood lumen, and numerous dye molecules aggregated around the surface of wood rays. The EDX results indicated that a successful dispersion of reactive dyes in basswood occurred.
- The absorption peak at 1594 cm-1 and 1421 cm-1 increased relative to undyed wood, as measured by FTIR, because there were many benzene rings in the dye molecules. In comparison to the undyed wood, the residue and the temperature at maximum degradation rate of dyed wood had changed (TGA), which indicated that a chemical reaction occurs between basswood and dye molecules and supported the FTIR results.
ACKNOWLEDGMENTS
The authors are very grateful for the Beijing Municipal Education Commission Joint Project for Scientific Research and Graduate Training, and the Special Fund for Forestry Research in the Public Interest of China (No. 201204702)
REFERENCES CITED
Cao, L. (2009). Study of Making Engineered Wood by Popular Veneer and Adversely Designing Simulant Patterns of Engineered Wood, M.S. thesis, Northeast Forestry University, Harbin, Heilongjiang, China.
Chang, J., Wang, J. L., Wang, Q. W., Li, C. S., and Wang, Z. T. (2008). “Effects of wood dyeing with microwave processing,” Scientia Silvae Sinicae 44(6), 109-112. DOI: 10.11707/j.1001-7488.20080619
Chang, Y. T. (2010). The Research of Bleaching and Dyeing on the Cork, M.S. thesis, Northwest Agriculture and Forestry University, Yangling, Shanxi, China.
Chen, Y. H. (2003). “The dyeing and overlaying technique of imitating black walnut veneer,” China For. Sci. Technol. 17(1), 40-42. DOI: 10.3969/j.issn.1000-8101.2003.01.015
Chen, L. H. (2008). Study on Stumpage Dyeing Technology of Populus tomentosa, M.S. thesis, Agricultural University of Hebei, Baoding, Hebei, China.
Chen, Y. H., Lu, R. S., and Li, Z. R. (2000). “Study on dye up-take in paulownia veneer dyeing,” J. China Wood Ind. 1, 8-11.
Chen, Y. H., Lu, R. S., and Yang, H. Y. (2001) “Study on dyeing process of paulownia veneer for furniture covering,” China For. Prod. Ind. 4, 17-19. DOI: 10.3969/j.issn.1001-5299.2001.04.005
Deng, S. P., Hu, S. Y., Huang, B. Z., and Lin, J. G. (1998). “Study on dyeing technique of decorative veneer,” J. Fujian Coll. For. 18(2), 114-116. DOI: 10.3969/j.issn.1001-389X.1998.02.005
Deng, H., Liao, Q., and Liu, Y. (2010). “Application of dyeing technique with environment-friendly dyes in poplar veneer dyeing,” J. Cent. South Univ. For. Tech. 30(5), 153-156. DOI: 10.14067/j.cnki.1673-923x.2010.05.008
Ding, Z. J. (2011). Research on Poplar Veneer Dyeing Processing and Lightfastness, M.S. thesis, Nanjing Forestry University, Nanjing, Jiangsu, China.
Dong, Y. M., Yan, Y. T., Zhang, S. F., and Li, J. Z. (2014). “Wood/polymer nanocomposites prepared by impregnation with furfuryl alcohol and nano-SiO2,” BioResources 9(4), 6028-6040. DOI: 10.15376/biores.9.4.6028-6040
Duan, X. F., Li, J., and Liu, Y. X. (1997). “Studies on improvement of wood surface dyeing effects by pretreatment with chitosan,” J. China Wood Ind. 3, 10-13.
Fang, K. J., and Wang, J. Q. (2013). Dye Application Manual, China Textile Press, Beijing, p. 276.
Gill, J. P. (1948). “Some miscellaneous applications of dyes,” Journal of the Society of Dyers and Colourists 64(6), 213–218. DOI: 10.1111/j.1478-4408.1948.tb02510.x
Guo, H. W. (2006). Study on Mechanism and Inhibition of Light-Induced Discoloration of Painted Dyed Veneer, Ph.D. dissertation, Chinese Academy of Forestry, Beijing, China.
Guo, M. H., and Guan, X. M. (2010) “Computer color matching of birch veneer for artificial dyeing,” Scientia Silvae Sinicae 46(9), 130-135. DOI: 10.11707/j.1001-7488.20100921
Guan, T. T. (2003). The Techniques of Bleaching and Dyeing of Cork, M.S. thesis, Chinese Academy of Forestry, Beijing, China.
Hakutaro, N. (1950). “Dyeing of miscellaneous fancy goods,” J. Synthetic Organic Chemistry 8(7), 127-130. DOI:10.5059/yukigoseikyokaishi.8.7_127
Hill, F. (1937). “Miscellaneous applications of dyes,” Journal of Society of Dyes and Colourists 53(6), 233-236. DOI: 10.1111/j.1478-4408.1937.tb01969.x
Li, Q. Q. (2007). Research on Veneer Dyeing Technology, M.S. thesis, Beijing Forestry University, Beijing, China.
Li, Y. Y. (2011). Study on the Dyeing Property for Veneers of Poplar and Birch by Reactive Dyestuffs, M.S. thesis, Chinese Academy of Forestry, Beijing, China.
Li, Z. Y. (2013). Study on Dyeing Effect of Reactive Dyes on Pinus sylvestris Van Mongolica Veneer, M.S. thesis, Northeast Forestry University, Harbin, Heilongjiang, China.
Li, B. (2014). Dyeing Behavior based on Dyed Poplar with Reactive Dyes, M.S. thesis, Northeast Forestry University, Harbin, Heilongjiang, China.
Li, J. L., Yan, C., and Yu, Z. C. (2010). “Study on dyeing performance and mechanism of poplar with reactive dyes,” J. Zhejiang Sci-Tech Univ. 27(4), 534-539. DOI: 10.3969/j.issn.1673-3851.2010.04.005
Liao, Q. (2006). Studies on the Dyeing Technology of Wood with Reactive Dyes, M.S. thesis, Central South University of Forestry and Technology, Changsha, Hunan, China.
Liao, Q., and Deng, H. (2006). “Dyeing of the padauk-imitated veneer of paulownia wood with reactive dyes,” J. Cent. South For. Univ. 26(1), 82-85. DOI: 10.3969/j.issn.1673-923X.2006.01.017
Liao, Q., Liu, Y., Deng, H., and Hu, Y. C. (2005). “Dyeing technology of poplar veneer with reactive dyes,” China Wood Ind. 19(4), 39-41. DOI: 10.3969/j.issn.1001-8654.2005.04.013
Liu, S. F., Dang, Y. G., Fang, Z. G., and Xie, N. M. (2010). Grey System Theory and its Application, Science Press, Beijing, pp. 69-72.
Liu, X. J. (2011). Studies on the Artificial Dyeing of Poplar and Fraxinus mandshurica Veneer, M.S. thesis, Northeast Forestry University, Harbin, Heilongjiang, China.
Liu, Y., Hu, J. H., Gao, J. M., Guo, H. W., Chen, Y., Cheng, Q. Z., and Via, B. K. (2015). “Wood veneer dyeing enhancement by ultrasonic-assisted treatment,” BioResources 10(1), 1198-1212. DOI: 10.15376/biores.10.1.1198-1212
Lv, X. H. (2012). Study on Color Modification and Dyeing Mechanism of Fast-Growing Populus, M.S. thesis, Central South University of Forestry and Technology, Changsha, Hunan, China.
Meng, L. P. (2007). Study on Dyeing Technology of the Birch Veneer and Color Fastness of the Dyed Veneer, M.S. thesis, Northeast Forestry University, Harbin, Heilongjiang, China.
Qu, F. (2007). Research on the Technology of Improving the Lightfastness of Dyed Veneer of Birch, M.S. thesis, Beijing Forestry University, Beijing, China.
R.M. Cox and E.G. Millary (1950). “Paint oil and Chem,” Rer Vol.113, p.14-15 1274
Shao, L. M., Guo, H. W., Li, L., and Liu, Y. L. (2011). “Progress of study on photo-induced discoloration of wood and dyed wood,” Mater. Rev. 3, 83-86.
Xu, J. Y., Li, N. C., and Wu, Q. J. (1997) “Study of treating camphor wood veneer to imitate black walnut veneer,” China For. Prod. Ind. 3, 4-6.
Song, X. Y., and Shen, Y. R. (2009). “Dyeing with the reactive dyes,” Beijing: China Textile Press. 167-168.
Sun, J., Liu, Y. P., Yu, Y. X., and Fang, W. J. (2012). “Research on the effect of dyeing process on the dye-uptake of eucalyptus,” Pract. For. Technol. 12, 76-77. DOI: 10.13456/j.cnki.lykt.2012.12.003
Yu, J. (2014). “Study on the dyeing process of birch veneer with reactive dyes,” J. Liaoning For. Sci. Tech. 3, 28-31. DOI: 10.3969/j.issn.1001-1714.2014.03.009
Yu, Z. M., Zhao, L., Chang, X. M., Li, W. J., and Zhang, S. G. (2001). “Veneer dyeing technology of the hardwood species,” J. Beijing For. Univ. 23(1), 65-67. DOI: 10.13332/j.1000-1522.2001.01.016
Yu, Z. M., Zhao, L., and Li, W. J. (2002). “Study on permeable mechanism with dyestuff during wood dyeing,” J. Beijing For. Univ. 24(1), 79-82. DOI: 10.3321/j.issn:1000-1522.2002.01.017
Zhao, G. J., Wang, D. H., Li, X. Y., He, L., Shi, W. C., Zhao, G. F., and Ikuho, I. (1993). “The permeation process of dye liquor in wood,” J. Northeast For. Univ. 5, 54-59.
Article submitted: July 12, 2015; Peer review completed: September 12, 2015; Revised version received: September 27, 2015; Accepted: October 26, 2015; Published: November 19, 2015.
DOI: 10.15376/biores.11.1.466-481