
Abstract
This paper presents an evaluation of the acoustic ultrasound and stress wave methods for investigating the mechanical properties of wood and the factors that can affect the results, such as the type of device used, the wood species (Scots pine, Norway spruce, Silver fir), the cardinal direction relative to the direction of the plant growth, and the longitudinal measuring position in the trunk (the height of the trunk). The experiments were done using planks of selected species, with the aim of establishing the extent to which the values of the basic mechanical properties of wood could be predicted. These properties included compression strength parallel to the grain (MORL), modulus of elasticity in compression parallel to the grain (MOEL), modulus of elasticity perpendicular to the grain (MOER), compression strength perpendicular to the grain (MORR), hardness in the particular anatomical directions (HardR, HardT, and HardL), and density.
Download PDF
Full Article
Experimental Evaluation of Mechanical Properties of Softwood using Acoustic Methods
Jan Tippner,a,* Jaroslav Hrivnák,b and Michal Kloiber c
This paper presents an evaluation of the acoustic ultrasound and stress wave methods for investigating the mechanical properties of wood and the factors that can affect the results, such as the type of device used, the wood species (Scots pine, Norway spruce, Silver fir), the cardinal direction relative to the direction of the plant growth, and the longitudinal measuring position in the trunk (the height of the trunk). The experiments were done using planks of selected species, with the aim of establishing the extent to which the values of the basic mechanical properties of wood could be predicted. These properties included compression strength parallel to the grain (MORL), modulus of elasticity in compression parallel to the grain (MOEL), modulus of elasticity perpendicular to the grain (MOER), compression strength perpendicular to the grain (MORR), hardness in the particular anatomical directions (HardR, HardT, and HardL), and density.
Keywords: Non-destructive testing; Stress wave; Ultrasound; Sound speed; Strength; Modulus of elasticity; Hardness; Scots pine; Norway spruce; Silver fir
Contact information: a: Mendel University in Brno, Faculty of Forestry and Wood Technology,
Department of Wood Science, Zemědělská 3, 61300 Brno, Czech Republic; b: Technical University in Zvolen, Faculty of Wood Sciences and Technology, Department of Mechanical Wood Technology, T. G. Masaryka 2117/24, 960 53 Zvolen, Slovak Republic; c: Academy of Sciences of Czech Republic, v. v. i., Institute of Theoretical and Applied Mechanics, Centre of Excellence ARCchip Telč, 588 56 Telč, Czech Republic; *Corresponding author: jan.tippner@mendelu.cz
INTRODUCTION
In the interest of achieving the maximum possible preservation of historical sites, including timber constructions, both professionals and lay people have made efforts to investigate the process of decay or insect damage over time. Most types of wood damage result from the use of wood as a food source or even an environment by some species (fungi, insects, etc.). Its gradual damage is part of the natural process of degradation, which enables the survival of these species and the cycle of nutrients. However, the process at times must also be prevented. The extent of the damage depends on several factors, such as wood moisture content, the humidity of the environment where the wood is exposed, and the surroundings (air currents) (Mishiro 1996).
There are also other factors, such as the wood species, the conditions where the tree grew, and the structure of the wood (cracks, defects in the shape, knots, and structure), that play their roles. The structure, species, degree of damage, etc. of the wood is closely related to its physical and mechanical properties. Different properties will cause differences in the propagation of ultrasound and stress strain waves. The relationship between sound propagation and the mechanical properties of wood has been examined in several studies (Haines et al. 1996; Wang et al. 2003; Ross et al. 2004; Kotlínová et al. 2006; Bucur 2010). This paper deals with the evaluation of the propagation of acoustic waves through undamaged materials of various wood species using various devices available on the market.
The non-destructive stress-wave techniques for wood quality evaluation are based on the measurement of velocity of stress-wave generated by a shock, and these methods were developed for the determination of dynamic elastic modulus (MOE) for assessment of mechanical properties of wood species (Jung 1979; Smulski 1991; Bucur 2010).
The stress-wave velocity is determined on the basis of sonic wave flight-time from the transmitter to the receiver. Short sound pulses (unipolar square pulses) are generated by electronic excitation of transducers (Baar et al. 2012). This is the so-called Time-of-flight method (ToF technique). The second approach to measure sound velocity in wood samples is the resonance frequency method (Gerhards 1982; Baar et al. 2012; Hassan et al. 2013).
Signal frequency is an important factor influencing the practical implementation of the ToF technique. For example, Kang and Booker (2002) made experiments with 2.5 m green long board of radiata pine sapwood and discovered that in the case of length 2.5 m or more, the high frequency signals were completely absorbed, and the signal collected consisted of low frequency components only. For green boards less than 0.5 m long the transmitted signal consists almost entirely of the transducer resonance frequency, in that case 54 kHz. Low frequency waves are much less attenuated than high frequency waves. Similar conclusions were stated by Bucur (2010); thus, for small specimens the attenuation decreased linearly with the frequency in the range 1 to 2 MHz.
Wave propagation velocities depend on the pulse frequency, especially in the lower frequency (1 Hz to 1 kHz) range. The use of higher frequencies may lead to higher propagation velocities (Kolhauser and Hellmich 2012). A bandwidth of signal is a related phenomenon. The excitation of wide-band systems is provided by a single spike or half-cycle square waves, which offer broad-band frequency signals. Excitation of narrow-band systems is provided by a tone-burst with either wide-band or resonant probes delivered at a fixed input frequency (Bucur 2010; Bucur and Böhnke 1994).
The stress wave and ultrasound methods for investigating wood are based on the propagation of acoustic waves through wood. Although the terms are often used interchangeably, stress wave methods generally involve low frequencies (in the audible range), while ultrasonic methods involve frequencies beyond the audible range (Kasal and Anthony 2004). The terms ultrasonic and sonic are often confused. The velocity at which a stress wave travels in an object of study is dependent upon the properties of the object only. The terms sonic and ultrasonic refer only to the frequency of excitation used to impart a wave into the object. All commercially available timing units, if calibrated and operated according to the manufacturer’s recommendations, yield comparable results (Ross et al. 2004).
All devices that function according to the principles described above contain two piezoelectric sensors that are laid on the object or pushed inside (spike sensors); one of these works as a receiver of the signal, the other as a transmitter. The signal leaves the measuring device (pulse generator), where the information about the time of transition (µs) or its speed (m.s-1) is displayed, and travels through the wooden member from one sensor to the other. The ultrasonic wave velocity is around three times faster in the longitudinal direction than in the transversal direction (Bucur 2010), which sometimes enables this method to efficiently detect defects that cause changes in grain direction, such as knots and spiral grain (Zombori 2000). These methods are very commonly used as Nondestructive Testing (NDT) to detect internal hollows and degradation in the structures of constructional elements, as well as for measuring mechanical properties (Kasal and Tannert 2010).
All of the devices function via compression of an acoustic wave from the transmitting sensor, which then propagates through the sample profile, either in its longitudinal or transversal direction, toward the receiver. In this way, the velocity or the time of the transmission is established. The degree of damage of the object of study is established based on the velocity or the time. The stress wave methods are those that use Fakopp2D and Ultrasonic Timer. The ultrasound methods are those that use Pundit Plus, Arborsonic Decay Detector, Geotron, and Tico.
To describe the relationships between the outputs obtained by the particular acoustic device used and the mechanical and physical properties of the wood (density, moduli of elasticity, strength, and hardness), standard mechanical tests of the material were also performed. The aim of this work was to verify the accuracy of the prediction of mechanical properties of wood by non-destructive acoustic devices for the selected wood species. Similar evaluations of the velocity of propagation of acoustic waves in the same wood species have been conducted by various authors, in which the following velocities were established: Kollmann and Côté (1968): pine, 932 m.s-1, fir, 1033 m.s-1, and spruce, 1072 m.s-1; Mattheck and Bethge (1993): pine, 1066 to 1148 m.s-1, fir, 910 to 1166 m.s-1, and spruce, 931 to 1085 m.s-1; and Divos and Szalay (2002): pine, 1470 m.s-1, fir, 1360 m.s-1, and spruce, 1410 m.s-1.
EXPERIMENTAL
Materials and Methods
The measurements were performed using three wood species: Scots pine (Pinus sylvestris L.), silver fir (Abies alba Mill.), and Norway spruce (Picea abies L. Karst.). These species were selected because they represent the highest proportion of wood species found in building construction in central Europe (trusses, ceiling constructions, etc.). The trees used for the experiment were grown in a region called Czech Canada (in the south of the Czech Republic), in the only mixed fir-spruce forest at an altitude of 700 m a.s.l. The trees to be felled were selected from each stand using the method of positive selection; i.e., they were the highest quality specimens of their species that had reached the felling age (about 100 years). The choice and processing of the trees was conducted under the authors’ supervision.
The diameters, including the bark, at breast height (d1.3) were as follows: pine, d1.3 = 53 to 54 cm; fir, d1.3 = 46 to 49 cm; and spruce, d1.3 = 50 to 51 cm. All measurements were performed below the trunk height of 18 m, as the number of knots above this limit was too high, and the results could have been negatively affected. The selected trees were felled, marked (the species and height position was marked for each 3m long piece), and further processed. This meant cutting the trunks into 3-m-long pieces that were then cut into quarters, each quarter corresponding to a cardinal direction as the tree grew in the stand. Thus, 24 three-meter radial planks were obtained for each species. The planks were then sorted by species and dried in a hot-air drying chamber for one month. The initial drying temperature was 45 °C, and the final temperature was 60 °C. After drying the planks to 12% moisture content, the locations where they were to be measured were marked on all the planks.
The two most extreme measurement locations on each plank were 0.5 m from each end; the central location was 1 m inward from these extreme locations. That is, the lengths of the sections for the production of samples in each 3-m plank were 0.5 m, 1 m, 1 m, and 0.5 m.
The actual measurements were done using the individual above-mentioned devices in the radial direction in meter distances along the length. For each cardinal direction, 18 measurements were performed on each plank using each device, for a total of 72 measurements per device. Figure 1 shows the total view of a plank with the directions and places of measurement; the first measurement was taken 0.5 m from the end, the other 1.5 m from the end, the next one 2.5 m, and so on. The last measurement was taken at a location 17.5 m from the lower end of the plank.
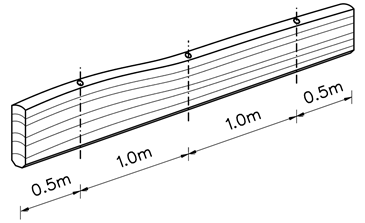
Fig. 1. Diagram of measurement locations in a plank
To be able to specify the mechanical character of each measured position in the trunk more accurately and to relate it to the measurement results from the acoustic devices, samples to be used in mechanical tests were taken from the regions adjacent to the measuring positions. The tests were designed to measure compression perpendicular to the grain (samples of 30 x 30 x 60 mm), compression parallel to the grain (20 x 20 x 30 mm), and Janka hardness (50 x 50 x 50 mm). The number of samples from each location depended on the plank width; e.g., more samples were made from the trunk base (the first meters of the plank) than from the top of the plank.
All mechanical tests were performed using a universal testing machine (ZWICK Z050) with extensometers. The test procedure followed the British standards (Methods of testing small clear specimens of timber 373:1957), and the tests were evaluated by TestXpert v 11.01.
The measurement outputs were the following parameters: compression strength parallel to the grain (MORL), modulus of elasticity in compression parallel to the grain (MOEL), compression strength perpendicular to the grain in the radial direction (MORR), modulus of elasticity in compression perpendicular to the grain in the radial direction (MOER), hardness perpendicular to the grain in the radial direction (HardR), hardness perpendicular to the grain in the tangential direction (HardT), hardness parallel to the grain in the longitudinal direction (HardL), and density (Density). The data were evaluated using Statistica 10 and MS Excel.
Devices
This study used the following stress wave and ultrasound devices and transducers: Pundit Plus (PUND) with sensors at a frequency of 150 kHz, Arborsonic Decay Detector (ADD) with sensors at 75 kHz, Tico with sensors at 54, 82, and 150 kHz (TICO54, TICO82, TICO150), Fakopp2D with transducers of 90 kHz (FAKOPP), and Fakopp Ultrasonic Timer with transducers at 45 kHz (UST).
The measurements were done for: 1) all three wood species, 2) East, West, South and North side of trunk, 3) all length positions (at 0.5 m; 1.5 m; 2.5 m; 3.5 m up to 17.5 m). Sensors were oriented directly in radial direction (one sensor at bark side, one at pith side of radial section) placed without coupling media and uniformly pressed on surface by hands. Readings (time of flight or velocity) visible on device’s display were recorded for future processing. Four readings were recorded in each position and the average value was calculated.
Pundit (portable ultrasonic non-destructive digital indicating tester) Plus is a device developed by the British company CNS Electronic Farnell (Feio 2005). In practice, it is used for the evaluation of the quality and technical condition of various constructional elements, such as beams and bridge constructions or concrete. It is equipped with changeable piezoelectric narrowband transducers (54, 150 kHz, etc.), which are usually placed opposite each other on the surface of the examined object – direct method perpendicular to the grain. The contact with the material can be improved by means of gel, vaseline, modeling clay, honey, or another material of similar character that facilitates the transfer of ultrasound waves. However the influence of any of this medium is small (Kohlhauser et al. 2009). During measurement, the device displays the data on the time of the wave propagation from the transmitter to the receiver in µs or the velocity of the wave propagation in m.s-1. The quantitative values of the data depend on the condition of the evaluated element, the wood species used, and other factors such as moisture content, orientation of the tree rings, presence of decay, and other material defects (Reinprecht 2009; Reinprecht and Hrivnák 2010; Reinprecht and Pánek 2012).
The principle of operation of the Japanese defectoscopic device Arborsonic Decay Detector (ADD) is very similar to that of Pundit. Kloiber and Kotlínová (2006) stated that the method is based on the measurement of the velocity of the propagating elastic deformation, which is dependent on the direction of the signal transmission, the signal being ultrasound waves. The difference between measurement with this device and that using Pundit is that Arborsonic uses a different type of sensor, equipped with a rubber contact surface, which provides better contact with the material surface and aids in leveling surface roughness. The narrowband sensors have a switch under the rubber. When the sensor contacts the material, the switch is tripped and automatically starts the measurement. The ultrasound frequency of propagation through the material is 75 kHz. Using ADD, an expert can predict the presence of hollows, decay, and similar defects in the object under investigation (Frankl et al. 2006).
The Tico is a device from the Swiss company Proceq. It is used in civil engineering to establish the quality of concrete and other building materials, as well as in wood processing research and practice. The mechanism of its evaluation of timber quality is based on a measurement of the velocity of propagation of an ultrasound wave. The Tico uses sensors that emit signals of different frequencies (in this study, 54, 82, and 150 kHz narrowband sensors were used). Similarly, the contact of the piezoelectric sensors with the surface in question is improved by the application of a thin layer of gel, Vaseline, etc.
The author of the concept of Fakopp 2D is Dr. Ferenc Divós, and the device is currently supplied to the market by Fakopp Enterprise. The device is designed for performing diagnostics of trees in parks and forests and for other similar applications in the field. It works on the basis of a simple principle: the measurement of the time required for a stress-strain wave to pass through a tree or a timber element. The device includes broadband spike transducers (90 kHz) that transmit the signals upon contact with the timber. When working with Fakopp, once the SD02/60 sensor has been inserted, a hammer is used to excite the stress wave to pass through the object of study (Ross et al. 2004). The principle behind this method is that the impact of the hammer on the surface of the sensor pushed into the object generates a pressure wave. In practice, this device is used in arboriculture to find internal decay, cracks, and other defects of the trunk invisible from outside that can be a potential risk for the surroundings.
The Ultrasonic Timer is another model from Fakopp. It is a broadband tool. Excitation is made by a short square pulse which covers wide frequency range and receiver electronics accepts 15 to 300 kHz. The sensor has resonance frequency 45 kHz, but it is sensitive for wide range. That device is able to work with more types of piezoelectric sensors, such as spike sensors or laid-on sensors of triangular or cylindrical shape (if the laid-on sensors are used, their surface is covered in a layer of modeling clay or other coupling media). This study used the triangular sensors for measuring in perpendicular direction.
The Geotron was another device used. The actual device – Fluke B192 – can be classified as an oscilloscope. To measure the ultrasound, the device was equipped with an ultrasound impulse generator by Krompholz Geotron Elektronik USG 40 with narrowband UPG-T (the transmitter function) and UPE-T (the receiver function) point sensors, working at a frequency of 20 kHz.
RESULTS AND DISCUSSION
The box plot analysis, which was performed for all the devices used and was also verified by Duncan’s test of statistical significance, showed significant differences among the examined wood species with respect to the manner of propagation of the acoustic waves through their profiles, independent of the device applied. Therefore, the wood species had a significant impact on the measurements obtained, and in practice, species needs to be considered in an interpretation of data. In comparison to the literature (Kollmann and Côté 1968; Mattheck and Bethge 1993; Divos and Szalay 2002), this study found relatively high velocity values. For example, Oliveira and Sales (2006) said that the reason for higher ultrasound velocities in some coniferous species could be the length of the tracheids, as, for instance, the length of tracheids of 3.0 mm and fibres 1.0 to 1.5 mm yielded higher velocities even with smaller density values.
The highest mean velocities in this study were found for pine, regardless of the device applied. The second highest velocities were found in fir, and the lowest velocities were found in spruce. The highest value was that of pine measured by the Pundit plus (2150 m.s-1); the lowest value of pine was yielded by the Fakopp (1475 m.s-1). The same trend appeared for the other species as well: the highest velocity of acoustic wave propagation was always measured by the Pundit (fir 2041 m.s-1, spruce 1889 m.s-1), while the lowest velocity of acoustic wave propagation was always measured by the Fakopp (fir 1375 m.s-1, spruce 1218 m.s-1, the latter being the lowest mean velocity measured within the range of species and devices studied).
Low values similar to those measured by the Fakopp were obtained by the Ultrasonic, which could be explained by the fact that these are both products of the same producer. It was also evident that the mean values measured by the Fakopp most resembled the values of mean velocity measured for the same species by Divos and Szalay (2002). As mentioned above, the similar measurements with slightly different results were done also by Kollmann and Côté (1968) and Mattheck and Bethge (1993). Comparing the results of the present study with those of the cited authors, it can be said that the stress-strain methods represented by the Fakopp and Ultrasonic Timer are the most similar to all the three studies. The other devices, i.e., those operating on the ultrasound principle, measured higher velocities. Hassan et al. (2013) observed that the mean velocity of ultrasound was higher than the velocity measured by the frequency resonance method in samples of Scots pine. Just as in this study, the cited authors measured higher velocities when using the ultrasound method in comparison to methods using the propagation of acoustic, or stress waves through the studied object. In practice, this trend could entail risks if the ultrasound analysis based on absolute values of velocities is relied on. A slightly damaged wood specimen (in the initial stages of decay) could be evaluated as being free of defects, which would have undesirable consequences, provided that conditions were favorable for continued degradation. These outputs of the research support the fact that use of reference (undecayed) material for comparison of measured velocities is needed. The compared data of all acoustic devices, including the means of measured values, standard deviations, and 1.96 times the standard deviations, are provided in Fig. 2.
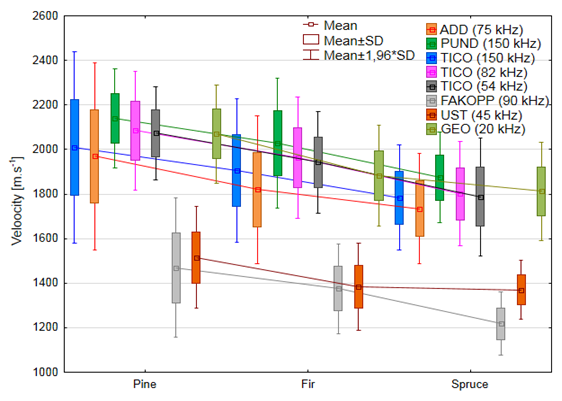
Fig. 2. Comparison of acoustic devices with respect to the mean velocities for particular species
Figures 3 and 4, which show the distribution of measured velocities of the acoustic signal along the trunk axis based on cardinal directions and wood species, does not indicate any considerable differences between the cardinal directions. The largest differences between two neighboring measurements occurred in the north. For example, when measurements of pine were taken using the Tico with 82-kHz sensors, the velocities of the acoustic waves in the 15th meter were 1377 m.s-1 and in the 16th meter were 2077 m.s-1. However, these were only local extremes. The test of statistical differences among the cardinal directions did not confirm significant differences, regardless of the device used. This meant that the original orientation of the trunk, which cannot be distinguished in timber built-in constructions, does not affect the results when measuring timber from an interior of stand with dense crown closure, where, in comparison with solitary tree or tree from canopy border, the influence of structural changes of timber (e.g. reaction wood) could me neglected.
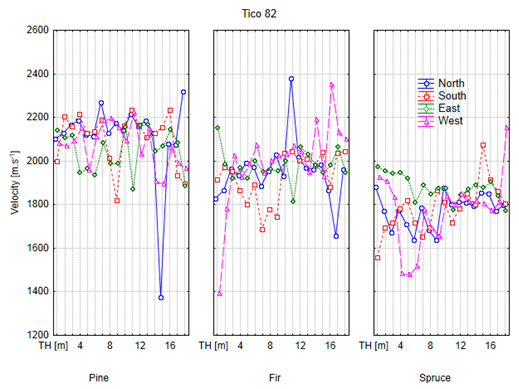
Fig. 3. Distribution of acoustic waves velocity along the trunk axis based on cardinal directions and wood species for device Fakopp
Other comparisons were conducted with respect to differences in mean velocities among the applied devices based on the wood species and the individual measured positions in the trunks. The fact that there would probably be differences is indicated in Fig. 3 and 4. This assumption was not confirmed for all devices. A confirming example is Fig. 5, which shows the variation in velocities without regard for the cardinal directions, as measured by Fakopp 2D. There was a decrease in the velocities of the acoustic waves with the increase in the height of the trunk, and the significance of the effect of the height was also confirmed by the statistical test. A similar distribution and significance of differences was also found for the other stress-strain device, the Ultrasonic Timer.
Duncan’s test yielded significant differences in the achieved velocities between the bottom part of the trunk (the first 10 to 12 meters of height, or rather length) and the remaining top part of the trunk, for the data measured by the Fakopp 2D and Ultrasonic Timer.
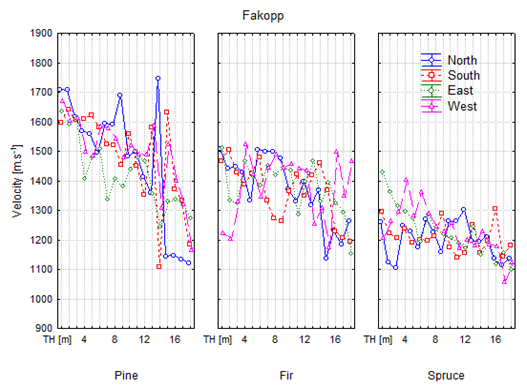
Fig. 4. Distribution of acoustic waves velocity along the trunk axis based on cardinal directions and wood species for device Tico 82
The other devices were not sensitive to the location of measurement in the trunk, and the variations of their distributions were balanced; no statistically significant differences were found for the measured positions along the trunk axis. This fact can be first related to the sensitivity and accuracy of the specific measuring devices, and also to the related wood density, because, as Požgaj et al. (1997) stated, there is a lower proportion of latewood in the higher positions of the trunk than in its lower parts, which is reflected in a decrease in density as trunk height increases. Therefore, the velocities for regions higher on the trunk would be expected to be lower than those measured from lower heights. This issue has also been addressed by Kollmann and Krech (1960), Kollmann and Côté (1968), and Oliveira and Sales (2006).
The devices were also compared amongst each other, resulting in various degrees of correlation. The closest correlation was found between the Tico (with 54-kHz sensors) and Pundit when measuring fir: R=0.62. A similarly close correlation was found between Pundit and Arborsonic, also for fir (R=0.56) as well as for pine (R=0.57). The closest correlation for spruce (R=0.66) was found between two uses of the Tico with sensors working at different frequencies (the Tico with 82-kHz sensors and with 54-kHz sensors); a similarly medium correlation for spruce was found between the Arborsonic and Geotron, where the correlation coefficient was R=0.61.
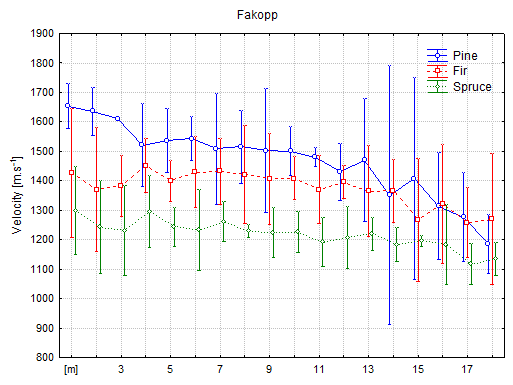
Fig. 5 The distribution of velocities along the trunk axis for pine, fir, and spruce as measured by Fakopp
By comparing the devices, it was found that the correlations were the weakest between those employing the ultrasonic and stress-strain methods. The absolute weakest correlation was found between the Geotron and Ultrasonic Timer when used for spruce. The devices were also evaluated based on the variability of results from the calculated standard deviations of the measured velocities. As the trunks were of comparable quality along their entire heights, e.g., without decay, marks of insect feeding, cracks, or considerable knots, this comparison was sensible and it could be assumed that the results obtained for the particular material were representative. The lowest variability of data, among all the devices, regardless of the species, was found for the Tico 54 kHz and Geotron. If species is considered as well, devices with the lowest variance of output for pine wood were the Tico 54 kHz and Geotron, for fir they were the Fakopp 2D and Tico 54 kHz, and for spruce they were the Fakopp 2D and Ultrasonic Timer.
The following stage of the study investigated correlations between the acoustic velocities measured by specific devices in m.s-1 and the selected properties of wood, e.g., strength and density. Based on the number of the compared pairs of values of n variables x and y at significance level α = 95%, which is sufficient for the significance of the sample correlation coefficient R, based on a statistic table, the coefficient for this significance level was established to be 0.24 for pine and spruce and 0.23 for fir. The selected samples set consisted of 71 compared pairs for Scots pine, 70 pairs for Silver fir, and 72 pairs for Norway spruce.
The correlation coefficients that were found for these sample sets are presented in Tables 1 through 3. To establish the degree of the calculated dependence of the variables, the following assessment was used: R = <±1; ±0.9> was interpreted as very high dependence, R = <±0.9; ±0.7> was interpreted as high dependence, R = <±0.7; ±0.4> represented medium dependence, R = <±0.4; ±0.2> was weak dependence, and R = <±0.2; 0> was interpreted as weak dependence or independence.
Table 1. Correlation Coefficients – Scots Pine (Statistically Significant in Bold)
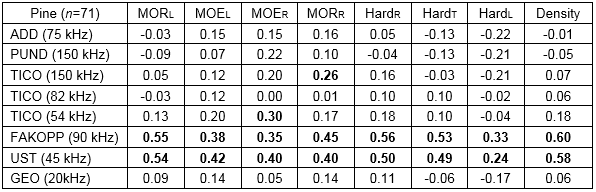
Table 2. Correlation Coefficients – Norway Spruce (Statistically Significant in Bold)
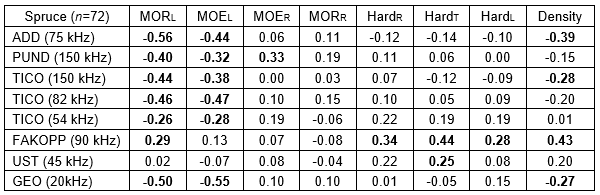
Table 3. Correlation Coefficients – Silver Fir (Statistically Significant in Bold)
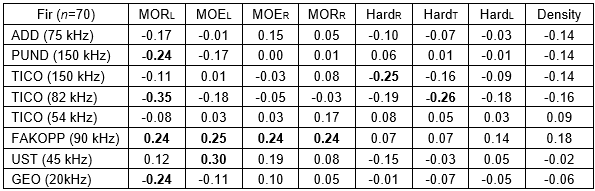
Tables 1 through 3 reveal whether the specific device manifested a significant correlation with the selected wood property or not. By comparing the wood species, it was found that the most statistically significant correlations were calculated for spruce (22 correlations) and pine (18), and that the fewest significant correlations, which were also lower than those of the previous species, were calculated for fir (10). The fact that fir manifested the fewest and the weakest correlations is probably attributable to the high variability within the data obtained and the number of knots in the upper part of the measured fir planks.
The comparison among the applied devices proved that the Fakopp 2D manifested the most qualitatively and quantitatively significant correlations, regardless of the wood species. Only one property – compression strength along the grain (MORL) – was correlated in all three species. The other properties were correlated in only two species each. For example, while hardness and moduli of elasticity manifested positive correlations for spruce and fir, hardness and density were correlated in pine and spruce. Furthermore, the Pundit, the Tico with 150-kHz sensors, and the Geotron had interesting and significant correlations, but only for spruce. With the other acoustic devices, the prediction of a specific property of wood based on the measured velocity of the acoustic wave was troublesome; for example, the coefficient of determination (R2) showed that the density of pine wood had a 36% effect on the acoustic value measured by the Fakopp. The remaining percentage represented the effect of other factors that were not considered in this study. Therefore, referring to Tables 1 through 3, it can be stated that all the other properties and devices achieved lower R2 coefficients.
The correlations between the density and the velocity of the acoustic wave propagations were also investigated by Mishiro (1996) and Ilic (2003), who obtained similar results, i.e., that the velocity does not manifest a sufficient correlation with wood density. Baar et al. (2012) showed that the sound propagation velocity in wood is much more affected by the wood microstructure and did not recommend its prediction based on wood density alone. The comparison of the particular variables describing the character of the wood proved that the strongest correlations are between the velocity measured and the compression strength (MORL) for fir and spruce. The most significant correlation for pine was found between the modulus of elasticity in compression perpendicular to the grain (MOER) and the compression strength perpendicular to the grain (MORR). Selected examples of the above-mentioned dependences are presented graphically in Figs. 6 and 7.
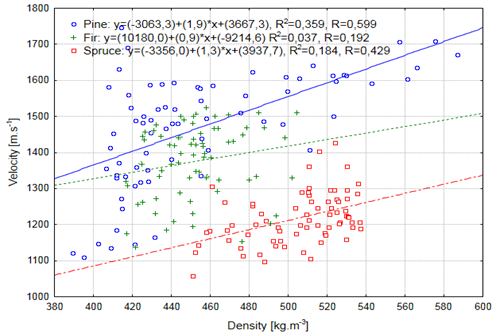
Fig. 6. The relationship between velocity and density for the Fakopp 2D
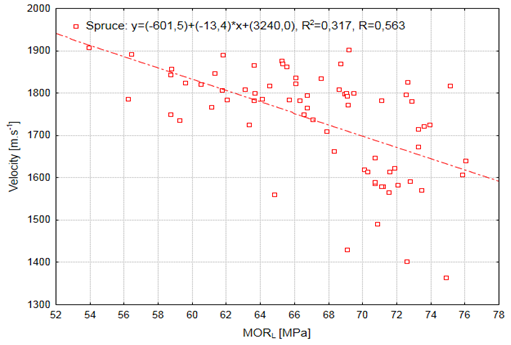
Fig. 7. The relationship between velocity and strength for the Arborsonic Decay Detector
The hardness is a mechanical property that is sensitive to early stage of decay. Relatively poor correlations between hardness and ultrasound velocities in black cherry radial samples were found by Li et al. (2011). In general, referring to above mentioned Tables 1 through 3, results show relatively poor relationships. Moderately significant correlations were found in case of broadband ToF devices, especially for pine wood.
CONCLUSIONS
- The performed experiments showed that the three compared wood species are significantly different, as different mean velocities of acoustic wave propagation were measured for each. The maximum velocities were always measured in pine, and the lowest velocities were always found for spruce.
- The impact of cardinal direction did not prove to be statistically significant in the case of the selected trees growing in an interior of an approximately 100 years old stand with a dense crown closure The same conclusion is valid for differenced in mechanical properties.
- The curves of the velocity distributions along the trunk axis were very dependent on the device used. Most devices were not sensitive to the position of measurement along the trunk. The best results in this respect were achieved by the Fakopp 2D, which measured lower values in the higher parts of the trunk for all three species.
- The comparison of devices showed that results obtained by the Tico with 54-kHz sensors and the Pundit correlated the best. All combinations comparing ultrasonic and stress-strain methods yielded considerably lower correlations.
- Based on the correlation analyses of the outputs of the specific devices and the basic mechanical properties of wood, it can be concluded that the correlations depend on the device used, the variable, and the wood species. However, the measurements have shown that it is not possible to reliably predict strength, elasticity, hardness, or density of material based solely on the output of an acoustic device. Other semi-destructive methods or a combination of methods need to be used to properly assess the timber condition.
- The broad-band devices (Fakopp 2D and Fakopp Ultrasonic Timer) were more suitable for estimation of physical and mechanical properties as the closer qualitative and quantitative correlations were found. A certain shift in measured velocities between narrow-band and broad-band equipment was described.
ACKNOWLEDGMENTS
The authors are grateful to the Ministry of Education, Youth, and Sports of the Czech Republic (project No. 6215648902), the European Social Fund, the state budget of the Czech Republic, under the project titled “The Establishment of an International Research Team for the Development of New Wood-based Materials” (reg. No. CZ.1.07/2.3.00/20.0269), and to the Grant Agency of the Slovak Republic (project VEGA reg. No. 1/0574/12). The paper is based on results supported by NAKI research projects (reg. No. DF11P01OVV001) financed by the Ministry of Culture of the Czech Republic.
REFERENCES CITED
Baar, J., Tippner, J., and Gryc, V. (2012). “The influence of wood density on longitudinal wave velocity determined by the ultrasound method in comparison to the resonance longitudinal method,” European Journal of Wood and Wood Products 70(5), 767-769.
Bucur, V. (2010). Acoustics of Wood, Springer-Verlag Berlin.
Bucur, V., and Böhnke, I. (1994). “Factors affecting ultrasonic attenuation measurements in solid wood,” Ultrasonics 32, 385-390.
Divos, F., and Szalay, L. (2002). “Tree evaluation by acoustic tomography,” in: Proceedings of the 13th International Symposium on Nondestructive Testing of Wood, F.C. Beall (ed.), Forest Products Research Society, Madison, WI, 251-256.
Feio, A. (2005). Inspection and Diagnosis of Historical Timber Structures: NDT Correlations and Structural Behaviour, Universidade do Minho Escola de Engenharia.
Gerhards, C. C. (1982). “Longitudal stress wave for lumber stress grading: Factors affecting applications: State of the art,” Forest Product Journal 32, 20-25.
Frankl, J., Kloiber, M., and Bryscejn, J. (2006). “Non-destructive inspection of a historic wooden structure damaged by fire,” in: Engineering Mechanics 2006 Svratka, Institute of Thermomechanics Acadamy of Sciences Czech Republic, Prague, 62-63.
Haines, D. W., Leban, J. M., and Herbe, C. (1996). “Determination of Young’s modulus for spruce, fir and isotropic materials by the resonance flexore method with comparisons to static flexure and other dynamic methods,” Wood Science and Technology 30(4), 253-263.
Hassan, K. T. S., Horáček, P., and Tippner, J. (2013). “Evaluation of stiffness and strength of Scots pine wood using resonance frequency and ultrasonic techniques,” BioResources 8(2), 1634-1645.
Ilic, J. (2003). “Dynamic MOE of 55 species using small wood beams,” Holz Roh u. Werkst 61(3), 167-172.
Jung, L. (1979). “Stress grading techniques on veneer sheets,” USDA Forest Service General Tech. Rep. FPL 27. USDA, Madison.
Kang, H., and Booker, R. E. (2002). “Variation of stress wave velocity with MC and temperature,” Wood Science and Technology 36, 41-45.
Kasal, B., and Anthony, R. W. (2004). “Advances in in situ evaluation of timber structures,” Progress in Structural Engineering and Materials 6(2), 94-103.
Kasal, B., and Tannert, T. (2010). “RILEM technical committee on in-situ assessment of structural timber,” Adv. Mat. Res. 133-134, 271-274.
Kloiber, M., and Kotlínová, M. (2006). “Comparison of dynamic and static moduli of elasticity in damaged wood,” in: Applied mechanics 2006, University of West Bohemia, 197-209.
Kohlhauser, C., Hellmich, C., Vitale-Brovarone, C., Boccaccini, A. R., Rota, A., and Eberhardsteiner, J. (2009). “Ultrasonic characterization of porous biomaterials across different frequencies,” Strain 45, 34-44.
Kotlínová, M., Kloiber, M., Vasconcelos, G., Lourenço, P. B., and Branco, J. (2006). “Comparison of nondestructive and semi-destructive methods used on two types of wood,” in: In situ Evaluation & Non-destructive Testing of Historic Wood and Masonry Structures, Institute of Thermomechanics Academy of Sciences Czech Republic, 66-76.
Kollmann, F. F. P., and Côté, W. A. (1968). Principles of Wood Science and Technology – I Solid Wood, Vol. 1, Springer, Berlin.
Kollmann, F. F. P., and Krech, H. (1960). “Dynamische Messung der elastischen Holzeigenschaften und der Dämfung,” Holz Roh u. Werkstoff 18(2), 41-54.
Li, L., Wang, X., Wang, L., and Allison, R. B. (2012). “Acoustic tomography in relation to 2D ultrasonic velocity and hardness mappings,” Wood Science Technology 46, 551-561.
Mattheck, C. G., and Bethge, K. A. (1993). “Detection of decay in trees with the metriguard stress wave timer,” Journal of Arboriculture 19(6), 374-378.
Mishiro, A. (1996). “Effect of density on ultrasonic velocity in wood,” Mokuzai Gakkaishi 42(9), 887-894.
Oliveira, R. G. F., and Sales, A. (2006). “Relationship between density and ultrasonic velocity in Brazilian tropical woods,” Bioresource Technology 97(18), 2443-2446.
Požgaj, A., Chovanec, D., Kurjatko, S., and Babjak, M. (1997). Structure and Properties of Wood. Príroda, a.s., Bratislava.
Reinprecht, L. (2009). “Diagnostic of the degraded zones of fir beam situated in the St. Egidius basilica in Bardejov,” Annals of Warsaw University of Life Sciences – SGGW Forestry and Wood Technology 67, 201-207.
Reinprecht, L., and Hrivnák, J. (2010). “Determination of rot and other defects in wooden elements by ultrasonic method and by resistograph – In ancient wooden church in Trnovo and in one new uncompleted log house,” in: Rehabilitation and Reconstruction of Buildings 2010, WTA CZ, 33-40.
Reinprecht, L., and Pánek, M. (2012). “Ultrasonic technique for evaluation of biodefects in wood: Part 2 – In situ and in vitro analyses of old beams using ultrasonic and bending tests,” International Wood Products Journal 4(1), 22-29.
Ross, J. R., Brashaw, K. B., Wang, X., White, H. R., and Pellerin, F. R. (2004). Wood and Timber Condition Assessment Manual, Forest Products Society Madison, WI.
Smulski, S. (1991). “Relationship of stress-wave and static bending determined properties of four northeastern hardwoods,” Wood and Fiber Science 23(1), 44-57.
Wang, S. Y., Lin, C. J., and Chiu, C. M. (2003). “The adjusted dynamic modulus of elasticity above the fiber saturation point in Taiwanian plantation wood by ultrasonic-wave measurement,” Holzforschung 57(5), 574-552.
Zombori, B. (2000). “In situ non-destructive testing of built-on wooden members,” NDT.net (http://www.ndt.net) 6(3).
Article submitted: August 14, 2013; Peer review completed: October 24, 2013; Revised version received and accepted: November 4, 2015; Published: November 19, 2015.
DOI: 10.15376/biores.11.1.503-518