
Abstract
The main objective of the present study was to extract and characterize oligosaccharides from palm kernel cake (OligoPKC) to be used as a prebiotic. Up to 16.81% of oligosaccharides were extracted from PKC using neutral detergent solution with two to eight degrees of polymerization. Molecular weights of seven fractions of OligoPKC were estimated using a mass spectrophotometer procedure resembling those of mannobiose, mannotriose, mannotetraose, mannopentaose, and mannohexaose standards, while those of two unknown components resembled those of heptasaccharide and octasaccharide. Enzymatic hydrolysis of OligoPKC using 11 enzymes showed that β-mannosidase and β-mannanase had the highest effects. OligoPKC fractions were potential substrates for growth of four species of Lactobacillus. Supplementation of OligoPKC in the diet of broiler chickens increased the population of beneficial microbes. However, it reduced the populations of pathogenic bacteria in the cecum. Hence, OligoPKC can be considered a potential prebiotic supplement in the feed and food industry.
Download PDF
Full Article
Extraction and Characterization of Oligosaccharides from Palm Kernel Cake as Prebiotic
Mohammad Faseleh Jahromi,a Juan Boo Liang,a,* Norhani Abdullah,a,b Yong Meng Goh,a,c Rohollah Ebrahimi,a and Parisa Shokryazdan c
The main objective of the present study was to extract and characterize oligosaccharides from palm kernel cake (OligoPKC) to be used as a prebiotic. Up to 16.81% of oligosaccharides were extracted from PKC using neutral detergent solution with two to eight degrees of polymerization. Molecular weights of seven fractions of OligoPKC were estimated using a mass spectrophotometer procedure resembling those of mannobiose, mannotriose, mannotetraose, mannopentaose, and mannohexaose standards, while those of two unknown components resembled those of heptasaccharide and octasaccharide. Enzymatic hydrolysis of OligoPKC using 11 enzymes showed that β-mannosidase and β-mannanase had the highest effects. OligoPKC fractions were potential substrates for growth of four species of Lactobacillus. Supplementation of OligoPKC in the diet of broiler chickens increased the population of beneficial microbes. However, it reduced the populations of pathogenic bacteria in the cecum. Hence, OligoPKC can be considered a potential prebiotic supplement in the feed and food industry.
Keywords: Prebiotic; Oligosaccharide; Palm kernel cake
Contact information: a: Institute of Tropical Agriculture, Universiti Putra Malaysia, 43400, Serdang, Selangor, Malaysia; b: Faculty of Biotechnology and Biomolecular Sciences, Universiti Putra Malaysia,43400, Selangor, Malaysia; c: Faculty of Veterinary Medicine, Universiti Putra Malaysia, 43400, Serdang, Selangor, Malaysia; *Corresponding author: jbliang@upm.edu.my
INTRODUCTION
Prebiotics are non-digestible food ingredients that stimulate the growth and/or activity of bacteria in the digestive system in ways claimed to be beneficial to the health of the host (Gibson and Roberfroid 1995). Prebiotics are mainly oligosaccharide (OSC) carbohydrates such as fructo-OSCs, galacto-OSCs, and mannan-OSCs. Gibson and Roberfroid (1995) suggested that to classify a food or feed component as a prebiotic it must meet the following criteria: i) resistant to gastric acidity, hydrolysis by mammalian enzymes, and gastrointestinal absorption, ii) fermentable by the specific intestinal microflora, and iii) selectively stimulating the growth and/or activity of intestinal bacteria associated with health and wellbeing of the host.
Currently, prebiotics have a big market worldwide, and more than 20 companies are producing OSCs and dietary fibers as prebiotics (Pineiro et al. 2008). The prebiotic market in Europe alone approaches 180 million Euros per year (Pineiro et al. 2008). In the current scenario, production of prebiotic OSCs is usually by one of the following three general processes: i) direct extraction of natural OSCs from plant materials, ii) controlled hydrolysis of natural polysaccharides, or iii) enzymatic synthesis of OSCs using hydrolases and/or glycosyl transferases from plant or microbial origin (Gibson and Rastall 2006). Most commercial prebiotics, including xylo-OSCs and isomalto-OSCs, are produced by enzymatic hydrolysis of polysaccharides (Gibson and Rastall 2006). However, the process of enzymatic production of OSCs is expensive, and extraction of these bioactive materials directly from natural products may be a better choice for commercial production of prebiotics (Manderson et al. 2005). A common example for this method of OSC production is the extraction of soybean-OSCs from soybean (Kim et al. 2003).
Palm kernel cake (PKC) is the main byproduct from the palm oil industry in several tropical countries, including Malaysia, Indonesia, Thailand, and Colombia. The cell wall components of PKC have been reported to consist of 580 g/kg mannan, 120 g/kg cellulose, and 40 g/kg xylan (Mohd-Jaafar and Jarvis 1992). More recently, Zhang et al. (2009) extracted up to 488 g/kg D-mannose from PKC. It has been reported that supplementing 2.5% PKC in the diet can significantly reduce the population of Salmonella in the intestine of chickens (Allen et al. 1997). A more recent study by (Yusrizal et al. 2013) showed that inclusion of 30% PKC in the diet of laying hens increased the population of beneficial lactobacilli and suppressed the growth of E. coli in the intestinal tract. The beneficial effects of mannan-OSCs on intestinal microflora have been also mentioned by other researchers (Fernandez et al. 2000; Fernandez et al. 2002). The above information suggests that the beneficial effects of supplementing PKC in the diet of chickens could be due to the prebiotic effects of OSCs present in PKC, which are mostly mannan-OSCs. Thus, PKC has the potential to be used as a source of prebiotics for livestock; however, currently it is mostly used as a cheap feed ingredient for cattle.
Oligosaccharides, as the most common prebiotics, are a complex group of high-molecular weight (MW) carbohydrates with variable structures and metabolic functions. Extraction and characterization of these components from an agricultural byproduct such as PKC is a challenging task. To the best of our knowledge, there is no published information on the extraction and characterization of OSCs from PKC for use as prebiotics. Thus, the objectives of this study were to extract and characterize the OSCs from PKC (OligoPKC) and investigate their prebiotic efficacy. Because carbohydrate oligomers have a more potent antimicrobial activity than carbohydrate polymers (Hirano and Nagao 1989), short-chain prebiotic can be fermented faster than longer-chain prebiotics in the intestinal tract (Kleessen et al. 2001), and also they have stronger effect on enhancement the level of intestinal lactobacilli and immunoglobulin (Ito et al. 2011), the present study focused on the short-chain OSCs of PKC.
EXPERIMENTAL
Selection of the Best Method for Extraction of OSCs from PKC
Palm kernel cake was obtained from a local supplier in Serdang, Selangor, Malaysia. The OSCs from PKC were extracted using the following 12 different solvents and protocols: distilled water (shaken at 60 °C for 1 h or autoclaved at 121 °C for 20 min); 10%, 25%, 50%, 75%, and 100% ethanol (shaken at room temperature for 1 h); neutral detergent solution (NDS) (shaken at 60 °C for 1 h or autoclaved at 121 °C for 20 min); acid detergent solution (ADS) (shaken at 60 °C for 1 h or autoclaved at 121 °C for 20 min); and 1 M H2SO4 (shaken at 60 °C for 1 h). The NDS and ADS were prepared using the procedure described by official methods of analysis of AOAC International (Helrich and AOAC 1990).
To extract the OligoPKC, 20 g of PKC (0.5 mm particle size) was dissolved in 100 mL of each of the above solvents in 250-mL Schott bottles and treated under the conditions described above. After that, insoluble materials were removed by centrifugation at 15,300 g for 10 min at room temperature. The supernatant was filtered using Whatman filter paper No. 1 (Maidstone, UK), and the OSC and monosaccharide (MSC) contents were determined using high-performance liquid chromatography (HPLC).
Preparation of Solid OligoPKC
A water extract of PKC was prepared by dissolving 100 g of PKC in 1 L of distilled water and shaking the mixture for 10 min; then the mixture was autoclaved at 121 °C for 20 min. Insoluble materials were removed by centrifuge (15,300 g) for 10 min and filtered through Whatman filter paper No. 1 (Maidstone, UK). To remove the hydrophobic groups (mostly lipids or glycolipids), 500 mL of the extract was mixed with 500 mL of chloroform/methanol mixture (2:1) (Carlsson et al. 1992); the mixture then was shaken for 5 min and left to stand for 20 min at room temperature. After that, the water/ethanol phase was transferred to another bottle, and the same procedure was repeated two more times. The chloroform-soluble fraction was dried and used to analyze the possible sugar contents in the form of glycolipids.
Palm kernel cake contains a relatively high level of crude protein (approximately 16%, in the form of protein or glycoprotein), and part of the protein could remain in the solvent during the extraction process. Protein from the extracted sample was removed by adding 650 mL of acetonitrile in 350 mL of the PKC extract and, after shaking for 5 min, the sample was centrifuged (15,302 g for 10 min at room temperature). The precipitate fraction in the acetonitrile was dried and used to analyze the possible sugar contents in the form of glycoprotein.
The water content of the OligoPKC was removed by reduced pressure at 40 °C using a rotary evaporator (Heidolph Instruments GmbH & Co. KG, Germany) and the residue was freeze-dried (FreeZone 6 Liter Benchtop, Labconco Corporation, Kansas City, MO, USA) to obtain the solid OligoPKC.
Detection of OSCs and MSCs using HPLC
The concentrations of OSCs were assayed using high-performance liquid chromatography (HPLC) (2690, Waters, USA) with a COSMOSIL Sugar-D column (250 × 4.6 mm i.d., 5 μm). The mobile phase consisted of acetonitrile and water (65:35, v:v) with a flow rate of 0.7 mL/min and column temperature of 35 °C. A reflective index (RI) detector (2414, Waters, USA) was used for the detection of OSCs in the detector sensitivity of 1024 and temperature of 30 °C. The sample injection volume was 20 μL, and the running time was 20 min. The samples were filtered through 0.22-μm nylon syringe filters (Pall Gelman Laboratory, USA) before injection into the HPLC. As mentioned earlier, according to Jaafar and Jarvis (1992), the cell wall component of PKC consisted of 580 g/kg mannan. Zhang et al. (2009) reported the extraction of up to 48.8% of D-mannose from PKC and our analysis also showed 43.43% of D-mannose in the PKC, suggesting that the majority of OligoPKC is mannan-based. Thus, in the present study, five pure mannan-OSCs, i.e., mannobiose, mannotriose, mannotetraose, mannopentaose, and mannohexaose (Megazyme, Ireland) were used as standards for determination of OSCs.
For determination of total MSCs in the PKC, 100 mg of dried PKC was hydrolyzed using 10 mL of sulfuric acid solution (pH 1) at 100 °C for 6 h. The method of hydrolysis was according to Szambelan and Nowak (2006) with some modification. After hydrolysis, samples were centrifuged at 10,000 g for 5 min, filtered through 0.22-μm nylon syringe filters (Pall Gelman Laboratory, USA), and injected into the HPLC. The same method was used for determination of MSCs in the OligoPKC, chloroform-soluble part (lipids or glycolipids), and acetonitrile precipitate fraction (proteins or glycoprotein) of PKC.
Monosaccharides were detected using the same method described for OSCs, but the mobile phase was 80% acetonitrile in water and the flow rate was 1 mL/min. Glucose, galactose, fructose, mannose, and xylose (Sigma-Aldrich, St. Louis, MO) were used as standards. In this method of sugar analysis by HPLC, glucose and galactose had the same retention time.
Purification of OSCs
To obtain pure OSCs, solid OligoPKC was dissolved in a mobile phase (65% acetonitrile in water) at the ratio of 1:10, filtered through 0.2-μm nylon syringe filters (Pall Gelman Laboratory, USA), and transferred into 2-mL HPLC tubes. The HPLC operating conditions were similar to that described previously for the standards, except for the injection volume, which increased to 60 µL, and the HPLC was connected to a fraction collector (Waters, USA) to collect the OSC fractions from every injected sample. Mixtures of the mobile phase and the fractions were dried using a rotary evaporator (Heidolph Instruments GmbH & Co. KG, Germany), and the residues were freeze-dried (FreeZone 6 Liter Benchtop, Labconco Corporation, Kansas City, MO, USA) to obtain the solid pure OSC samples, which were later used for determination of their respective MWs.
Determination of Degree of Polymerization of OSCs
Freeze-dried forms of all eight purified fractions of OSCs from OligoPKC were mixed (in final concentrations of 5 mg/mL each) and subjected to HPLC for determination of degree of polymerization (DP). The mobile phase (Milli-Q water) was run into the HPLC at a flow rate of 0.3 mL/min at 65 °C through a REZEX RSO-oligosaccharide column (1 µm, 10 mm × 200 mm, Phenomenex, Torrence, USA). The calibration of the column was carried out using the standard of OSCs i.e., mannobiose, mannotriose, mannotetraose, mannopentaose, and mannohexaose (Megazyme, Ireland), and the injection volume was 3 µL. Detection was performed using a refractive index detector.
Determination of Molecular Weight
Molecular weights of the fractions of purified OligoPKC were determined using TOF LC/MS (6224 Series, Agilent, USA). Different OSC fractions were dissolved in 65% acetonitrile in a final concentration of 1 mg/mL. After filtration (0.22-µm syringe filter), 10 µL of each fraction was injected into the TOF LC/MS system.
The chromatographic conditions were as mentioned above. The outlet of the HPLC apparatus was attached to the inlet of the TOF mass spectrometer operated with electrospray ionization (ESI) dual source in positive mode. Data were collected in full scan MS mode over the m/z range from 100 to 1500 Da. Agilent Masshunter software was used for instrument control and data acquisition (Version B.04.0, Agilent Technologies, CA). The ESI conditions were set as follows: capillary voltage 4 kV, nebulizer pressure 40 psi, drying gas (nitrogen) temperature 350 °C, skimmer voltage 65 V, fragmentor voltage 200 V, and drying gas flow 10 L/min. The TOF–MS internal mass calibration was performed using a calibration solution (ESI–TOF reference mass solution, Agilent) that provided 112.9855 and 1,033.9881 m/z in positive mode.
13C NMR and 1H NMR spectroscopy
Samples were dissolved in deuterated water (D2O) at 5mg/ml for both 13C NMR and 1H NMR. 1H NMR spectra were recorded with an INOVA-600 spectroscopy r (Agilent Technologies Japan, Ltd., Tokyo Japan) equipped with a 1H[15N-31P] pulse field gradient indirect-detecting probe. Chemical shifts were referred to HOD. 13C NMR spectra were recorded with an INOVA- 600 spectroscopy at 30 °C in D2O with a relaxation delay time of 1.000 s.
Enzymatic Hydrolysis of OSCs
Enzymatic hydrolysis tests were conducted for identification of the monomer content of OligoPKC. Pure mannopentaose (Megazyme, Ireland) and OligoPKC were treated with different pure carbohydrate enzymes, as mentioned in Appendix A. Mannopentaose and OligoPKC were dissolved in distilled phosphate buffer (pH 6) with final concentrations of 5 and 20 mg/mL, respectively. After that, 20 units of each pure enzyme were added to individual tubes containing 1 mL of mannopentaose or 1 mL of OligoPKC mixture. Samples were incubated at 55 °C for 12 h with shaking in a water bath (150 rpm). At the end of incubation, changes in the concentration of OSCs and MSCs in the samples were determined using HPLC according to the method described earlier.
Efficacy of OligoPKC as Prebiotic
In vitro study
In the present study, the potential of OligoPKC as a prebiotic was tested by examining the efficacy of growth of four strains of lactic acid bacteria (LAB), namely Lactobacillus farraginis ITA22, L. pentosus ITA22, L. brevis ITA33, and L. acidipiscis ITA44 (previously isolated from Mulberry silage), in the OligoPKC culture medium and the production of organic acids by these microorganisms.
The OSC medium used for this study was prepared by dissolving 2 g of OligoPKC in 100 mL of water and adjusting the pH to 6.2. De Man, Rogosa, and Sharpe (MRS) broth was used as the standard medium (control) to compare the ability of the above-mentioned LAB to grow in the OligoPKC. Four milliliters of each medium was separately transferred into 10-mL glass bottles and autoclaved for 15 min at 121 °C. The OSC and MRS media were inoculated (10%) by overnight culture of each LAB and incubated for 24 h at 37 °C in anaerobic condition. At the end of the incubation period, the growth rates of LAB were determined by reading the optical density (OD) at 650 nm using a spectrophotometer (Barnstead International, USA). The quantity of OSCs in the OligoPKC medium was determined using HPLC before and after incubation to estimate the amount of OSCs used by the LAB. After incubation, samples were centrifuged at 5,000 g for 10 min, and 1.5 mL of the supernatant from each sample was collected into a 2-mL centrifuge tube and 300 µL of 24% methaphosphoric acid was added to acidify each sample to allow the volatile fatty acids (VFA) to be vaporized in the gas chromatography (GC) injection port. The samples were kept at room temperature for 24 h to complete the reaction. The samples were then centrifuged (5,000 g for 20 min) and 0.5 mL of supernatant plus 0.5 mL of internal standard (20 mmol, 4-methylvaleric acid) were transferred to a 2-mL glass tube and kept at 4 °C pending analyses. The concentrations of VFA were determined by a gas chromatograph (GC) (Agilent Technologies, USA, Model GC6890) with a flame ionization detector and a fused silica capillary column. Nitrogen was used as the carrier gas. Pure acetic acid (20 mmol), propionic acid (10 mmol), butyric acid (10 mmol), isobutyric acid (10 mmol), valeric acid (10 mmol), isovaleric acid (10 mmol), lactic acid (10 mmol), and succinic acid (10 mmol) (all from Sigma, USA) were used as standard solutions in the detection process by GC (Erwin et al. 1961).
In vivo study
This study was conducted following the guidelines approved by the Universiti Putra Malaysia Institutional Animal Care and Use Committee. The animals’ health and welfare were monitored by a qualified veterinarian who is a member of the research team. Forty-eight 1-day-old male broiler chicks (Cobb 500) were purchased from a commercial breeder farm and kept in battery pens at the Poultry Research Unit of the Department of Animal Science, University Putra Malaysia. The chicks were allocated into two dietary treatments with six replicate pens of four chicks each. The two experimental diets were as follows: i) commercial starter diet (as control) and ii) the same commercial starter diet supplemented with 1% OligoPKC. The composition and nutrient contents of the commercial diet are shown in Appendix B. The chicks were provided free access to clean drinking water and feed. Birds were slaughtered on day 14 of the experiment, and cecum digesta were collected from a total of two birds per replicate to determine the population of total microbes, Lactobacillus, Bifidobacterium, Enterococcus, Enterobacter, and E. coli.
For microbial quantification of cecal samples, DNA was extracted from digesta samples and pure cultures (for standard preparation) using the QIAamp DNA Stool Mini Kit (Qiagen Inc., Valencia, CA) according to the manufacturer’s protocols. The extracted DNA was stored at -20 °C until use. The extracted DNA from pure cultures was used for production of a high concentration of target DNA using the normal PCR and preparation of a standard curve. PCR products were purified using the MEGA quick-spinTM (Intron Biotechnology, Inc, South Korea), and the purity and concentration of DNA in each sample were measured using a Nanodrop ND-1000 spectrophotometer (Thermo Scientific, USA). The number of copies of each template DNA per mL of elution buffer was calculated using the formula known in the art (http://cels.uri.edu/gsc/cndna.html). Standard curves were constructed using serial dilution of PCR products from pure culture of each bacterial group.
Real-time PCR was performed with a BioRad CFX96 Touch (BioRad, USA) using optical grade plates. The PCR reaction was performed on a total volume of 25 µL using the iQTMSYBR Green Supermix (BioRad, BioRad, USA). Each reaction included 12.5 µL of SYBR Green Supermix, 1 µL of each primer (Appendix C), 1 µL of each DNA sample, and 9.5 µL of deionized water. The reaction conditions for amplification of DNA were 94 °C for 5 min, 40 cycles of 94 °C for 20 s, 58 °C (for Lactobacillus) or 60 °C (for Bifidobacterium) or 50 °C (for other target bacteria) for 30 s, and 72 °C for 20 s. To confirm the specificity of amplification, melting curve analysis was carried out after the last cycle of each amplification. The expected sizes of amplified fragments are shown in Appendix C.
Bacterial DNA for standard curves was extracted from the pure cultures. To calculate the amount of DNA in digesta samples, the calibration standards constructed by amplification of known amounts of target DNA were used to convert the Ct values into amounts of DNA. The Ct values for the calibration standards were regressed onto the log 10 of DNA amount, allowing a different equation for each run. The estimated values are expressed as cell number of each target bacteria per gram digesta.
Statistical Analysis
All data analysis of in vitro experiments was conducted using analysis of variance (ANOVA) in SAS software (version 9.2; SAS Institute, Inc, Cary, NC) (2008) with three replicates. The data analysis of in vivo experiments was also carried out using the same procedure with six replicates. For all experiments, the T-test method of SAS 9.2 was used for multiple comparisons between means. Alpha levels of 0.05 and 0.01 were used as the critical levels of significance. Results are expressed as mean ± standard deviation (SD).
RESULTS AND DISCUSSION
Total MSC Contents of PKC and PKC Extracts
Table 1 shows the MSC contents of PKC and various fractions of PKC extract. As the results show, PKC contained approximately 43.43% mannose, which is in agreement with other publications reporting mannose as the main MSC in PKC. According to Mohd-Jafar and Jarvis (1992), the cell wall components of PKC consist of 580 g/kg mannan, 120 g/kg cellulose, and 40 g/kg xylan. More recently, Zhang et al. (2009) extracted up to 488 g D-mannose per kg of PKC. Palm kernel cake also contains 4.71% glucose and galactose and 3.78% xylose. The level of mannose in OligoPKC was 57.32% (Table 1), which is a good justification to suggest that mannan-OSCs are the main OSCs in this product, although the product also contains some glucose, galactose, and xylose.
Table 1. Monosaccharide Contacts of PKC, OligoPKC, Chloroform Extract (Lipids), and Acetonitrile Extract (Proteins)
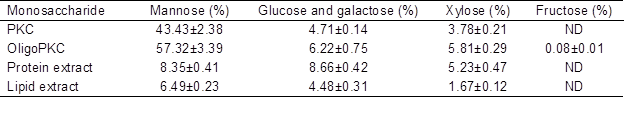
Data are means ± SD of three replicates
ND: not detected
Detection of OSCs
Because the fiber components of PKC are primarily mannose, five pure mannan-OSCs (mannobiose, mannotriose, mannotetraose, mannopentaose, and mannohexaose) were used as standards for the detection of OSCs from the OligoPKC in this study. Based on the clear separation of the different standards (Fig. 1A), it was confirmed that the column and HPLC conditions used in this study were appropriate for the identification of OSCs. The peaks in the chromatogram from the OligoPKC sample are shown in Fig. 1B. Although five of the peaks appeared at near identical retention times to the standards, this may not necessarily indicate that the various OSCs from the sample were mannan-OSCs. That is because, in addition to mannan, the cell wall of PKC also contains glucose, galactose, and xylose. Because it has been well documented that the cell wall components of PKC primarily consist of mannan (Zhang et al. 2009), for the purpose of this study it will be assumed that these peaks represent mannobiose, mannotriose, mannotetraose, mannopentaose, and mannohexaose (Fig. 1B).
In addition to the above-mentioned five peaks, two additional peaks from the OligoPKC sample appeared after the mannohexaose. It is believed that they were OSCs that may be relevant to this study, and we have denoted them as “unknown peaks” (Fig. 1B). As reported earlier, our results show that although the five OSC standards used in this study differed in MW and structures, the peak areas from the injection of similar concentrations of these standards had high similarity and correlation (Appendix D and E). Based on the above observation, it was concluded that the standard curve of any one of the known OSCs can be used for quantification of the unknown peaks. Using the above procedure, the two unknown peaks, which appeared after hexasaccharide (Fig. 1B), are probably heptasaccharide (unknown 1) and octasaccharide (unknown 2).
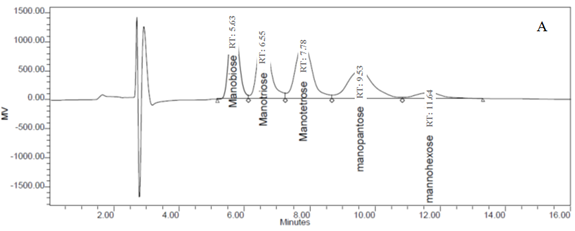
Fig. 1. HPLC chromatograms of (A) five mannan-oligosaccharide standards and (B) PKC extracts. Clear separation of the peaks from the five standards (A) confirmed the conditions used for the HPLC in this study are appropriate for the determination of oligosaccharides. Retention times of the five peaks in the PKC chromatogram (B) matched those of the standard oligosaccharides. Two additional peaks (indicated as unknown peak 1 and 2) that appeared near the 15th and 19th minute seemed to be heptasaccharide and octasaccharide.
Extraction of OligoPKC
Extraction of OSCs of low MW with degrees of polymerization of two to eight from PKC, which have high prebiotic efficacy (Kleessen et al. 2001), was the main objective of this study. A wide range of solvents was used for the extraction of OSCs, including water, ethanol, methanol, and acid. In addition, NDS and ADS, which are primarily used for the determination of lignocellulose in feed (AOAC 1990), were also used as solvents for the extraction. In all these methods, the solid sample was heated in the respective solvent for 1 h. For the two procedures that used NDS and ADS solvents, during heating, all components, except for cellulose, hemicelluloses, and lignin for NDS and cellulose and lignin for ADS, were dissolved in the solvent; thus, some amount of OSCs bonded to the cellulose and lignin molecules are expected to be extracted by the two procedures.
The results clearly showed that the best extraction method for extraction of OSCs from PKC was extraction by NDS (Table 2). The efficiency of (autoclave) extraction using NDS was about three times higher than that using water (shaking). Although it was previously reported that alcohol solutions (Johansen et al. 1996) and water (Knudsen 1986) had high extraction efficiency for OSCs, results of this study did not concur with their findings. Probably the efficiency of solvents for extracting OSCs depends on the kind of material used. In the case of PKC, which is an agricultural byproduct with a high proportion of fiber, the results showed that NDS solution was more effective than the other commonly used solvents. The concentration of MSCs extracted by the NDS method (autoclave) was higher than concentrations of MSCs extracted by other methods, except for extraction by sulfuric acid. This was because of sulfuric acid hydrolyses and breaking down of OSCs into monomers of sugar.
Table 2. Efficiency of Various Solvent Extraction Methods on Yield of Mono- and Oligosaccharides from PKC
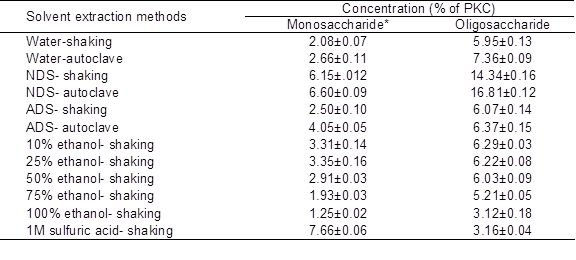
Data are mean ± SD of three replicates.
* Monosaccharides including xylose, mannose, galactose and glucose
Because the NDS-autoclave extraction method produced the highest amount of OSCs, further evaluation of its OSC contents was conducted and compared to that of the water extraction method. The concentrations of total OSCs extracted using water and NDS were 7.36 and 16.81% of PKC (on DM basis), respectively (Table 3). Disaccharides (presumably mostly mannobiose) were the main OSCs in the PKC extracts. The quantity of this component was 2.37% in the water extraction method and increased approximately 4 times to 10.78% in the NDS extraction method.
Table 3. Concentration of Various Fractions of Oligosaccharides in PKC Extracted using Water or NDS (% of DM)
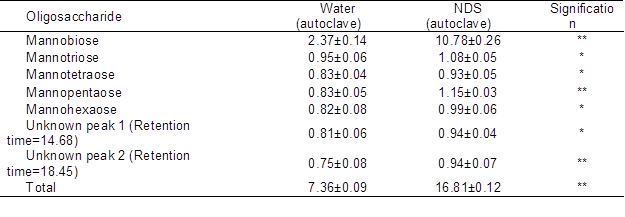
Data are mean ± SD of three replicates
*: (P<0.05) **: (P<0.01)
Although water, which makes up approximately 95% of the NDS solution, serves as a good extraction solvent for low-MW sugars, it is also a potential solvent for hydrophobic components, such as proteins and some amino acids. Precipitation of these hydrophobic components (mostly proteins) in the column of HPLC, when acetonitrile is used in the mobile phase, has been highlighted earlier. Treating the PKC extract solution with acetonitrile to remove the non-OSC components (e.g., proteins), adopted in this study, has been shown to be effective for increasing the purity of the final OSC extract (Table 4).
Table 4. Concentrations of Oligosaccharides in the OligoPKC Before and After Removing the Protein and Fat
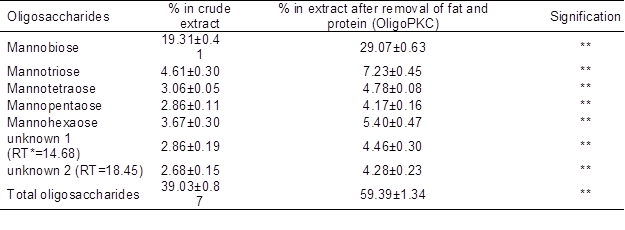
Data are mean ± SD of three replicates; *: (P<0.01)
Acetonitrile has been reported to effectively remove (up to 98%) proteins with MWs larger than 15 kDa (Alpert and Shukla 2003). Thus, it may help to remove some OSC hydrolyzing enzymes such as alpha-amylase (51 to 54 kDa) and alpha-galactosidase, which might be present in the PKC extract. It will keep the OSCs from further converting into smaller monomers. Without removing these enzymes from the solvent, the concentrations of OSCs may be reduced or altered.
Fatty acids and oil are other non-OSC components in PKC. Their concentrations in PKC varied depending on the kernel oil extraction methods. In this study, these impurities were removed using chloroform/methanol solution (Ninonuevo et al. 2006). The concentrations of OSCs in the OligoPKC before and after removal of protein and fatty acids are shown in Table 4, which indicates an increase of more than 20% in the level of OSCs (from 39.03% to 59.39%) after treatment.
Degree of Polymerization
An oligosaccharide standard and seven purified fractions of OligoPKC were injected into the HPLC to determine DP, and results are shown in Fig. 2. In the DP analysis using HPLC and REZEX RSO-oligosaccharide column (Phenomenex, Torrence, USA), components with higher DP have shorter retention time (Jurková et al. 2014). This contrasts with the HPLC quantification method in the earlier step of the present study, in which larger DPs were detected in HPLC with longer retention times (Fig. 1).
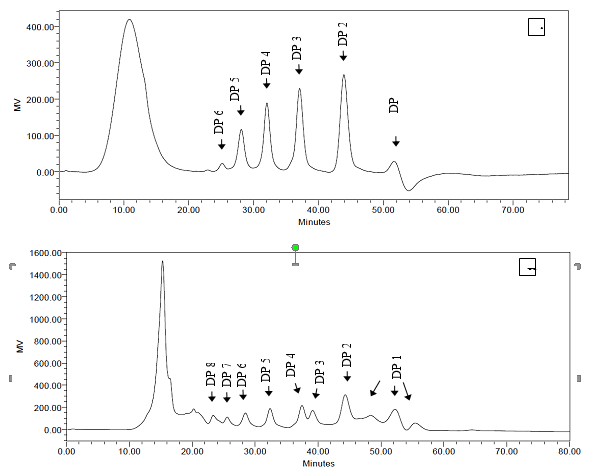
Fig. 2. Degree of polymerization of (A) oligosaccharide standards and (B) purified fractions of OligoPKC. In Fig. A: DP 1: mannose; DP 2: mannobiose; DP 3: mannotriose; DP 4: mannotetraose; DP5: mannopentaose; DP6: mannohexaose. In Fig. B: DP 1: monosaccharide; DP 2: disaccharide; DP 3: trisaccharide; DP 4: tetrasaccharide; DP 5: pentasaccharide; DP 6: hexasaccharide; DP 7: heptasaccharide; DP 8: octasaccharide.
Figure 2A clearly shows the separation of all five OSC standards, including mannobiose, mannotriose, mannotetraose, mannopentaose, and mannohexaose, with DPs of two to six, respectively. In Fig. 2A, DP one belongs to mannose, which is an ingredient of OSC standards. The degree of polymerization of the seven fractions of OligoPKC is shown in Fig. 2B, with DP from two to eight, supporting the hypothesis that they are OSCs, including disaccharide (DP=2), trisaccharide (DP=3), tetrasaccharide (DP=4), heptasaccharide (DP=5), hexasaccharide (DP=6), heptasaccharide (DP=7), and octasaccharide (DP=8).
Molecular Weights of Various Components of OSCs
The basic function of LC/MS is to determine the mass-to-charge ratio (m/z) of any charged compounds, with m representing the ion mass measured in Daltons (Da) and z representing the number of elementary charges (Højer-Pedersen et al. 2008). Numerically, the mass-to-charge ratio equals the MW of the compound (Mann et al. 1989). Table 5 shows the MW of the seven components (five known OSCs plus two unknowns OSCs) collected using the HPLC fraction-collector, which are compared to the known MW of the standards. The LC/MS system was calibrated using a calibration solution (ESI–TOF reference mass solution, Agilent), which provided m/z of 112.9855 and 1033.9881 in positive mode, and the output data of the study were 112.9857 and 1033.9879, respectively, confirming the accuracy of the system. Although the observed MW values of the different fractions from the OligoPKC were not identical, they were very close to the known MW of the respective OSCs with two to eight units of monomers. It is beyond this study to explain the minor differences between the observed MW of the test materials and the actual MW of the mannan-OSC standards. However, in the present study, it was assumed that the variations in the MW were due to hydrolysis or addition of active ions to the OSC molecules. For example, the observed MW of 377.09 vs. the calculated MW of 342.30 for disaccharide could be due to the addition of one negatively charged Cl– ion (MW: 35.45) to the molecule; as suggested by Guan (2007), Cl–, Br–, I– and NO3– anionic adducts consistently appear in higher abundances relative to [M – H]–. Hence, OSCs have large variation in the MW because of the differentiating of linkage positions, chains, and anionic adducts (Guan 2007).
Table 5. Molecular Weight (or Mass:Charge Ratio) of Monosaccharide and Various Oligosaccharide Fractions of OligoPKC.
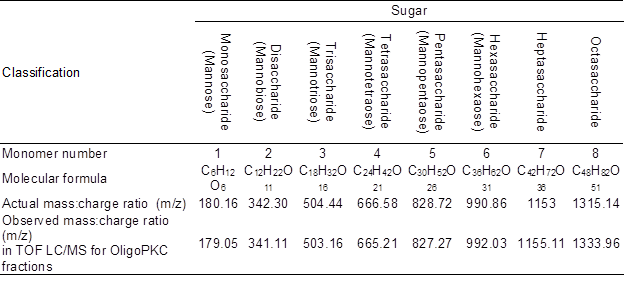
Results of the LC/MC study suggested that the two unknown peaks appearing after hexasaccharide in the HPLC chromatograph seem to be heptasaccharide (unknown 1) and octasaccharide (unknown 2).
In the present study, nuclear magnetic resonance (NMR) was used to investigate the molecular structure of OSCs in the OligoPKC. Although the individual peaks from HPLC were purified using a fraction collector, the results of NMR spectrum were not clear with respect to the molecular structure of this product. One possibility is that a mixture of different molecules of OSCs with the same MW but different monomer content was present in each fraction. Our hypothesis is that the OSCs of OligoPKC primarily contained mannan, and also some molecules of glucose, xylose, galactose, and fructose. In this condition, an individual fraction (peak) in the HPLC chromatogram of OligoPKC can be a mixture of OSCs with almost the same MW, but different MSC contents.
Hydrolysis of OSCs in OligoPKC using Pure Enzymes
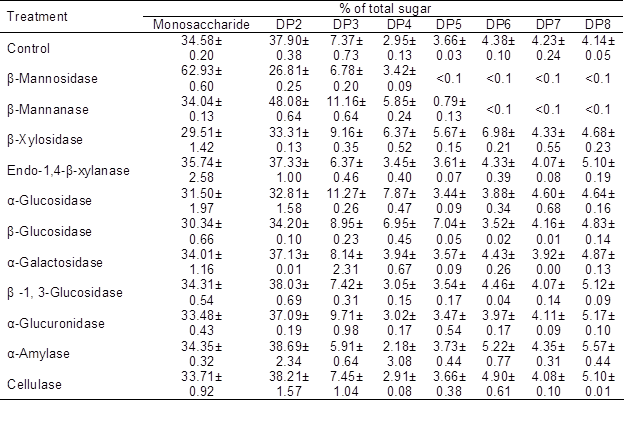
In the present study, 11 important carbohydrate hydrolysis enzymes were used to hydrolyze the OSCs of OligoPKC. The results are presented in Table 6, which clearly shows that two important mannan hydrolysis enzymes, β-mannosidase and β-mannanase, had the highest effect on OSCs in OligoPKC. According to the results, almost all OSCs with DPs of five to eight disappeared from hydrolyzed samples, and the level of MSCs (with β-mannosidase treatment) and DP2 (with β-mannanase treatment) increased.
Table 6. Effect of Carbohydrate Hydrolysis Enzymes on Degradation of Oligosaccharides of OligoPKC
Data are means ±SD of three replicates
The results of this study also showed that the other nine hydrolysis enzymes had only minor effects on OSCs in the OligoPKC. These results are a strong confirmation of the fact that mannans are the main OSCs in the PKC and OligoPKC.
β-Mannosidase catalyzes the hydrolysis of terminal, non-reducing β-D-mannose residues in β-D-mannosides. In this condition, the end product of the reaction is one mannose molecule and one OSC molecule. This is the reason for the marked increase in the level of MSCs after treatment of OligoPKC by β-mannosidase, without any change in the level of OSCs. β-Mannanase catalyzes the random hydrolysis of 1,4-β-D-mannosidic linkages in mannans, galactomannans, and glucomannans, so the end product of the reaction can be two molecules of PSC or one oligomer plus one monomer. This is the reason for the noticeably reduced level of DP5 to DP8 and increased level of DP2 to DP4 in the end product after treatment of OligoPKC by β-mannanase (Table 6).
Efficacy of OligoPKC as Prebiotic
In vitro study
Although NDS was the best solvent for the extraction of OSCs in PKC, the chemical residue in the extract may have adverse effects on microbial growth; therefore, the water-extracted OligoPKC was used for the investigation of its prebiotic efficacy in this study. To evaluate its prebiotic effect, OligoPKC was used as substrate for growth of four Lactobacillus species (L. farraginis, L. pentosus, L. brevis, and L. acidipiscis). The growth of the above-mentioned LAB in the MRS and OligoPKC is shown in Fig. 3. Although growth of the LAB in the OligoPKC media was lower than that in MRS (a standard growth medium containing all the essential nutrients for the LAB), all four LAB species showed acceptable growth in the OSC media. The highest growth rate in OligoPKC was recorded for L. pentosus, followed by L. farraginis, L. acidipiscis, and L. brevis.
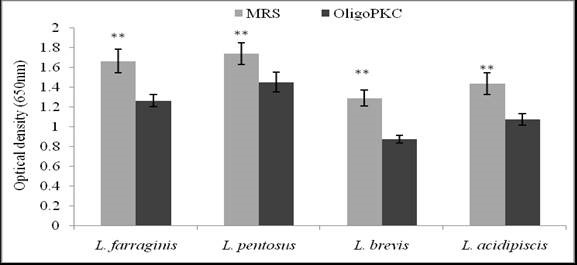
Fig. 3. Growth rate of Lactobacillus strains in MRS and OligoPKC media (**: P<0.01). Although growth of the Lactobacillus strains in the OligoPKC media was lower than those in MRS, all the four LAB species showed acceptable growth in the OligoPKC media, with the highest growth rate recorded for L. pentosus.
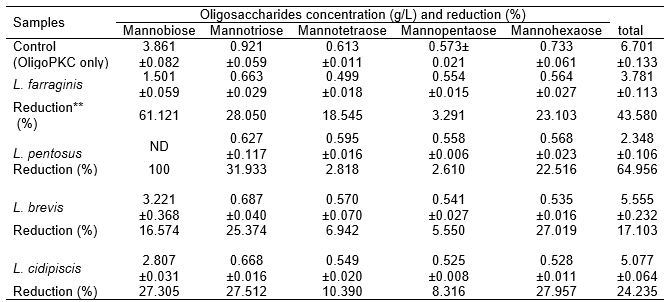
To study the preference of the various LAB for the various fractions of OligoPKC, the concentrations of the various fractions of OSCs in the OligoPKC medium before and after culturing of the LAB were determined. The results (Table 7) showed that i) OSCs with lower MW (mannobiose and mannotriose) were more readily utilized than those with higher MW. For example, L. pentosus completely used up all the mannobiose, followed by 61.12% reduction in mannobiose in the L. farraginis culture; ii) mannotriose and mannopentaose were poorly used by all the LAB strains; and iii) the reduction (between 23% and 28%) of the mannohexaose before and after culturing of LAB could be due to the fact that mannohexaose was hydrolyzed to mannopentaose and/or mannotriose. Based on this information, it was believed that the two unknown components, which appeared in the HPLC chromatograph and were later identified as heptasaccharide and octasaccharide, would not serve as effective prebiotics unless they were hydrolyzed to OSCs of smaller MW.
The results concurred with a report by Gibson (2004), in which intestinal microflora could ferment OSCs with smaller MW better than those with larger MW. Roberfroid et al. (1998) demonstrated that, based on average, inulin chains with DP > 10 are fermented at half the rate of oligofructose with DP < 10. “Short-chain” OSC prebiotics containing two to eight links per molecule (e.g., oligofructose) are typically fermented more quickly in the large intestine, providing nourishment to the bacteria in that area (Kleessen et al. 2001), and have better antimicrobial activity (Hirano and Nagao 1989), while “longer-chain” OSC prebiotics containing nine to 64 links per molecule (e.g., inulin) tend to be fermented more slowly, nourishing bacteria predominantly in the left-side colon (Kleessen et al. 2001).
Table 7. The Ability of Lactobacillus Strains to Utilize the Various Oligosaccharides of OligoPKC and the Reduction of These Components as Compared to the Medium without Lactobacillus Strains (Control)
Data are mean ± SD of three replicates
** Reduction is presented as percentage of initial contents of oligosaccharide
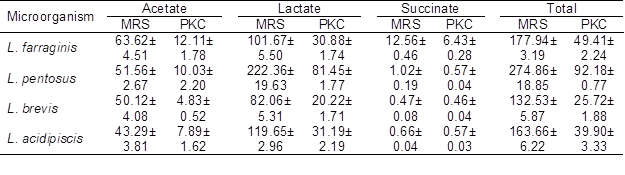
One of the most important characteristics of LAB as potential probiotics is their ability to produce organic acids, primarily lactate and acetate (Shokryazdan et al. 2014). The abilities of the four strains of LAB to produce acetate, lactate, and succinate in the MRS and the OligoPKC media are shown in Table 8. Combining the growth rate, OSC utilization, and fatty acids production data of the four LAB, the results suggest that L. pentosus was the most prolific strain among the four tested LAB in the OligoPKC medium.
Table 8. Comparative Production of Acetate, Lactate and Succinate in MRS and OligoPKC Broth (mmol)
Data are means ±SD of three replicates
In vivo study
The effect of OligoPKC on microbial populations in the cecal contents of the chickens was studied to reaffirm the results of in vitro study of prebiotic efficacy of OligoPKC. Supplementing OligoPKC at 1 g/kg of the diet of broilers increased the populations of beneficial Lactobacillus, Bifidobacterium (P < 0.01), and Enterococcus (P < 0.05), but suppressed the populations of pathogenic E. coli and Enterobacter (P < 0.01) in the cecum of chickens (Table 9).
Table 9. Effect of OligoPKC Supplementation on Microbial Population of Chicken Digesta (cells/g digesta)
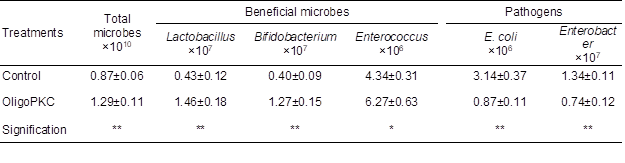
Data are means ±SD of six replicates
*: (P<0.05)
**: (P<0.01)
Oligosaccharides are non-digested feed ingredients and cannot be absorbed by animals. These materials escape gastric digestion and intactly reach the large intestine, where the OSCs are fermented by different species of microorganisms, especially common probiotics, such as Lactobacillus and Bifidobacterium, providing beneficial effects to the host through the production of short chain fatty acids, such as lactic, acetic, and succinic acids (Fooks and Gibson 2002). These acids, in turn, provide an acidic environment in the intestine making it unfavorable for the gram negative pathogenic bacteria, such as E. coli, Salmonella and Enterobacter. The in vitro results of the present study clearly showed the ability of the four LAB strains to produce short chin fatty acids (Table 8). Besides, results of the in vivo experiment showed that the OligoPKC improved the balance of cecal microbiota by suppressing the populations of pathogens and enhancing those of the LAB. This is expected to improve immunological, digestive and nutrient absorption capacity of the hosts (Sun et al. 2010).
CONCLUSIONS
- Results of the present study showed that PKC contains a high level of OSCs, of which mannans are the main form. The HPLC analysis, DP study, MW determination, and enzymatic hydrolysis confirmed this finding.
- The combined results of the in vitro and in vivo experiments strongly confirmed the prebiotic efficacy of OligoPKC. The prebiotic effects of OligoPKC comes mainly from the OSCs with lower MW (mannobiose and mannotriose), which can be effectively extracted from PKC using the NDS extraction protocol suggested in this study.
CONFLICT OF INTEREST
The authors declare that there is no conflict of interest with respect to the research, authorship, and/or publication of this article.
ACKNOWLEDGMENT
The present study was supported by the Ministry of Higher Education Malaysia under the LRGS Fasa 1/2012 grant UPM/700-1/3/LRGS grant.
REFERENCES CITED
Allen, V., Fernandez, F., and Hinton, M. (1997). “Evaluation of the influence of supplementing the diet with mannose or palm kernel meal on salmonella colonisation in poultry,” Br. Pult. Sci. 38(5), 485-488.
Alpert, A., and Shukla, A. (2003). “Precipitation of large, high-abundance proteins from serum with organic solvents,” ABRF 2003: Translating Biology using Proteomics and Functional Genomics.
AOAC (1990). Official Methods of Analysis, Association of Official Analytical Chemists, Washington, DC.
Carlsson, N. G., Karlsson, H., and Sandberg, A. S. (1992). “Determination of oligosaccharides in foods, diets, and intestinal contents by high-temperature gas chromatography and gas chromatography/mass spectrometry,” J. Agr. Food Chem. 40(12), 2404-2412.
Erwin, E., Marco, G., and Emery, E. (1961). “Volatile fatty acid analysis of blood and rumen fluid by gas chromatography,” J. Dairy Sci. 44, 1768-1771.
Fernandez, F., Hinton, M., and Gils, B. V. (2002). “Dietary mannan-oligosaccharides and their effect on chicken caecal microflora in relation to Salmonella enteritidis colonization,” Avian Pathol. 31(1), 49-58.
Fernandez, F., Hinton, M., and Van Gils, B. (2000). “Evaluation of the effect of mannan-oligosaccharides on the competitive exclusion of Salmonella enteritidis colonization in broiler chicks,” Avian Pathol. 29(6), 575-581.
Fooks, L. J., and Gibson, G. R. (2002). “In vitro investigations of the effect of probiotics and prebiotics on selected human intestinal pathogens,” FEMS Microbiol. Ecol. 39(1), 67-75.
Gibson, G. R. (2004). “Fibre and effects on probiotics (the prebiotic concept),” Clin. Nutr. 1(2), 25-31.
Gibson, G. R., and Rastall, R. A. (2006). Prebiotics: Development & Application, John Wiley & Sons.
Gibson, G. R., and Roberfroid, M. B. (1995). “Dietary modulation of the colonic microbiota: introducing the concept of prebiotics,” J. Nutr. 125(1401-1412.
Guan, B. (2007). “Characterization of oligosaccharides and nanoparticles by MALDI-TOF mass spectrometry,” PhD. University of New Orleans Theses and Dissertations. New Orleans, pp. 585.
Helrich, K., and AOAC (1990). Official Methods of Analysis of the Association of Official Analytical Chemists, Arlington, VA: The Association.
Hirano, S., and Nagao, N. (1989). “Effects of chitosan, pectic acid, lysozyme, and chitinase on the growth of several phytopathogens (Biological Chemistry),” Agr. Biol. Chem. Tokyo 53(11), 3065-3066.
Højer-Pedersen, J. J., Nielsen, J., and Smedsgaard, J. (2008). “Metabolome analysis-mass spectrometry and microbial primary metabolites,” Technical University of Denmark, National Food Institute, Division of Food Chemistry.
Ito, H., Takemura, N., Sonoyama, K., Kawagishi, H., Topping, D. L., Conlon, M. A., and Morita, T. (2011). “Degree of polymerization of inulin-type fructans differentially affects number of lactic acid bacteria, intestinal immune functions, and immunoglobulin A secretion in the rat cecum,” J. Agr. Food Chem. 59(10), 5771-5778.
Johansen, H. N., Glitsø, V., and Bach Knudsen, K. E. (1996). “Influence of extraction solvent and temperature on the quantitative determination of oligosaccharides from plant materials by high-performance liquid chromatography,” J. Agr. Food Chem. 44(6), 1470-1474.
Jurková, M., Čejka, P., Štěrba, K., and Olšovská, J. (2014). “Determination of total carbohydrate content in beer using its pre-column enzymatic cleavage and HPLC-RI,” Food Anal. Method 7(8), 1677-1686.
Kim, S., Kim, W., and Hwang, I. K. (2003). “Optimization of the extraction and purification of oligosaccharides from defatted soybean meal,” Int. J. Food Sci. Tech. 38(3), 337-342.
Kleessen, B., Hartmann, L., and Blaut, M. (2001). “Oligofructose and long-chain inulin: influence on the gut microbial ecology of rats associated with a human faecal flora,” Brit. J. Nutr. 86(02), 291-300.
Knudsen, I. M. (1986). “High‐performance liquid chromatographic determination of oligosaccharides in leguminous seeds,” J. Sci. Food Agr. 37(6), 560-566.
Manderson, K., Pinart, M., Tuohy, K., Grace, W., Hotchkiss, A., Widmer, W., Yadhav, M., Gibson, G., and Rastall, R. (2005). “In vitro determination of prebiotic properties of oligosaccharides derived from an orange juice manufacturing by-product stream,” Appl. Environ. Microbiol. 71(12), 8383-8389.
Mann, M., Meng, C. K., and Fenn, J. B. (1989). “Interpreting mass spectra of multiply charged ions,” Anal. Chem. 61(15), 1702-1708.
Mohd-Jaafar, D., and Jarvis, M. (1992). “Mannan of palm kernel,” Phytochemistry 31(2), 463-464.
Ninonuevo, M. R., Park, Y., Yin, H., Zhang, J., Ward, R. E., Clowers, B. H., German, J. B., Freeman, S. L., Killeen, K., and Grimm, R. (2006). “A strategy for annotating the human milk glycome,” J. Agr. Food Chem. 54(20), 7471-7480.
Pineiro, M., Asp, N. G., Reid, G., Macfarlane, S., Morelli, L., Brunser, O., and Tuohy, K. (2008). “FAO Technical meeting on prebiotics,” J. Clin. Gastroenterol. 42, 156-159.
Roberfroid, M. B., Van Loo, J. A., and Gibson, G. R. (1998). “The bifidogenic nature of chicory inulin and its hydrolysis products,” J. Nutr. 128(1), 11-19.
SAS (2008). SAS Institute Inc., 2008. SAS OnlineDoc 9.2. SAS Institute Inc., Cary, NC.
Shokryazdan, P., Sieo, C. C., Kalavathy, R., Liang, J. B., Alitheen, N. B., Faseleh Jahromi, M., and Ho, Y. W. (2014). “Probiotic potential of lactobacillus strains with antimicrobial activity against some human pathogenic strains,” Biomed Res. Int. 2014.
Sun, Y.-Z., Yang, H.-L., Ma, R.-L., and Lin, W.-Y. (2010). “Probiotic applications of two dominant gut Bacillus strains with antagonistic activity improved the growth performance and immune responses of grouper Epinephelus coioides,” Fish Shellfish Immunol. 29(5), 803-809.
Szambelan, K., and Nowak, J. (2006). “Acid and enzymatic hydrolysis of Jerusalem artichoke (Helianthus tuberosus L.) tubers for further ethanol production,” Electron. J. Pol. Agric. Univ. 9(4).
Yusrizal, Y., Angel, R., Adrizal, A., Wanto, B., Fakhri, S., and Yatno, Y. (2013). “Feeding native laying hens diets containing palm kernel meal with or without enzyme supplementations. 2. Excreta nitrogen, ammonia, and microbial counts,” J. Appl. Poult. Res. 22(2), 269-278.
Zhang, T., Pan, Z., Qian, C., and Chen, X. (2009). “Isolation and purification of d-mannose from palm kernel,” Carbohyd. Res. 344(13), 1687-1689.
Article submitted: September 13, 2015; Peer review completed: November 1, 2015; Revised version received and accepted: November 2, 2015; Published: November 25, 2015.
DOI: 10.15376/biores.11.1.674-695
APPENDICES
Appendix A. Enzymes used for Hydrolysis of Oligosaccharides in PKC Samples
| Enzyme | EC No. | Source | Biological function | |
| 1 |
β-Mannosidase |
3.2.1.25 |
Cellvibrio mixtus |
Catalyses the hydrolysis of terminal, non-reducing β-D-mannose residues in β-D-mannosides |
| 2 | Cellulase | 3.2.1.4 | Cellvibrio mixtus ATCC 12120 | Catalyses the endohydrolysis of (1→4)-β-D-glucosidic linkages in cellulose, lichenin and cereal β-D-glucans |
| 3 |
β-Mannanase |
3.2.1.78 | Clostridium thermocellum YS | Catalyses the random hydrolysis of 1,4-β-D-mannosidic linkages in mannans, galactomannans and glucomannans |
| 4 | Endo-1,4-β-xylanase
|
3.2.1.8 | Clostridium thermocellum F1/YS | Catalyses the endohydrolysis of (1→4)-β-D-xylosidic linkages in xylans |
| 5 |
α-Galactosidase
|
3.2.1.22 | Clostridium cellulolyticum H10 | Hydrolysis of terminal, non-reducing α-D-galactose residues in α-D-galactosides, including galactose oligosaccharides and galactomannans |
| 6 | β -1, 3-Glucosidase | 3.2.1.39 | Clostridium thermocellum ATCC 27405 | Catalyses the hydrolysis of (1→3)-β-D-glucosidic linkages in (1→3)-β-D-glucans |
| 7 |
β-Glucosidase |
3.2.1.21 | Rhizobium etli CFN 42 | Hydrolysis of terminal, non-reducing β-D-glucosyl residues with release of β-D-glucose |
| 8 |
α-Glucuronidase |
3.2.1.139 | Cellvibrio japonicus NCIMB 10462 | Catalyses the release of 4-O-methyl-D-glucuronic acid from 4-O-methyl-D-glucuronoxylooligosaccharides but not from 4-O-methyl-D-glucuronoxylan |
| 9 |
α-Glucosidase
|
3.2.1.20 | Escherichia coli str. K-12 substr. W3110 | Hydrolysis of terminal, non-reducing (1→4)-linked α-D-glucose residues with release of α-D-glucose |
| 10 |
α-Amylase |
3.2.1.1
|
Bacillus subtilis subsp. subtilis str. 168 | Endohydrolysis of (1→4)-α-D-glucosidic linkages in polysaccharides containing three or more (1→4)-α-linked D-glucose units |
| 11 |
β-Xylosidase |
3.2.1.37 | Lactobacillus brevis ATCC 367 | Catalyses the hydrolysis of (1→4)-β-D-xylans, to remove successive D-xylose residues from the non-reducing termini. This enzyme also hydrolyses xylobiose and xylooligosaccharides |
http://www.prozomix.com/
Appendix B. Composition of the Basal Diet
| Ingredient | Amounts (g/kg unless otherwise stated) |
| Ground yellow corn | 538.9 |
| Soybean meal | 361.9 |
| Fish meal | 30.0 |
| Palm oil | 37.4 |
| 60% choline chloride | 2.5 |
| Trimix1 | 1.0 |
| Salt (NaCl) | 2.0 |
| DL-methionine | 1.8 |
| Limestone | 13.0 |
| Dicalcium phosphate | 11.5 |
| Total | 1000.0 |
| Calculated analysis (g/kg except energy) | |
| Crude protein | 220.0 |
| Crude fat | 63.1 |
| Crude fibre | 38.0 |
| Calcium | 10.2 |
| Phosphorus | 4.5 |
| Metabolisable energy (MJ/kg) | 13.06 |
1Trimix (per kg Trimix): iron 100 g; manganese 110 g; copper 20 g; zinc 100 g; iodine 2 g; selenite 0.2 g; cobalt 0.6 g; santoquin 0.6 g; folic acid 0.33 g; thiamin 0.83 g; pyridoxine 1.33 g; biotin 2 % 0.03 g; riboflavin 2 g; cyanocobalamin 0.03 g; D-calcium pantothenate 3.75 g; niacin 23.3 g; retinol 2000 mg; cholecalciferol 25 mg; α-tocopherol 23,000 mg IU.
Appendix C. Primer Used in Real-time PCR
| Microorganism | Primer | size of amplified fragments (bp) | Annealing temperature (ºC) |
| Total Microbes | F-5′-CGGCAACGAGCGCAACCC-3′
R-5′-CCATTGTAGCACGTGTGTAGCC-3′ |
145 | 55 |
| Lactobacillus | F-5′-CATCCAGTGCAAACCTAAGAG-3′
R-5′-GATCCGCTTGCCTTCGCA-3′ |
341 | 58 |
| Enterococcus genus | F-5′-CCCTTATTGTTAGTTGCCATCATT-3′
R-5′-ACTCGTTGTACTTCCCATTGT-3′ |
144 | 50 |
| Bifidobacterium | F-5′- GGGTGGTAATGCCGGATG-3′
R-5′- TAAGCCATGGACTTTCACACC-3′ |
440 | 60 |
| Escherichia coli | F-5′-GTGTGATATCTACCCGCTTCGC-3′
R-5′-AGAACGCTTTGTGGTTAATCAGGA-3′ |
82 | 50 |
| Enterobacter | F- 5′-CAT TGACGTTACCCGCAGAAGAAGC-3′
R-5′-CTCTACGAGACTCAAGCTTGC-3′ |
195 | 50 |
Appendix D. Peak Areas of Oligosaccharides Standards in Various Concentrations of Injection
| Oligosaccharides
concentration (%) |
Peak areas output from HPLC | |||||
| Mannobiose | Mannotriose | Mannotetraose | Mannopentaose | Mannohexaose | ||
| 0.0625 | 163724 | 168927 | 156533 | 144031 | 145143 | |
| 0.1250 | 733868 | 738822 | 723878 | 627930 | 713949 | |
| 0.1875 | 1345506 | 1390509 | 1355051 | 1262814 | 1383652 | |
| 0.2500 | 1961218 | 1986459 | 1857533 | 1704468 | 1855078 | |
| 0.3125 | 2536610 | 2610380 | 2438512 | 2197484 | 2256781 | |
Appendix E. Correlations Between Peak Areas of Various Oligosaccharides Standards in Different Concentration in the Injection
| Oligosaccharides | Mannobiose | Mannotriose | Mannotetraose | Mannopentaose | Mannohexaose |
| Mannobiose | 1 | ||||
| Mannotriose | 0.9999 | 1 | |||
| Mannotetraose | 0.9996 | 0.9996 | 1 | ||
| Mannopentaose | 0.9986 | 0.9989 | 0.9995 | 1 | |
| Mannohexaose | 0.9957 | 0.9955 | 0.9971 | 0.9983 | 1 |