
Abstract
An eco-friendly time indicator (TI) was developed using cellulose-based materials. The TI comprises a dye, copy paper, nanofibrillated cellulose (NFC) film, and filter papers coated with NFC slurry and/or paraffin-free biowax. A suitable dye and its conditions were determined by observing the dye solutions and the migration pattern at the different concentrations. Commercial filter papers were prepared, and the dye migration rate, depending on physical properties, was evaluated. NFC was coated to control the dye migration rate of filter paper. In addition, biowax was used to impart hydrophobicity to filter papers used for supporting NFC films, storing the dye, and allowing the migration of dye. Finally, a TI was fabricated using those components. Methylene blue was selected as a dye for the TI due to its deep color and high solubility. The results showed that the key property of filter paper affecting the dye migration rate was the pore size. The migration rate could be reduced when NFC was coated on both sides of the filter paper. Since biowax modified the hydrophobicity of filter paper surface, it was used to make the NFC film-supporting paper, location for dye storage, and bottom-layer. In conclusion, a multilayered TI could be assembled using cellulose-based materials.
Download PDF
Full Article
Fabrication of Eco-friendly Time Indicator Using Cellulose-Based Materials
Hae Min Jo,a Yeon Hui Lee,a and Ji Young Lee b,*
An eco-friendly time indicator (TI) was developed using cellulose-based materials. The TI comprises a dye, copy paper, nanofibrillated cellulose (NFC) film, and filter papers coated with NFC slurry and/or paraffin-free biowax. A suitable dye and its conditions were determined by observing the dye solutions and the migration pattern at the different concentrations. Commercial filter papers were prepared, and the dye migration rate, depending on physical properties, was evaluated. NFC was coated to control the dye migration rate of filter paper. In addition, biowax was used to impart hydrophobicity to filter papers used for supporting NFC films, storing the dye, and allowing the migration of dye. Finally, a TI was fabricated using those components. Methylene blue was selected as a dye for the TI due to its deep color and high solubility. The results showed that the key property of filter paper affecting the dye migration rate was the pore size. The migration rate could be reduced when NFC was coated on both sides of the filter paper. Since biowax modified the hydrophobicity of filter paper surface, it was used to make the NFC film-supporting paper, location for dye storage, and bottom-layer. In conclusion, a multilayered TI could be assembled using cellulose-based materials.
DOI: 10.15376/biores.17.1.1120-1135
Keywords: Intelligent packaging; Time indicator (TI); Cellulose-based material; Paper; Cellulose nanofiber; Biowax
Contact information: a: Department of Forest Products; b: Department of Environmental Materials Science/IALS, Gyeongsang National University, Jinju 52828, Republic of Korea;
* Corresponding author: paperyjy@gnu.ac.kr
GRAPHICAL ABSTRACT
INTRODUCTION
As the demand for food safety and home delivery increases, the packaging market is growing, and related packaging technologies are being developed (Arunan and Crawford 2021). Interest in smart packaging technology, which is evaluated as the next-generation packaging technology, is increasing. Smart packaging encompasses active and intelligent packaging (Bambang et al. 2020). Active packaging technology preserves product quality and maintains freshness, while intelligent packaging technology provides products through intelligent functions such as detection, recording, and tracking (Rukchon et al. 2014). It monitors the status of the product or provides information according to the storage environment to the consumer (Puligundla et al. 2012; Dodero et al. 2021; Rodrigure et al. 2021).
Intelligent packaging technology includes devices such as pH sensors (Ding et al. 2020; Lu et al. 2020; Alizadeh-Sani et al. 2021), gas indicators (Zhai et al. 2020), and biosensors (Park et al. 2015) that detect changes in a product state, and time-temperature indicators (TTI) that provide information according to changes in time and temperature (Guiavarc’h et al. 2004). The pH sensor can react to volatile basic nitrogen such as ammonia and amine groups generated during food storage, and the gas indicator is affected by carbon dioxide and ethylene gas (Hu et al. 2016). These sensors work inside the packaging and can provide consumers with information about changes in the condition of the product. However, unlike the freshness sensor, which shows color changes under the influence of the type of gas or the surrounding environment, such as humidity, the time indicator (TI) or TTI is used to check the progress of distribution time; therefore, it does not need to be positioned inside the packaging box.
The TTI can be classified as a chemical, biological, or physical TTI according to its operating principle (Guiavarc’h et al. 2004; Jafry et al. 2017). A physical TTI provides information using the absorption pattern of fluid (fluid flow), according to the properties of the material. Among physical TTIs, a diffusion-based TTI can monitor the distance traveled by the absorption of a mobile-phase fluid into a porous matrix, which is a stationary phase (Kim et al. 2016; Firouz et al. 2021). Several studies are underway to develop TTI devices using this diffusion-based principle, and 3M’s Mark and Timestrip are examples of commercialized diffusion-based TTI. However, most of the materials used to manufacture diffusion-based TTI are made of synthetic high-branch-based plastic materials such as polyester and polyethylene terephthalate (PET); thus, their recyclability is poor. It is necessary to develop TTI manufacturing technology using eco-friendly materials.
Cellulose is an eco-friendly and biocompatible natural material (Chen et al. 2021). When cellulose-based paper is used as a porous matrix for diffusion-based TTI production, the fluid can move by capillary flow; thus, it does not require an external pump (Park et al. 2006; Jafry et al. 2017) and it is easy to operate. Because the paper has excellent flexibility, it can be attached to various packaging materials. It is recyclable, and thus, it is a useful material for the manufacture of eco-friendly indicators because of its high eco-friendliness (Carstens et al. 2017). However, because cellulose-based paper material has high hydrophilicity, a hydrophobization method must be applied for diffusion-based TTI production, and dimensional stability due to heat is low, which limits its use as an indicator that can reflect temperature. Therefore, when a cellulose-based material is used, it is possible to manufacture a diffusion-based TI rather than a TTI, and the development of various element technologies for manufacturing TI is required.
In this study, a multilayered TI technology was developed using a dye, copy paper, filter papers, cellulose nanofiber (NFC), and biowax. A dye with high visibility of TI was selected, and a NFC film was manufactured. A surface coating technology with NFC and/or biowax was derived for stable diffusion of the dye, and these element technologies were applied to complete an eco-friendly TI.
EXPERIMENTAL
Materials
Methyl red (JUNSEI, Osaka, Japan), methylene blue (Sigma Aldrich, St. Louis, MO, USA), and bromothymol blue (Sigma Aldrich) were used to select a suitable dye for manufacturing a TI. All three types of dyes were in powder form, and an appropriate solvent was selected according to the dye (Table 1). A biowax emulsion (Topscreen Bw200, SOLENIS, Gimcheon, Korea) was used as a coating agent for imparting hydrophobicity to the filter papers.
Five commercial filter papers with different properties were used as a porous paper matrix, which is the stationary phase in a time sensor. The specifications of the filter papers are shown in Table 2. The bleached hardwood kraft pulp (HwBKP), supplied by Moorim Paper (Jinju, Republic of Korea), was used to make the nanofibrillated cellulose (NFC) in a laboratory. A copy paper, with a basis weight of 75 g/m2, supplied by Hankuk Paper (Ulsan, Republic of Korea), was used as a cover of a TI. A glue stick (GSW22, AMOS, Hwaseong, Republic of Korea) was used to bond each component of TI.
Table 1. Specifications of Chemicals

Table 2. Specifications of Commercial Filter Paper

Methods
Dye selection for manufacturing a TI
Methyl red, bromothymol blue, and methylene blue were dissolved in ethanol and water, respectively, and the color change was investigated. Because the sensor could be identified with the naked eye, three types of dyes were tested according to the concentration to investigate a condition with a clear color development at 20 °C. The dilution concentration was adjusted to 0.025%, 0.25%, 1.00%, and 4.00%, and then the dye solutions were stirred using a magnetic stirrer for at least 1 h so that no residue was left. Next, 20 mL of each concentration of the prepared dyes was placed in a petri dish, and the prepared filter papers with a size of 0.5 cm × 5.0 cm were placed vertically to analyze the dye migration pattern and color expression of each dye. At this time, filter paper No. 4, with the largest pore size, and filter paper No. 5, with the smallest pore size, were used to check the difference in the dye migration pattern, depending on the physical properties of the filter paper.
Evaluation of dye migration rate of filter paper
The effect of the physical properties of the filter paper on the dye migration rate was evaluated. The migration distance and time the dye moves in 5 types of filter papers, prepared in a thin- and long-form by cutting them to 3 and 80 mm in width and length, respectively, were measured. The dye was used in the experiment after filling 0.6 mL of a small cylindrical tube with a diameter of 3 mm, and the filter paper sample was immersed in the cylindrical tube with a wetted length of 5 mm. At the same time, an absorption experiment was started to measure the migration distance depending on time. Because it is difficult for the dye to be absorbed in the form of an accurate straight line in the area of the paper, the point where the straight line is expressed from the measurement starting point was measured as the moving distance. Figure 1 shows the evaluation of the dye migration rate of the paper matrix (filter paper).

Fig. 1. Evaluation of dye migration rate of the paper matrix (filter paper)
NFC slurry preparation and NFC film manufacture
The NFC was made by refining and microgrinding. The HwBKP with 1.57% was soaked in tap water and then refined to 450 ± 5 mL CSF using a laboratory valley beater. The refined pulp slurry was diluted to 1.0% consistency for fibrillation. The pulp slurry at 1.0% solid content was then fibrillated using a Super Mass Colloider (MKZA6-2, Masuko Sangyo Co., Ltd., Kawaguchi, Japan) at 1,500 rpm. The pulp slurry was fed into the grinder, and the final number of fibrillation was 9 times. The morphology of prepared NFC is shown in Fig. 2 and the average fiber width was 45.1 ± 12.5 nm. After adjusting the consistency of the prepared NFC slurry to 1.0%, it was used for surface coating of filter paper and for manufacturing transparent NFC film of TI, respectively.
NFC film was made from the NFC slurry using a pressure dehydration tester (Pressure dehydration tester, Quro, Yangju, Republic of Korea). The NFC slurry at 1.0% solid content was diluted to 0.5% using distilled water and dispersed for 5 min using an ultrasonic cleaner. The NFC slurry was weighed to obtain the NFC film with a basis weight of 40 g/m2. A 400-mesh screen and filter paper No. 5 were laid in the container of the pressure hydration tester, and the weighed NFC slurry was placed there. Dehydration was conducted for 10 min under a pressure of 7 bar. The wet NFC film was wet-pressed at 345 kPa for 5 min and dried at 120 °C using a laboratory wet press (model 326; Wintree Corporation, Osaka, Japan) and a cylinder dryer (Daeil Machinery Co. Ltd, Daejeon, Republic of Korea), respectively.

Fig. 2. SEM image of NFC
Surface coating of filter paper for the use of middle-layer component
In this study, a paper was used as the main component of TI. Four papers were used as TI cover, NFC film support, dye storage, and dye transfer. General paper products can be used for TI cover paper; however, the other three papers require high hydrophobicity because they come in direct contact with the dye solution. In this session, the hydrophobization method of NFC-film support and dye storage paper is explained, and the coating method of paper serving as dye migration is mentioned in the next session.
To impart hydrophobicity to the surface of the hydrophilic filter paper No. 5, the coating was conducted with biowax emulsion using a laboratory bar coater (AUTO BAR COATER, HanTech Co., Ltd., Daejeon, Republic of Korea), and the filter paper was then dried in an air dryer using hot and cold air. The biowax emulsion produced by TopScreenTM technology is composed of polystyrene maleimide (SMI) with vegetable oil (Triantafillopoulos and Koukoulas 2020); therefore, it can provide the solution to consumer demand for paraffin-free, environmentally friendly, paper packaging, and the packaging paper can be recyclable. Bio wax-coated filter paper was used for TI manufacturing after cutting the middle part to the same size as the dye migration path. To determine the degree of hydrophobization, the initial contact angle and the change in the contact angle during the dye migration were measured using a contact angle goniometer.
Surface coating of the paper matrix for controlling the migration of dye
To control the dye migration rate and prevent the dye from leaking to the side of the migration path, the surface of the filter papers was coated with NFC slurry and/or biowax emulsion (Fig. 3).
NFC coating was performed to control the dye migration rate of the filter papers. The prepared NFC slurry at 1.0% consistency was used to coat the filter paper surface using a laboratory bar coater (AUTO BAR COATER, HanTech Co., Ltd., Daejeon, Republic of Korea). The top side of the filter paper was coated, and the filter paper was air-dried for 150 s. After the top side of the filter paper was coated, the bottom side of the filter paper underwent the same treatment. The coat weight was controlled at 2.4 to 2.5 g/m2 for each side. The surface coated filter papers were conditioned at 23 ℃ and 50% RH, and then the dye migration rate in the surface-coated filter paper was measured (Fig. 1).
To prevent the dye from spreading while moving in a straight line at regular intervals on the surface of the filter paper, the filter paper must have hydrophobicity, except for the area where the dye moves. The bottom side of filter paper surface-coated with NFC was coated with the biowax emulsion using a laboratory bar coater, and the filter paper was air-dried with hot and cold air. The top side of the filter paper was coated with the same biowax emulsion, after the bottom side of the filter paper was coated. Another filter paper, which was cut as much as the area to which the dye was migrated, was attached on the top side of the filter paper before the coating was conducted using the same method as the surface coating of the bottom side. After both sides of the filter paper were coated with biowax emulsion, heat treatment was conducted in an oven dryer for 1 min to ensure that the hydrophobicity of filter paper by the biowax layer could be modified.

Fig. 3. Surface coating of filter paper for the modification of dye migration rate and hydrophobicity of the filter paper
Design of TI with many components
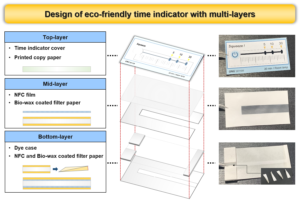
To manufacture a TI prototype, the sensor structure consisting of three layers was designed (Table 3). The top-layer is the cover part where the consumer can check the passage of time, and the image can be printed, and it is composed of printing paper. For the middle-layer, a NFC film and filter paper were used so that the color change could be observed while protecting the dye from touching the top-layer. For the bottom-layer, a surface-coated filter paper was used to act as a bottom and a matrix function to absorb and migrate the dye. A space for storing the dye was prepared between the middle- and the bottom-layers, and the dye case was also made of filter paper coated on both sides with biowax emulsion. When assembling the TI, a glue stick was used to bond the components of each layer.
Table 3. Composition and Roles of Each Layer of TI

RESULTS AND DISCUSSION
Dye Selection for Manufacturing a TI
To determine the type and concentration of the dye suitable for manufacturing a TI, two types of filter papers, with different pore sizes, were used. The solubility of the dye is an important factor when it is absorbed and applied to the paper matrix. If there is an undissolved residue, the dispersibility of the dye decreases, preventing uniform absorption or migration (Chakraborty 2014). The dye should exist in a molecularly dispersed form in a solvent to penetrate the matrix (Grishanov 2011). However, the dye must has a high concentration because it is necessary to express sufficient color. Therefore, it was important to select the type and maximum concentration of dye that can exhibit a clear color and uniform migration in the filter paper.

Fig. 4. Dye solution appearance depending on the concentration of (a) Methylene blue, (b) Bromothymol blue, and (c) Methyl red
As shown in Fig. 4, dissolution was not achieved at 0.025% for methyl red and 1.0% for bromothymol blue, whereas methylene blue showed the maximum dissolution level at 4.0%. The undissolved residue was observed in the methyl red and bromothymol blue solution as their concentration increased. Figure 5 shows the migration pattern of dyes in the filter paper depending on the type and concentration of the dye. The upper images show the migration pattern of dyes when the filter paper was immersed in the solution, and the lower images show the filter paper images that were oven-dried after immersing the filter paper in the dye solutions. Bromothymol blue and methyl red had a translucent light color, and methylene blue showed a dark color at a high concentration. When the color expression, depending on the type and concentration of the dye, was compared, the color of methylene blue with a concentration of 4.0% was expressed and showed a uniform color even after drying. Therefore, the final dye condition for manufacturing a TI was selected as methylene blue with a concentration of 4.0%

Fig. 5. Dye migration pattern in filter paper immersed in the dye solutions and dried filter paper after immersion test depending on the concentration of (a) methylene blue, (b) bromothymol blue, and (c) methyl red solutions
Effect of Filter Paper Property on the Dye Migration Rate
To investigate the physical properties of the filter paper affects the dye migration rate in the paper matrix, the correlation between the physical properties and the dye migration rate was analyzed. The dye migration rate in the filter paper was determined by measuring the moving distance at a given moving time. Figure 6 shows the migration distance of methylene blue with a concentration of 4.0% in five filter papers for 30 min. The migration distance differed depending on the filter paper type, which suggests that it is necessary to select an appropriate stationary phase when designing the TI according to the distribution time of each package.
Figures 7 and 8 show the correlation between the basis weight and thickness of the filter paper and the dye migration rate. Both properties showed a low correlation with R2 of less than 0.5%. The pore size of the filter paper showed a relatively high correlation with the dye migration rate (Fig. 9). Therefore, a customized TI can be manufactured by selecting a stationary phase with a small pore size to manufacture a TI with a long target time, and another one with a large pore size to manufacture a TI with a short time.

Fig. 6. Effect of the type of filter paper on the migration distance of dye

Fig. 7. Relationship between basis weight of filter paper and dye migration rate

Fig. 8. Relationship between the thickness of filter paper and dye migration rate

Fig. 9. Relationship between the pore size of filter paper and dye migration rate
NFC Coating of Filter Paper for Controlling the Dye Migration Rate
Because the dye migration rate varies according to the pore size of the filter paper, which is the stationary phase of a TI, it is important to modify the pore size of the paper matrix as small as possible to manufacture a commercial TI. However, there is a limit to lowering the pore size of the porous paper matrix; a surface coating process is required to control the pore size of the filter paper.
Surface sizing or pigment coating have been conducted to lower the pores of paper in a paper mill (Lehtinen 2000; Lee et al. 2002; Bhardwaj et al. 2019). However, these processes have a limit to filling the pores in the paper. NFC, which was known as an effective barrier coating agent for packaging paper or film, was selected as a coating agent of the filter paper, and the NFC coating of filter paper No. 6 and 5 with the smallest pore size was carried out to control the dye migration rate.
Figures 10 and 11 show the effect of NFC coating on the dye migration rate of filter paper No. 6 and 5, respectively. The initial dye migration rate in the filter papers coated with NFC only on one side was higher than that on untreated filter paper respectively; however, after 30 min, there was no significant difference in the dye migration rate depending on whether NFC was coated or not. The difference in the dye migration rate of the filter papers coated on both sides using NFC became larger as the migration time passed. When filter paper No. 6 was coated on both sides with NFC, the migration rate decreased by 21.8% after 30 min and when filter paper No. 5 was coated on both sides, the migration rate decreased by 28.1% after 30 min. This was attributed to the fact that the pores of the filter paper No. 5 were filled with NFC, and a NFC layer was formed on the surface at the same time (Fig. 12). In addition, the dye transfer rate of filter paper No. 5, which was coated on both sides, was 29.3% lower than that of filter paper No. 6 coated on both sides because the pore size of the filter paper No. 5 was lower than that of filter paper No. 6.
Therefore, it is effective to select the proper pore size of the filter paper and use NFC double-sided coating technology for meeting consumer needs for the time range of TI.

Fig. 10. Effect of NFC coating on the dye migration rate of the filter paper No. 6

Fig. 11. Effect of NFC coating on the dye migration rate of the filter paper No. 5

Fig. 12. SEM images of the surface of filter paper No. 5 coated with NFC (a) uncoated filter paper, (b) NFC coated filter paper
Biowax Coating of Filter Paper Coated with NFC for Hydrophobicity
The filter papers used for NFC film supporting and dye storage were coated with biowax emulsion for imparting hydrophobicity, and the contact angle of filter paper was measured using a contact angle meter for 30 min. Figure 13 shows the contact angle of biowax coated filter paper, depending on the migration time. The initial contact angle was more than 110°, which indicated that the filter paper surface was hydrophobized. Moreover, the contact angle was maintained during the dye migration time of 30 min. Therefore, biowax was effective in stably hydrophobizing the filter paper.

Fig. 13. Contact angle of the filter paper coated with biowax depending on contact time
When the dye moved on NFC-coated filter paper used for the bottom-layer, the dye bled sideways (Fig. 14 (a)). This was because the filter paper and NFC were hydrophilic materials; thus, they could not suppress the spreading of dye. Therefore, the coating was performed using biowax emulsion after NFC coating to prevent the dye from spreading while moving in a straight line at regular intervals on the surface of the filter paper. Biowax coating was conducted on the NFC coated filter paper No. 5.

Fig. 14. Images of both sides: (a) NFC coated filter paper, (b) NFC and biowax coated filter paper
Figure 15 shows the surface and the thickness direction SEM images of filter paper coated with NFC and biowax. In the area coated with biowax, the surface was coated so that no fibers of the filter paper were observed, and a biowax layer was formed on the surface of the filter paper even toward the thickness. Thus, even if the dye was absorbed into the filter paper after TI started to operate, the dye did not spread to the hydrophobic region outside the moving path (Fig. 14 (b)).
Therefore, it is important to coat the paper surface, which is an absorber of the dye, with NFC and biowax, which are eco-friendly materials, to control the dye migration rate and prevent the dye from spreading to areas outside the migration path.

Fig. 15. SEM images of filter paper coated with NFC and biowax: (a) surface (b) thickness
Assembly of a TI Prototype Using Cellulose Based Materials
Commercially available TTI or TI are manufactured using petrochemical or synthetic polymer materials. However, if the demand for TTI or TI increases in the future, the demand for TI performance, as well as environmental friendliness, will increase. Therefore, the development of eco-friendly TI using cellulose-based materials is required, thus, in this study, a prototype of TI using cellulose-based materials was designed.

Fig. 16. Prototype of environmentally friendly TI composed of three layers
Figure 16 shows the detailed structure of TI, which was composed of three layers. The top-layer is a cover part where consumers can check the passage of time and can use the desired image by printing. The printing time on the top-layer can vary according to the needs of consumers who use TI. For the middle-layer, a transparent NFC film with a basis weight of 40 g/m2 was placed so that the color change could be observed while protecting the dye from touching the top-layer. The NFC film supporting filter paper coated with biowax was placed between NFC film and the bottom-layer. For the bottom-layer, it was manufactured by coating the same as the previous experimental results using NFC and biowax so that it could act as a bottom and a porous matrix that absorbed the dye. A space for storing the dye with a height of 3 mm was prepared between the bottom-layer and the middle-layer. In addition, the dye case was also made of filter paper No. 5 coated on both sides with the biowax to manufacture a prototype.
CONCLUSIONS
- Methylene blue was found to be suitable for a mobile phase dye considering the deep color with excellent visibility and high solubility. Since the pore size of the filter paper, which is a stationary phase of the time indicator (TI), correlated highly with the dye migration rate, the pore size of the filter paper should be adjusted according to TI consumers’ needs.
- A nanofibrillated cellulose (NFC) coating on the filter paper made it possible to modify the pore size of the filter paper to control the dye migration rate. The both-sided coating was more effective than the one-sided one.
- Biowax, as a coating agent, was effective for NFC-film supporting paper and dye cases by imparting hydrophobicity on the filter paper surface. Biowax coating on the NFC coated filter paper prevented the dye from spreading to areas outside the dye migration path in the filter paper used for the bottom layer of TI.
- The three-layered TI prototype could be fabricated using dye, copy paper, cellulose nanofiber (NFC) film and filter paper coated with NFC slurry and biowax emulsion.
ACKNOWLEDGMENTS
This study was carried out by the Forest Service’s Forest Convergence Specialist Training Project (Support for Forest Industry Characterization Research, FTIS Assignment No. 2020186G10-2122-AA02).
REFERENCES CITED
Alizadeh-Sani, M., Tavassoli, M., Mohammadian, E., Ehsani, A., Khaniki, G. J., Pryadarshi, R., and Rhim, J. W. (2021). “pH-responsive color indicator films based on methylcellulose/chitosan nanofiber and barberry anthocyanins for real-time monitoring of meat freshness,” International Journal of Biological Macromolecules 166, 741-750. DOI: 10.1016/j.ijbiomac.2020.10.231
Arunan, I., and Crawford, R. H. (2021). “Greenhouse gas emissions associated with food packaging for online food delivery services in Australia,” Resources, Conservation & Recycling 168, 105299. DOI: 10.1016/j.resconrec.2020.105299
Bambang Kuswandi and Jumina. (2020). “Active and intelligent packaging, safety, and quality controls,” in: Fresh-Cut Fruits and Vegetables, Academic Press, Cambridge, USA, pp. 243-294. DOI: 10.1016/B978-0-12-81618-5.00012-4
Bhardwaj, S., and Bhardwaj, N. K. (2019). “Mixing of oxidized starch and polyvinyl alcohol for surface sizing of paper,” Nordic Pulp & Paper Research Journal 34(3), 343-353. DOI: 10.1515/npprj-2018-0063
Carstens, F., Gamelas, J. A. F., and Schabel, S. (2017). “Engineering microfluidic papers: Determination of fibre source and paper sheet properties and their influence on capil-lary-driven fluid flow,” Cellulose 24, 295-309. DOI: 10.1007/s10570-016-1079-7
Chakraborty, J. N. (2014). “Dyeing with disperse dye,” in: Fundamentals and Practices in Colouration of Textiles, Woodhead, Delhi, India, pp. 209-219. DOI: 10.1016/B978-93-80308-46-3.50018-2
Ding, L., Li, X., Hu, L., Zhang, Y., Jiang, Y., Mao, Z., Xu, H., Wang, B., Feng, X., and Sui, X. (2020). “A naked-eye detention polyvinyl alcohol/cellulose-based pH sensor for intelligent packaging,” Carbohydrate Polymers 233, 115859. DOI: 10.1016/j.carbpol.2020.115859
Dodero, A., Escher, A., Bertucci, S., Castellano, M. and Lova, P. (2021). “Intelligent packaging for real-time monitoring of food-quality: current and future developments,” Applied Sciences 11(8), 3532. DOI: 10.3390/app11083532
Firouz, M. S., Mohi-Alden, K., and Omid, M. (2021). “A critical review on intelligent and active packaging in the food industry: Research and development,” Food Research International 141, article no. 110113. DOI: 10.1016/j.foodres.2021.110113
Grishanov, S. (2011). “Structure and properties of textile materials,” in Handbook of Textile and Industrial Dyeing, Woodhead Publishing, Sawston, UK, pp. 28-63. DOI: 10.1533/9780857093974.1.28
Guiavarc’h, Y., Loey, A. V., Zuber, F., and Hendrickx, M. (2004). “Bacillus licheniformis α-amylase immobilized on glass beads and equilibrated at low moisture content: Potentials as a time-temperature integrator for sterilisation processes,” Innovative Food Science and Emerging Technologies 5, 317-325. DOI: 10.1016/j.ifset.2004.03.004
Hu, X. G., Li, X. L., Park, S. H., Kim, Y. H., and Yang, S. I. (2016). “Nondestructive monitoring of Kiwi ripening process using colorimetric ethylene sensor,” Bulletin of the Korean Chemical Society 37(5), 759-762. DOI: 10.1002/bkcs.10745
Jafry, A. T., Lim, H. S., Sung, W. K., and Lee, J. K. (2017). “Flexible time-temperature indicator: a versatile platform for laminated paper-based analytical devices,” Microfluidics and Nanofluidics 21, 57. DOI: 10.1007/s10404-017-1883-x
Kim, J. U., Ghafoor, K., Ahn, J. E., Shin, S. I., Lee, S. H., Shahbas, H. M., Shin, H. H., Kim, S. P., and Park, J. Y. (2016). “Kinetic modeling and characterization of a diffusion-based time-temperature indicator (TTI) for monitoring microbial quality of non-pasteurized angelica juice,” LWT-Food Science and Technology 67, 143-150. DOI: 10.1016/j.lwt.2015.11.034
Lee, H. L., Shin, J. Y., Koh, C. H., Ryu, H., Lee, D. J., and Sohn, C. M. (2002). “Surface sizing with cationic starch: Its effect on paper quality and papermaking process,” TAPPI Journal 1(1), 34-40. Retrieved from www.tappi.org
Lehtinen Esa. (2000). “Introduction to pigment coating of paper,” in Pigment Coating and Surface Sizing of Paper, TAPPI Press, Fapet Oy, Helsinki, Finland. pp. 14-25.
Li, T., Chen, J., Brozena, A. H., Zhu, J. Y., Xu, L., Driemeier, C., Dai, J., Rojas, O. J., Isogai, A., Wågberg, L., and Hu, L. (2021). “Developing fibrillated cellulose as a sustainable technological material,” Cellulose 590, 47-56. DOI: 10.1038/s41586-020-03167-7
Lu, P., Yang, Y., Liu, Ren., Ma, Jinxia., Wu, M., and Wang, S. (2020). “Preparation of sugarcane bagasse nanocellulose hydrogel as a colourimetric freshness indicator for intelligent food packaging,” Carbohydrate Polymers 249, 116831. DOI: 10.1016/j.carbpol.2020.116831
Park, S. K., Venditti, R. A., Jameel, H., and Pawlak, J. J. (2006). “Changes in pore size distribution during the drying of cellulose fiber as measured by differential scanning calorimetry,” Carbohydrate Polymers 66(1), 97-103. DOI: 10.1016/j.carbpol.2006.02.026
Park, Y. W., Kim, S. M., Lee, J. Y., and Jang, W. H. (2015). “Application of biosensors in smart packaging,” Molecular and Cellular Toxicology 11(3), 277-285. DOI: 10.1007/s13273-015-0027-1
Puligundla, P., Jung, J., and Ko, S. H. (2012). “Carbon dioxide sensors for intelligent food packaging applications,” Food Control 25, 328-333. DOI: 10.1016/j.foodcont.2011.10.043
Rodrigure, C., Souza, V. G. L., Coelhoso, I., and Fernando, A. L. (2021). “Bio-based sensors for smart food packaging-current applications and future trends,” Sensors 21(6), 2148. DOI: 10.3390/s21062148
Rukchon, C., Nopwinyuwong, A., Trevanich, S., Jinkarn, T., and Suppakul, P. (2014). “Development of a food spolilage indicator for monitoring freshness of skinless chicken breast,” Talanta 130, 547-554. DOI: 10.1016/j.talanta.2014.07.048
Triantafillopoulos, N., and Koukoulas, A. A. (2020). “The future of single-use paper coffee cups: Current progress and outlook,” BioResources 15(3), 7260-7287. DOI: 10.15376/biores.15.3.Triantafillopoulos
Zhai, X., Wang, X, Zhang, J., Yang, Z., Sun, Y., Li, Z., Huang, X., Holmes, M., Gong, Y., Povey, M., Shi, J., and Zou, X. (2020). “Extruded low density polyethylene-curcumin film: A hydrophobic ammonia sensor for intelligent food packaging,” Food Packaging and Shelf Life 26, 100595. DOI: 10.1016/j.fpsl.2020.100595
Article submitted: September 12, 2021; Peer review completed: December 11, 2021; Revised version received and accepted: December 15, 2021; Published: December 20, 2021.
DOI: 10.15376/biores.17.1.1120-1135