
Abstract
In this study, the entire gene encoding cinnamyl alcohol dehydrogenase in kenaf (HcCAD2) was cloned and characterized. CAD is a key enzyme in the last step of lignin biosynthesis. The full-length HcCAD ortholog is composed of a 1,074-bp open reading frame (ORF) encoding 357 amino acids (KM044582). BlastP and a phylogenetic study revealed that the deduced amino acid sequences share the highest similarity with Gossypium hirsutum (ABZ01817) (89%). Upon real-time PCR analysis, HcCAD1 (HM151380) and HcCAD2 were highly up-regulated in 4-week-old stem and mature flower tissues, which was matched with histochemical staining and lignin component analysis. The expression patterns of the two genes differed in response to wound, cold, NaCl, SA, H2O2, ABA, MeJA, and drought. CAD enzyme activity was measured with various aldehydes as substrates to form corresponding alcohols. The results indicated that the preferred substrates were coniferyl and sinapyl aldehydes with high catalytic efficiency.
Download PDF
Full Article
Functional Characterization of Cinnamyl Alcohol Dehydrogenase during Developmental Stages and under Various Stress Conditions in Kenaf (Hibiscus cannabinus L.)
Bosung Choi,a Jun Y. Chung,b Hyeun-Jong Bae,c Inhwan Bae,d,* Seonjoo Park,e,* and Hanhong Bae a,*
In this study, the entire gene encoding cinnamyl alcohol dehydrogenase in kenaf (HcCAD2) was cloned and characterized. CAD is a key enzyme in the last step of lignin biosynthesis. The full-length HcCAD ortholog is composed of a 1,074-bp open reading frame (ORF) encoding 357 amino acids (KM044582). BlastP and a phylogenetic study revealed that the deduced amino acid sequences share the highest similarity with Gossypium hirsutum (ABZ01817) (89%). Upon real-time PCR analysis, HcCAD1 (HM151380) and HcCAD2 were highly up-regulated in 4-week-old stem and mature flower tissues, which was matched with histochemical staining and lignin component analysis. The expression patterns of the two genes differed in response to wound, cold, NaCl, SA, H2O2, ABA, MeJA, and drought. CAD enzyme activity was measured with various aldehydes as substrates to form corresponding alcohols. The results indicated that the preferred substrates were coniferyl and sinapyl aldehydes with high catalytic efficiency.
Keywords: Cinnamyl alcohol dehydrogenase (CAD); Abiotic stress; Enzyme assay; Real-time PCR; Lignin
Contact information: a: School of Biotechnology, Yeungnam University, Gyeongsan, Gyeongbuk 712-749, Republic of Korea; b: Department of Orthopedic Surgery, School of Medicine, Ajou University, Suwon 442-749, Republic of Korea; c: Department of Bioenergy Science and Technology, Chonnam National University, Gwangju 500-757, Republic of Korea; d: College of Pharmacy, Chungang University, Seoul 156-756, Republic of Korea; e: Department of Life Sciences, Yeungnam University, Gyeongsan, Gyeongbuk 712-749, Republic of Korea;
* Corresponding authors: inhwan.bae@gmail.com; sjpark01@ynu.ac.kr; hanhongbae@ynu.ac.kr
INTRODUCTION
Kenaf (Hibiscus cannabinus L.), an annual dicotyledonous plant, thrives in various habitats ranging from temperate to tropical regions, including arid areas (Dempsey 1975). Because kenaf has a high growth rate and broad ecological adaptability, it is believed to have great potential as a source for future biomass production. Kenaf has also been used for pulp and paper production because of its high quality fiber (Pande and Roy 1996). Because the bark of kenaf accounts for 35% to 40% of its total stem weight and its stems are composed of relatively long outer fibers and short inner fibers at a 1:3 ratio, its fibers are a promising raw material for use by the pulp industry. During pulping, lignin increases costs and reduces the efficiency of the process. Additionally, the accessibility of microbial, cell wall-degrading enzymes is reduced by the protection of cell wall polysaccharides by lignin. Recent studies have been conducted to develop genetically modified plants with lower lignin contents or different compositions. Kenaf contains less than 11% lignin and more cellulose than other non-woody plants (Gutiérrez et al. 2004). High levels of polysaccharides are not only beneficial to pulping, but also provide a great advantage to bioethanol production. In addition, the fibers have a high proportion of S units of lignin, which are more easily digestible than other lignin units (G and H units) (Gutiérrez et al. 2004).
Lignin biosynthesis is conducted via the phenylpropanoid pathway, which is divided into two major steps: monolignol biosynthesis (coniferyl, sinapyl, and ?-coumaryl alcohols) and cross-linkage of monolignols by peroxidase and laccase enzymes. In monolignol biosynthesis, a series of enzymatic reactions is carried out by 10 distinct enzymes. The initial step is carried out by phenylalanine ammonia lyase (PAL), which is catalyzed by cinnamyl alcohol dehydrogenase (CAD) and deaminates phenylalanine, forming coniferyl, sinapyl, and ?-coumaryl alcohols. CAD converts cinnamyl aldehyde to cinnamyl alcohol in the final step of the pathway and is therefore a key enzyme in monolignol biosynthesis. In gymnosperms, CAD is usually encoded by one gene with high activity for the reduction of coniferyl aldehyde, but not for sinapyl aldehyde (Galliano et al. 1993). Conversely, CAD in angiosperms is usually encoded by multiple genes with high specificity to both coniferyl and sinapyl aldehydes (Brill et al. 1999). In Arabidopsis, CAD consists of nine genes (AtCAD1 to AtCAD9), but only AtCAD1, AtCAD4, and AtCAD5 play important roles in lignin biosynthesis (Kim et al. 2004). Deficiencies in each gene are known to result in reduced lignin content and compounds. Down-regulation of CAD expression in poplar and tobacco led to enhanced levels of coniferyl and sinapyl aldehydes (Ralph et al. 2001), and it was easier to remove lignin from the poplar and tobacco plants subjected to CAD down-regulation. In addition, more free phenolic groups could be generated because of the increased alkaline solubility of the lignin and thus, the pulping efficiency (Lapierre et al. 2004).
In this study, the function and expression patterns of CAD during different developmental stages and under various stress conditions were characterized. The results presented in this study provide information that will lead to improved biomass properties in materials used by the pulp and bioethanol industries.
EXPERIMENTAL
Plant Materials
Kenaf seeds (Hibiscus cannabinus L., C-9) produced by the Advanced Radiation Technology Institute (Korea Atomic Energy Research Institute, Jeongeup 580-185, Korea) were sown in a flat system composed of 32 individual pots containing a non-soil mixture (TOBIETEC). The growth room conditions were as follows: 16-h light/8-h dark photoperiod; 22 °C; and 100 μmol/m2/s light intensity for four weeks. Four-week-old plants were transferred into 20-cm pots with a non-soil mixture and grown in a greenhouse under natural sunlight for up to 20 weeks with watering twice a week. Samples for tissue-specific analysis (roots, stems, petioles, leaves, and flowers) were collected from 16-week-old plants. Three-week-old seedlings were used for various stress treatments. The treatments were as previously described (Choi et al. 2012).
CAD Cloning
RNA extraction was conducted as previously described (Choi et al. 2012). Degenerate primer sequences were designed based on the consensus sequences of the CAD orthologs of Populus trichocarpa (EU603306), Gossypium hirsutum (EU857624), Solanum lycopersicum (AK323694), Linum album (AJ811963), and Arabidopsis thaliana (NM119587). The forward and reverse primers were as follows: forward primer (CAD-F), 5’-CCTGG(C/G/A)CA(T/C)GAAGT-3’; and reverse primer (CAD-R), 5’-TCCTC(C/T)GT(T/C)TCCTTCAT-3’. Amplified products were purified using a Wizard SV Gel and a PCR Clean-up System (Promega) and were then inserted into the pGEM-T easy Vector (Promega). DNA sequencing was carried out by Cosmogenetech Co. To complete the cloning of the full-length kenaf CAD ortholog, both 5’ and 3’ RACE (rapid amplification of cDNA ends) were conducted according to the manufacturer’s guidelines (Invitrogen). Two sets of gene specific primers (GSP) were used for 5’ RACE: 5’GSP3, 5’-CTGCAACATCCAACAAGACA-3’; 5’GSP2, 5’-CGTTGTACGACCAGATCTTC-3’; and 5’GSP1, 5’-ATGCTCCAATGCCTCGACTT-3’. The following primers were used for 3’ RACE: 3’GSP1, 5’-AAGTCGAGGCATTGGAGCAT-3’; 3’GSP2, 5’-ACTCGATTACATCATCGACA-3’; and 3’GSP3, 5’-CTCTCGAGCCTTACCTTTC-3’. The full length of the HcCAD2 gene was amplified using the forward and reverse primers with BamHI and HindIII sites added as follows: forward primer, 5’-GGCCGGATCCATGGGTAGCCTTGAAACC-3’; and reverse primer, 5’-GGCCAAGCTTTGGATCGAGCTTGCTTCC-3’. Validation of the amplified product was confirmed by sequencing. Finally, the samples were digested with restriction enzymes and the products were cloned into the same sites of the pET-28a vector (Novagen).
Quantitative Real-Time Reverse Transcription PCR (QPCR) Analysis
QPCR was conducted as previously described by Bae et al. (2008) using an Mx3000P QPCR System (Agilent) with SYBR Green QPCR Master Mix (LPS Solution). Primer 3 software of the Biology Workbench (http://workbench.sdsc.edu/) was applied to design primers for HcCAD1 and HcCAD2. Primer specificity was validated using a dissociation curve. The forward and reverse primers of the HcCAD orthologs were as follows: HcCAD1 forward primer, 5’-CTTACCTTTCGTTGCTGAGACAT-3’; HcCAD1 reverse primer, 5’-GATATAATCCATCTTCACCACTTCG-3’; HcCAD2 forward primer, 5’-AGGAAATCACAGGGAGTTTCATTG-3’; and HcCAD2 reverse primer, 5’-CCACTTAATCTATGGATCGAGCTT-3’. ACTIN (DQ866836), a housekeeping gene, was analyzed for expression normalization using the following primers: HcACT forward primer, 5’-AAGTTCTCGAACGAGAAGCTGAT-3’; and HcACT reverse primer, 5’-AGTGATTTCCTTGCTCATACGGT-3’. Validation of the amplified products was confirmed by sequencing. Average values were calculated from three biological replications.
Data Analysis
Analysis of DNA and protein sequences was performed using NCBI Blast (http://blast.ncbi.nlm.nih.gov/), Biology WorkBench (ClustalW), the ExPASy Proteomics Server (http://expasy.org/tools/pitool.html), Superfamily 1.75 (http://supfam.org/ SUPERFAMILY/index.html/), SignalP 3.0 (http://www.cbs.dtu.dk/services/SignalP/), and TargetP V1.1 (http://www.cbs.dtu.dk/services/TargetP/). A phylogenetic tree was constructed using the neighbor joining method in Mega5 (http://www.megasoftware.net). Student’s t-test and Duncan multiple range test (SAS, SAS Institute Inc. Korea) were performed to determine the statistical significance.
CAD Enzyme Kinetic Assay
The pET-28a-HcCAD2 vector was introduced into E. coli (BL21), which was incubated at 37 °C in Luria-Bertani (LB) medium containing 2 mM ZnCl2 and 50 mM Kanamycin until the OD600 reached 0.8. Next, 1 mM IPTG was added into the LB medium and the cells were grown at 18 °C for 16 h. The cells were subsequently harvested by centrifugation at 5,000 g for 30 min, after which the aqueous phase was removed and the cells were resolved in lysis buffer (100 mM Tris-HCl, pH 8.0; 300 mM NaCl; 10 mM imidazole) and then incubated with lysozyme (final concentration of 2 mg/mL) on ice for 1 h. Following sonication, cell lysates were precipitated by centrifugation at 5,000 g for 30 min. Next, the recombinant proteins in the supernatant were purified using a Ni-NTA His-Bind Resin (BioRad) according to the manufacturer’s instructions. Finally, the protein concentration was determined by Bradford assay using spectrophotometry. The enzyme activity of HcCAD2 was determined according to the modified method described by Ma (2010). In every reaction, automatic observation for declination at OD340 was carried out in 1-min intervals for 10 min. Extrapolation from Lineweaver-Burke plots was then used to calculate Km and Vmax. Additionally, the influence of the pH on the enzyme activity was examined by adding the reaction mixture to sodium phosphate buffers of various pH values for 15 min. To measure the enzyme stability, the enzyme activity was measured after incubation of the reaction mixture at different temperatures. The final reaction mixture consisted of 100 mM sodium phosphate buffer (pH 6.0), 34 μM aldehyde, 100 μL of enzyme, and 100 μM NADPH. This experiment was performed three times.
Histochemistry of Lignin Deposition
To observe the lignin distribution, kenaf stems from each developmental stage were cut into uniform sections using a razor blade and stained with phloroglucinol (2% w/v phloroglucinol acidified in 6 M HCl) for 30 s. After staining, the samples were placed in glycerol and observed under a light microscope (Olympus BX51) equipped with a digital camera.
Lignin Content and Component Analysis
Kenaf samples were ground in a Wiley mill to obtain 40- to 60-mesh meal which was then Soxhlet-extracted with a mixture of alcohol and benzene (1:2) until the solvent was clear of any color. The extract content was then determined as described by TAPPI methods (TAPPI 1992), after which the lignin monomers were determined by nitrobenzene oxidation (Chen 1992). Next, extractive-free samples of about 20 to 30 mg weight were reacted with 4 mL of 2 N NaOH solution and 0.25 mL of nitrobenzene oxidant in a stainless steel vessel for 2 h at 170 °C in a heating block. The reaction mixture was then cooled on ice and mixed with 0.1 mL of dichloromethane containing 5 mg of 3-ethoxy-4-hydroxybenzaldehyde as an internal standard. The oxidation mixture was then transferred to a liquid-liquid extractor and extracted three times with 30 mL of dichloromethane to remove the nitrobenzene reduction products and any excess nitrobenzene. The aqueous layer was subsequently acidified to pH 1 to 2 with 4 M HCl solution, after which it was further extracted twice with 30 mL of dichloromethane and once with ethyl ether, dried over Na2SO4, and evaporated to dryness at reduced pressure. The dried products were dissolved in 0.1 mL of N-(trimethylsilyl) acetamide and analyzed by gas chromatography (Chrompack CP-9100, Agilent) using a CP-Sil 5 CB fused silica capillary column (25 m × 0.32 mm i.d., 1.2 m film thickness). The operating conditions were as follows: detector temperature, 280 °C; injector temperature, 280 °C; and oven temperature programmed to rise from 150 (5 min) to 250 °C at 10 °C /min. There were four biological replications of this experiment.
Sugar Analysis
Monosaccharides were measured in the kenaf stem tissues (4- and 12-week-old) using gas chromatography (GC-2010; Shimadzu) according to the method described by Wi et al. (2009). The stem tissues were hydrolyzed with 72% sulfuric acid at room temperature for 45 min, after which the samples were diluted with water to 4% sulfuric acid concentration and autoclaved at 121 °C for 1 h. The samples were then neutralized by adjusting the pH to 7.0 with ammonia. Myo-inositol was used as an internal standard. After adding dimethyl sulfoxide (0.1 mL) containing 2% sodium tetrahydroborate (NaBH4), the samples were incubated at 70 °C for 30 min. To decompose the sodium tetrahydroborate, 0.1 mL of acetic acid (18 M) was added. To enable complete acetylation, 0.2 mL of methylimidazol and 2 mL of anhydrous acetic acid were added and the samples were mixed vigorously and incubated at room temperature for 10 min. Next, 2 mL of dichloromethane and 5 mL of water were added, the samples were mixed vigorously, and the dichloromethane layer was transferred to a new tube. The solution was then completely evaporated under a stream of nitrogen gas, and the prepared sample (1 μL) was injected into a GC with a J&W DB-225 capillary column (30 m × 0.25 mm i.d., 0.25 μm film thickness; Agilent). Helium was used as the carrier gas. The following experimental conditions were used: initial column temperature, 100 °C for 1.5 min followed by a temperature increase of 5 °C/min to 220 °C; injector temperature, 220°C; and flame ionization detector (FID) temperature, 300 °C. There were four biological replications of this experiment.
RESULTS AND DISCUSSION
CAD Cloning
The full-length CAD ortholog in kenaf was cloned using degenerate primers and the RACE system. The sequencing data revealed that the CAD ortholog (GenBank Accession No. KM044582) is composed of a 1,074-bp open reading frame (ORF) encoding 357 amino acids (Fig. 1). The predicted molecular weight of the deduced amino acid sequences, which was calculated using the ExPASy Proteomics Server, is 38.66 kDa, with an isoelectric point (pI) of 5.34. According to TargetP1.1 and SignalP 3.0 analysis, the deduced amino acid sequences had no signal for subcellular localization and peptide at the N-terminus, indicating that the CAD protein might be localized in the cytoplasm. A BlastP search showed that the deduced CAD ortholog matched other species of CAD sequences with high similarity (least similarity, 79%), including another, previously reported, kenaf CAD ortholog that matched with 89% similarity. The deduced protein shared the highest similarity, 89%, with Gossypium hirsutum (ABZ01817). Multiple alignment revealed that HcCAD contained three conserved motifs in CAD proteins: the Zn1-biding motif (GHE(X)2G(X)5G(X)2V), the Zn2-biding motif (GD(X)9,10C(X)2C(X)2C(X)7C), and the NADPH-binding motif (GXG(X)2G) (Fig. 2) (McKie et al. 1993). The Zn1-binding motif in the deduced protein was located at amino acid residues 68 to 82 and the Zn2-biding motif was at residues 88 to 114, including the previously identified structural zinc ion coordinating residues (Cys 100, Cys 103, Cys 106, and Cys 114) (Vallee and Aulds 1990). The NADPH-binding motif was placed at residues 188 to 193.
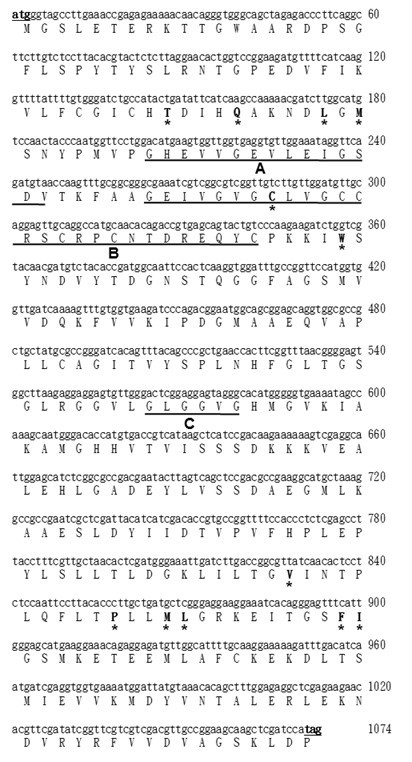
Fig. 1. Full-length coding and deduced amino acid sequences of kenaf cinnamyl alcohol
dehydrogenase ortholog (HcCAD2). The start codon (ATG) and stop codon (TAG) are
underlined and in bold. The conserved residues of CAD are also underlined: (A) Zn1-binding
motif, (B) Zn2-biding motif, and (C) NADPH-binding motif. Each upper case letter marked by an
asterisk (*) indicates a putative substrate biding site.
Superfamily analysis also revealed that the deduced protein contained an expected GroES-like domain at the N-terminus and NAD(P)-binding Rossmann-fold domains at the C-terminus. According to Youn et al. (2006), AtCAD5, one of the Arabidopsis CAD proteins, contained a putative substrate-binding pocket composed of the following 12 residues: T49, Q53, L58, M60, C95, W119, V276, P286, M289, L290, F299, and I300. When compared to the residues of AtCAD5, the residues of HcCAD1 were different at L95, V119, and I290; however, the HcCAD2 residues were exactly the same as the AtCAD5 substrate-binding residues.
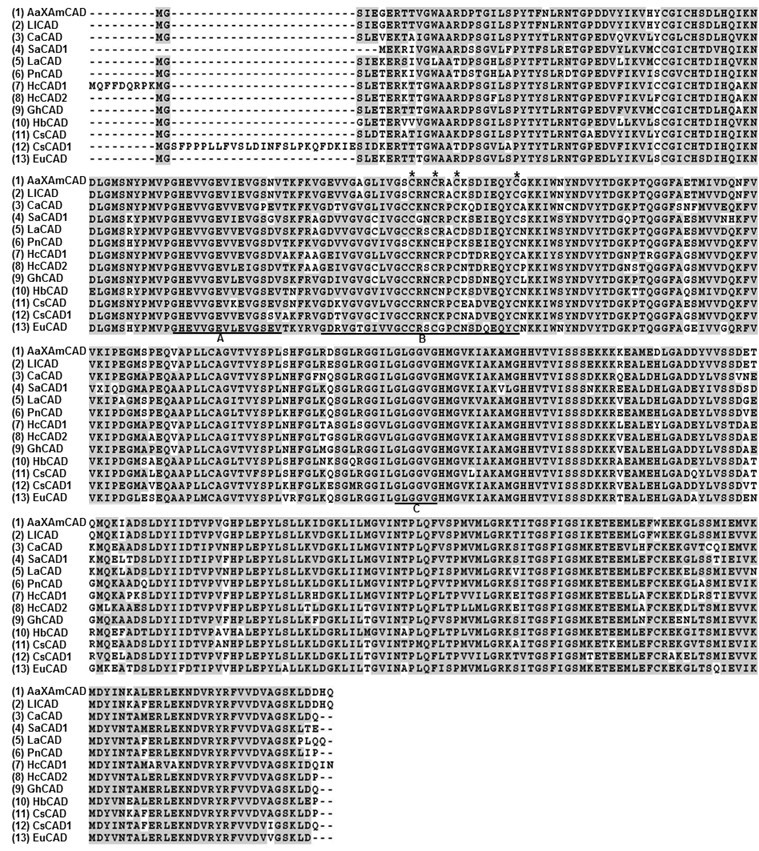
Fig. 2. Multiple alignment of deduced amino acid sequences of kenaf cinnamyl alcohol dehydrogenase ortholog (HcCAD2) with CAD sequences of other species. Alignment was conducted using ClustalW and the BOXSHADE sequence alignment program in Biology Workbench. Residues shaded in grey indicate amino acids both identical and similar to other CAD sequences. Conserved domains are underlined: (A) Zn1-biding motif, (B) Zn2-binding motif, and (C) NADPH-biding motif. The four zinc ion coordinating residues in Zn2-binding motif (Cys 100, Cys 103, Cys 106, and Cys 114) are marked by an asterisk (*). The GenBank accession numbers of the aligned CAD sequences are as follows: (1) Acacia auriculiformis x Acacia mangium (ABX75855), (2) Leucaena leucocephala (ABJ80682), (3) Capsicum annuum (ACF17645), (4) Striga asiatica (ABG35772), (5) Linum album (CAH19074), (6) Populus nigra (ADN96375), (7) Hibiscus cannabinus (HcCAD1, ADK24218), (8) Hibiscus cannabinus (HcCAD2, KM044582), (9) Gossypium hirsutum (ABZ01817), (10) Hevea brasiliensis (ADU64756), (11) Citrus sinensis (ABM67695), (12) Camellia sinensis (AEE69007), and (13) Eucalyptus urophylla (ACU77870).
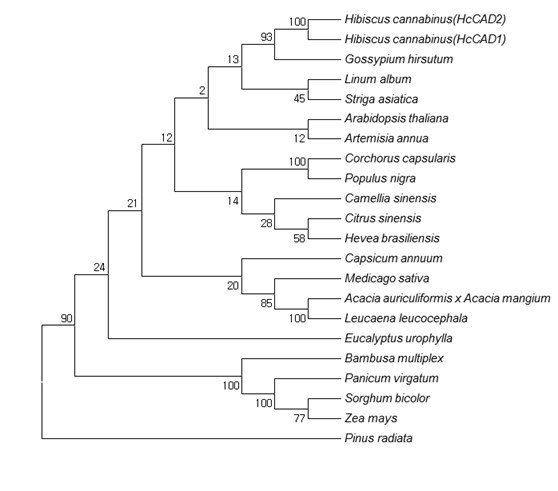
Fig. 3. Phylogenetic tree of the deduced amino acid sequences of CAD proteins from various plants. The phylogenetic tree was designed by the neighbor-joining method of ClustalW and Mega5. The numbers at the nodes indicate bootstrap values from 1,000 replications. The GenBank accession numbers were as follows: Hibiscus cannabinus (HcCAD1, ADK24218), Hibiscus cannabinus (HcCAD2, KM044582), Gossypium hirsutum (ABZ01817), Linum album (CAH19074), Striga asiatica (ABG35772), Arabidopsis thaliana (NP188576), Artemisia annua (ACB54931), Corchorus capsularis (AAR89392), Populus nigra (ADN96375), Camellia sinensis (AEE69007), Citrus sinensis (ABM67695), Hevea brasiliensis (ADU64756), Capsicum annuum (ACF17645), Medicago sativa (AAL34329), Acacia auriculiformis x Acacia mangium (ABX75855), Leucaena leucocephala (ABJ80682), Eucalyptus urophylla (ACU77870), Bambusa multiplex (ADG02378), Panicum virgatum (ADO01601), Sorghum bicolor (BAF42789), Zea mays (ACG45271), and Pinus radiate (AAC31166)
Analysis of the evolutionary relationship of the CAD ortholog using MEGA5 (Fig. 3) showed that both HcCAD1 and HcCAD2 were closely correlated with Gossypium hirsutum (GhCAD1, ABZ01817). GhCAD1 was classified as Class III, having high similarity with Populus tremuloides (PtSAD, AAK58693) and AtCAD1 (At4g39330), and was involved in a compensatory mechanism for the biosynthesis of coniferyl alcohol (Bomati and Noel 2005). AtCAD1 was also classified as Class III and catalyzed the reduction of cinnamaldehyde, sinapaldehyde, and coniferaldehyde, as well as several aliphatic aldehydes and various substituted benzaldehydes. GhCAD1 also used sinapaldehyde and coniferaldehyde as substrates for conversion into their corresponding alcohols (Fan et al. 2009). Thus, the HcCAD2 protein might have a similar function as GhCAD1 and AtCAD1. Overall, the cloned putative CAD ortholog of kenaf might belong to a CAD enzyme. Hence, CAD was named (ADK24218) HcCAD1 and (KM044582) HcCAD2.
Enzyme Activity of the Recombinant HcCAD2
To characterize the HcCAD2 enzyme activity, recombinant protein was expressed in an E. coli system and purified using Ni-TNA resin, after which its catalytic activity toward three probable substrates was examined (Table 1). The highest catalytic characteristics were determined based on the Km, Vmax, and Kenz (Kcat/Km, the calculated catalytic efficiency) values. The results suggested that HcCAD2 protein had the highest catalytic efficiency (Kcat/Km) toward coniferyl aldehyde and relatively higher efficiency toward sinapyl aldehyde than cinnamyl aldehyde. In other words, preferable substrates of HcCAD2 were coniferyl and sinapyl aldehydes. Although benzyl aldehyde was also tested, no activity was found (data not shown). As expected from phylogenetic analysis, HcCAD2 exhibited a similar preference for substrates as AtCAD1 and GhCAD1. Taken together, these results indicate that HcCAD2 is a bona fide CAD enzyme that is prominently involved in the lignin biosynthesis pathway.
Table 1. Kinetic Parameters of the Recombinant HcCAD2 Protein
Each value calculated using 3 independent replicates; the means ± standard errors are shown.
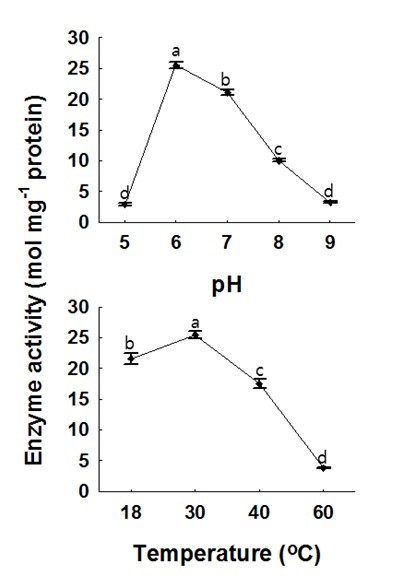 |
Fig. 4. Effects of pH and temperature on recombinant HcCAD2 activity. Coniferyl aldehyde and NADPH were employed as substrates, and phosphate potassium buffer (200-mM) was used. For the pH assay, the temperature was 30 °C, while the pH was 6.0 for the temperature assay. Prior to the reaction, mixtures were kept in a water bath for 15 min, after which the activity was calculated. Each value indicates the mean ± standard error based on three independent replications. The letters on each point reveal significant differences between the mean values (P <0.05)
|
As shown in Fig. 4, the activity of the HcCAD2 enzyme was vulnerable to pH and temperature. HcCAD2 exhibited the highest enzyme activity at pH 6.0, and this level of activity was maintained up to pH 7.0; however, the activity abruptly declined at pH 8.0 and the enzyme appeared to become completely inactive at pH 9.0 and pH 5.0. These results indicate that the activity of the HcCAD2 enzyme is rigorously controlled by pH. According to the optimal pH determined in this study, the enzyme is suitable for cytosolic localization as identified in wheat (Ma 2010). However, contrary to the wheat CAD enzyme, the optimal activity of HcCAD2 was observed at 30 °C. This might have occurred because HcCAD is more stable than wheat CAD enzyme.
Histochemical Analysis of Lignin Distribution during Kenaf Stem Development
Lignin deposition patterns in kenaf stems were observed during developmental stages by staining with phloroglucinol (Fig. 5). The lignin in the stem tissues primarily accumulated in xylem, but not phloem sieve tube cells or parenchyma, in bark. In bark tissues, sclerenchyma fibers were only stained on the outer part of the phloem, indicating that large amounts of lignin were deposited in the tracheary vessels and fibers. Lignin was gradually distributed during the developmental stages in kenaf stem, with high accumulation occurring for up to 4 weeks (Fig. 5A); however, little change was observed from week 4 to 8 (Fig. 5B). Lignin deposition appeared to be completed at 16 to 20 weeks (Figs. 5C and D).
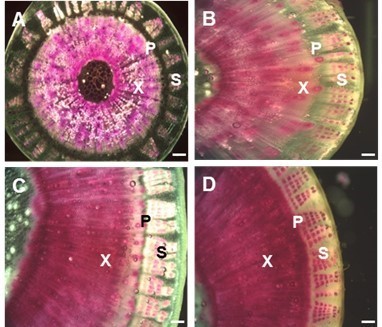
Fig. 5. Histochemical analysis of lignin during developmental stages of kenaf stem. Cross sections of stems were dissected from various aged plants (4, 8, 16, and 20 weeks after sowing). In each stage, lignin deposition was stained by phloroglucine-HCl (red color). (A) 4-week-old stem, (B) 8-week-old stem, (C) 16-week-old stem, and (D) 20-week-old stem. Abbreviations: X, xylem; P, phloem; S, sclerenchyma. Bar = 250 µm.
Expression Patterns of Hccad1 and Hccad2 Transcripts during Developmental Stages and in Various Tissues
For comparative analysis of HcCAD1 and HcCAD2 transcripts, expression patterns were investigated during developmental stages and in various tissues (Fig. 6). The transcript levels of HcCAD1 and HcCAD2 were highly up-regulated for up to 3 and 4 weeks, respectively. The HcCAD2 transcript level was much higher than that of HcCAD1. However, the transcript levels of HcCAD1 and HcCAD2 sharply declined at weeks 4 and 8, respectively. Although the HcCAD2 level was recovered to a certain level at week 16 and 20, the HcCAD1 level did not change significantly (Fig. 6A). These expression patterns were consistent with those of previous studies of the kenaf genes involved in lignin biosynthesis (HcPAL, HcC4H, HcCCoAOMT, HcHCT, HcC3H, HcF5H, HcCOMT, and HcCCR2) (Choi et al. 2012; Chowdhury et al. 2012; Ghosh et al. 2012; Jeong et al. 2012; Chowdhury et al. 2013; Kim et al. 2013a,b,c; Ghosh et al. 2014). As shown in Fig. 5, histochemical analysis revealed that lignin accumulation occurred until week 4 in the stem tissues (data not shown for earlier stages), with no significant change occurring at week 8. These findings are in accordance with the expression patterns of HcCAD transcripts. Further lignin accumulation was detected in 16- and 20-week-old stem tissues (Fig. 5). Despite the low expression levels of the transcripts in later stages (8 to 20 weeks), vigorous lignification was detected, possibly due to the cumulative accumulation of lignin and/or posttranslational regulation of the enzyme activity.
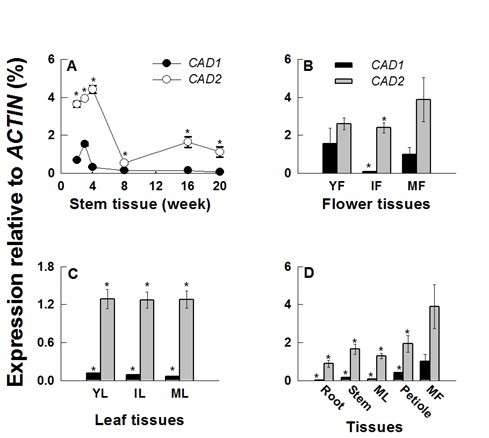
Fig. 6. Expression patterns of kenaf CAD orthologs (HcCAD1 and HcCAD2) during developmental stages and in various tissues. The expression levels of HcCAD1 and HcCAD2 were measured using Real-time PCR and calculated relative to the ACTIN transcript. The expression levels were determined after deduction of the expression level of the control transcript. (A) The expression patterns of HcCAD1 and HcCAD2 during stem development (2, 3, 4, 8, 16, and 20 weeks after sowing). (B) The expression patterns of HcCAD1 and HcCAD2 during flower development (YF, young flower; IF, immature flower; MF, mature flower). (C) The expression patterns of HcCAD1 and HcCAD2 during leaf development (YL, young leaf; IL, immature leaf; ML, mature leaf). (D) The expression patterns of HcCAD1 and HcCAD2 in various tissues from 16-week-old plants. Each value indicates the mean ± standard error based on three biological replications. Probability values between HcCAD1 and HcCAD2 expression were determined by a student’s t-test. Significant differences (P <0.05) are indicated by an asterisk (*).
The expression of HcCAD2 in flower tissues was always higher than that of HcCAD1, with the highest level occurring in mature flowers (MF) (Fig. 6B). The HcCAD1 level was highest in young flowers (YF) and lowest in immature flowers (IF). The expression level was consistent during leaf development, with higher levels of HcCAD2 than HcCAD1 occurring (Fig. 6C). The transcript levels of different tissues were measured in 16-week-old plants (Fig. 6D), at which time they were always higher in HcCAD2 than HcCAD1. While the highest levels of the two transcripts were observed in mature flowers (MF), the lowest levels were detected in the roots. Low levels of HcCAD1 transcript were detected in roots, mature leaves (ML), and stems, indicating that HcCAD transcripts play a role in lignifying tissues and generating compounds, which is dependent on the developmental stage and tissue type. In Arabidopsis, a considerable amount of phenylpropanoid-derived compounds, including sinapate esters and flavonoids, were accumulated in flower, seed, and silique (Chapple et al. 1994). Blanco-Portales et al. (2002) reported that in strawberry, Fxacad1 was expressed in fruit, runners, leaves, and flowers but not in roots, suggesting that the CAD1 enzyme might be associated with the lignification process with regard to both vasculature development and achene maturation. Overall, HcCAD transcripts were highly expressed during the early stage of stem elongation and mature stage of flower development and consistently expressed during leaf development.
Expression Patterns of Hccad1 and Hccad2 Transcripts under Various Abiotic Stress Conditions
Plants are inevitably subjected to abiotic and biotic stresses throughout their life span. Accordingly, they must develop intracellular defense mechanisms such as changes in gene expression, synthesis of defensive molecules (phytoallexins, phytohormones, and antioxidant enzymes), and lignification for cell-wall reinforcement (Moura et al. 2010). Hormone signaling cascade and reactive oxygen species (ROS) signaling pathways are prerequisite to various biotic and abiotic stress responses. In this study, HcCAD1 and HcCAD2 expression patterns were studied in 3-week-old seedlings after exposure to MeJA, cold, H2O2, SA, ABA, wounding, NaCl, and drought. With the exception of the MeJA and drought treatments, HcCAD2 was always expressed at higher levels than HcCAD1 (Fig. 7).
Wound treatment caused the accumulation of HcCAD1 1 h after treatment, after which the transcript was reduced to the basal level. HcCAD2 exhibited the highest induction at 6 h, but was reduced at later times. The transcript level of HcCAD2 was always higher than that of HcCAD1, except at 1 h. Mechanical wounding triggered the induction of genes involved in lignin synthesis, including CAD, leading to lignin deposition around the wound sites (Moura et al. 2010). The induction of CAD transcript by wounding has been reported in other plant species (alfalfa, ryegrass, sweet potato) (Brill et al. 1999; Lynch et al. 2002; Kim et al. 2010). IbCAD1 transcript, classified as a defense-related CAD in sweet potato, was highly upregulated 1 h after wounding and was maintained until 24 h after treatment in root tissues.
In cold treatment, the highest level of the two transcripts was observed at 6 h, with much higher levels being observed in HcCAD2 than HcCAD1 (more than fivefold). Two transcripts were reduced at later times. The HcCAD2 transcript level was always higher than that of HcCAD1. Similar expression patterns were reported in Jatropha curcas L. (Gao et al. 2013). The transcript was significantly up-regulated 5 h after 4 °C chilling treatment. Cold acclimation also induced the genes involved in lignin biosynthesis in soybean and winter barley (Janská et al. 2011). Moreover, exposure to extremely low temperatures activated the phenylpropanoid pathway, causing changes in gene expression and metabolites, including lignin (Wei et al. 2006).
NaCl treatment highly up-regulated HcCAD2 at 6 h, while HcCAD1 expression was not significantly affected by NaCl. The HcCAD2 transcript level was down-regulated at 12 and 24 h, then up-regulated at 48 h. Sweet potato calli overexpressing IbLEA14 (Ipomoea batatas late embryogenesis abundant 14) showed increased CAD expression when treated with 300-mM NaCl (Park et al. 2011). It has been reported that excess salinity in soil stimulates the accumulation of lignin and the alteration of components in the roots of various plants such as soybean, maize, and tomato (Sanchez-Aguayo et al. 2004; Neves et al. 2010). These results indicate that lignification plays a crucial role in plants’ resistance to salt stress.
SA treatment also highly up-regulated HcCAD2 at 6 h, while no change was observed in HcCAD1. Among the various treatments, the highest induction relative to the control was observed in HcCAD2 at 6 h in response to SA treatment, and the expression patterns were similar to those of NaCl responses. Similar induction was reported in Linum album, in which the genes involved in lignin synthesis (PAL, CCR, and CAD) were highly up-regulated 8 to 12 h after SA treatment (Yousefzadi et al. 2010).
H2O2 treatment caused phenotypic changes (data not shown) with high inductions of both HcCAD1 and HcCAD2. Among the various treatments, the second highest induction relative to the control was observed in HcCAD2 at 6 h after exposure to H2O2. Kim et al. (2010) reported that the IbCAD1 transcript was significantly increased 12 and 24 h after H2O2 treatment in sweet potato (Kim et al. 2010). Pathogen infection triggered the activation of the phenylpropanoid pathway to fortify cell-wall rigidity, which was correlated with H2O2 generation at the infected sites (Kostyn et al. 2012). H2O2 played a pivotal role in lignin polymerization. Overall, these findings indicate that HcCADs may play an indispensable role in defense against pathogen infection with H2O2.
ABA treatment induced a biphasic expression pattern of HcCAD2 transcript with high induction at 6, 24, and 48 h and temporary reduction at 12 h. The induced biphasic expression pattern was also detected in HcCCoAOMT with MeJA treatment and 4CL1/4CL2 transcripts in Arabidopsis thaliana with wound treatment (Ghosh et al. 2012). This biphasic expression pattern suggests that HcCAD2 is involved in multiple ABA signaling pathways. However, HcCAD1 was not significantly changed by ABA treatment. It is well-known that ABA is involved in abiotic signal cascades such as those associated with drought and salt stress. In the IbCAD1 promoter region, phytohormone-binding sites such as ABRE for ABA, ARR for cytokinin, and as-1 element for auxin/SA have been identified (Yokoyama et al. 2007). Additionally, IbCAD1 promoter exhibited increased activity in response to ABA, BA, JA, and SA treatments (Kim et al. 2010). The ABA responsive motif was also found in the Populus CAD promoter region (Barakat et al. 2009). Taken together, these findings suggest that the CAD gene is intimately related to ABA signaling.
MeJA treatment generated similar expression patterns in HcCAD1 and HcCAD2, which exhibited high induction at early (1 h) and late time points (48 h) and declination at intermediate time points (6 to 24 h). Sun et al. (2013) reported that MeJA treatment stimulated the expression of CAD1 and CAD2 transcripts in Plagiochasma appendiculatum and that these transcripts played equivalent roles in both lignin biosynthesis and resistance against stresses.
Drought treatment caused higher induction in HcCAD1 than in HcCAD2 at all times. HcCAD1 was highly up-regulated at 14 d, while HcCAD2 was gradually reduced during treatment. These results indicate that HcCAD1 is more likely to be involved in the tolerance of water deficiency. The effects of water deficiency on lignin biosynthesis are well known. The aromatic structure of lignin enables plants to prevent transpiration and maintain normal turgor under water-deficient conditions. Inbred maize lines with higher lignin synthesis had greater drought tolerance with induced expression of CAD, COMT, and SAMS (Hu et al. 2009). Similar results have been observed in other plants, such as rice and Citrullus lanatus sp. (Yang et al. 2006; Yoshimura et al. 2008), confirming these findings.
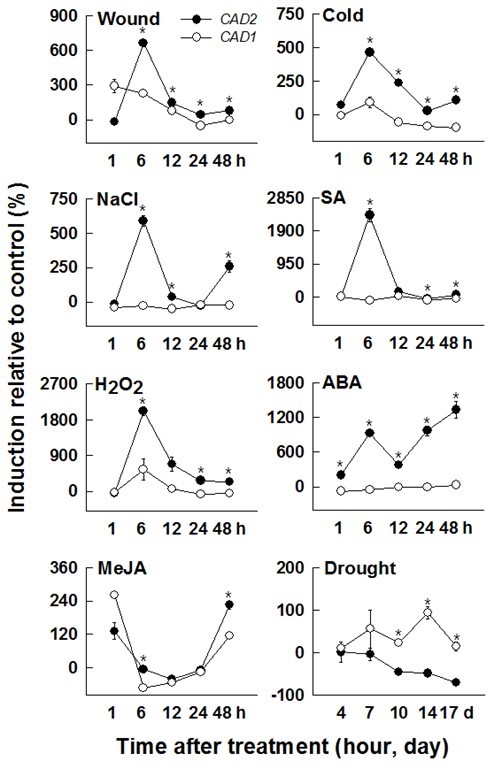
Fig. 7. Expression patterns of kenaf CAD orthologs (HcCAD1 and HcCAD2) under diverse stress conditions. Three-week-old kenaf stems were exposed to different treatments [wound, cold, NaCl, salicylic acid (SA), H2O2, abscisic acid (ABA), methyl jasmonate (MeJA), and drought]. The expression levels of HcCAD1 and HcCAD2 were measured using QPCR and calculated relative to ACTIN transcript. The expression levels were determined after deduction of the expression level of the control transcript. Each value indicates the mean ± standard error with three biological replications. Probability values between HcCAD1 and HcCAD2 expression level were determined by a student’s t-test. Significant differences (P <0.05) are indicated by an asterisk (*)
Comprehensive Analysis of Gene Expression Involved in Lignin Biosynthesis during Developmental Stages of the Kenaf Stem
To better understand lignin synthesis during stem development, it is necessary to analyze overall gene expression patterns. Previously reported gene expression patterns are summarized in Fig. 8. During kenaf stem development, every gene involved in lignin synthesis was highly up-regulated for up to four weeks. Among the genes, HcCCoAOMT and HcCOMT showed the highest expression levels (13- and 32-fold induction relative to kenaf ACTIN, respectively), while other genes were up-regulated by 4- to 7-fold.
COMT catalyzes the conversion of both 5-OH-coniferaldehyde and 5-OH coniferyl alcohol to sinapaldehyde and sinapyl alcohol, respectively (Rastogi and Dwivedi 2008). Down-regulation of COMT resulted in the reduction of total lignin with a low S/G ratio in tobacco, alfalfa, and maize (Li et al. 2008). Thus, the high S/G ratio in kenaf fiber might be attributable to the high HcCOMT transcript level. Another reason for these findings might be the substrate preference of HcCAD enzymes, which have high affinity to sinapyl aldehyde and coniferyl aldehyde.
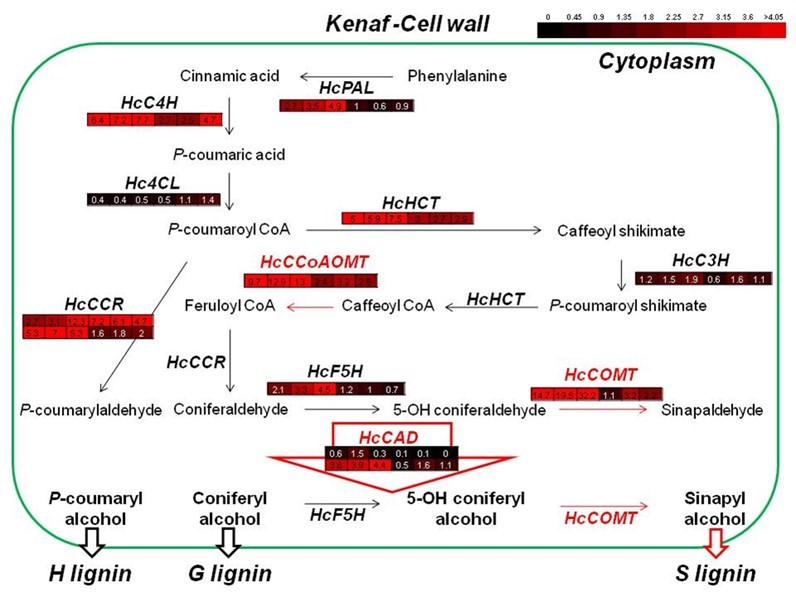
Fig. 8. Comprehensive analysis of gene expression involved in lignin biosynthesis during different developmental stages of kenaf stems. The expression patterns of the genes were previously reported. Each colored box represents the expression level of each gene during different stem developmental stages (2, 3, 4, 8, 16, and 20 weeks after sowing).
Analysis of Composition and Content of Lignin and Sugar during Stem Development
Alkaline nitrobenzene oxidation was applied to characterize the lignin structures in kenaf fibers (Lam et al. 2002). Table 2 shows the yield and components of the phenolic acids and aldehydes obtained from alkaline nitrobenzene oxidation of the six alkali-soluble lignins. The most abundant component of the phenolic monomers was syringaldehyde, which was derived from the degradation of non-condensed S units. The second major degradation product, vanillin, was derived from the degradation of non-condensed G units. The S/G ratio gradually increased during stem development, likely due to the large amount of S units in kenaf fibers. These findings indicate that the linear chains of S units are an indispensable portion of the lignin in kenaf fibers. Four phenolic acids, p-hydroxybenzoic acid, syringic acid, p-coumaric acid, and ferulic acid, were also detected in minor quantities.
The composition and content of the associated polysaccharides in kenaf fibers were determined by the neutral sugar contents (Table 3). High levels of sugars were extracted from kenaf fibers, which is consistent with the results of previous studies (Gutiérrez et al. 2004). Glucose and xylose were found to be the two major sugars (76.5 and 15.8% of the total sugars, respectively). These results indicate that most chemical bonds between lignin and polysaccharides were cleaved during the alkali treatment processes, which might have been due to the high S/G ratio in kenaf fiber (Table 2). Overall, the results indicate that kenaf fiber is a valuable biomass for use in bioethanol production.
Table 2. Analysis of Phenolic Monomers of Nitrobenzene Oxidation Products of Lignin in Kenaf Stems during Developmental Stages
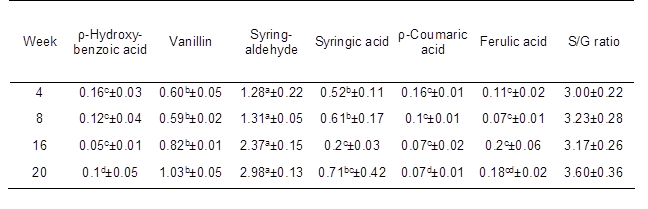
Each value indicates the mean ± standard error based on four independent replications. ρ-hydroxybenzaldehyde and vanillic acid were generated in trace amounts and were below the detection limit. Yield (%): weight of lignin monomer/weight of extractives-free samples. S/G ratio: S represents the total yield of syringe aldehyde and syringic acid, G represents the total yield of vanillin and vanillic acid. Different letters indicate significant differences between the mean values (P < 0.05).
CONCLUSIONS
- The results of this study demonstrate that HcCAD1 and HcCAD1 are indispensable for lignification in various tissues, as well as for defending plants under diverse stress conditions.
- The expression of HcCADs with other genes involved in lignin synthesis can be attributed to condensation of high levels of S lignin during kenaf stem development.
- High levels of usable sugars can be extracted from kenaf fibers, demonstrating the potential for using kenaf fibers as a valuable biomass source for bioethanol production.
ACKNOWLEDGMENTS
This research was supported by the Yeungnam University Research Grant in 214A367017.
REFERENCES CITED
Bae, H., Kim, S.-H., Kim, M. S., Sicher, R. C., Strem, M. D., Natarajan, S., and Bailey, B. A. (2008). “The drought response of Theobroma cacao (cacao) and the regulation of genes involved in polyamine biosynthesis by drought and other stresses,” Plant Physiol. Bioch. 46(2), 174-188. DOI: 10.1016/j.plaphy.2007.10.014
Barakat, A., Bagniewska-Zadworna, A., Choi, A., Plakkat, U., DiLoreto, D. S., Yellanki, P., and Carlson, J. E. (2009). “The cinnamyl alcohol dehydrogenase gene family in Populus: Phylogeny, organization, and expression,” BMC Plant Biol. 9(26), DOI: 10.1186/1471-2229-9-26
Blanco-Portales, R., Medina-Escobar, N., Lopez-Raez, J. A., Gonzalez-Reyes, J. A., Villalba, J. M., Moyano, E., Caballero, J. L., and Munoz-Blanco, J. (2002). “Cloning, expression and immunolocalization pattern of a cinnamyl alcohol dehydrogenase gene from strawberry,” J. Exp. Bot. 53(375), 1723-1734. DOI: 10.1093/jxb/erf029
Bomati, E. K., and Noel, J. P. (2005). “Structural and kinetic basis for substrate selectivity in Populus tremuloides sinapyl alcohol dehydrogenase,” Plant Cell. 17(5), 1598-1611. DOI: 10.1105/tpc.104.029983
Brill, E. M., Abrahams, S., Hayes, C. M., Jenkins, C. L. D., and Watson, J. M. (1999). “Molecular characterisation and expression of a wound-inducible cDNA encoding a novel cinnamyl-alcohol dehydrogenase enzyme in Lucerne (Medicago sativa L.),” Plant Mol. Biol. 41(2), 279-291. DOI: 10.1023/A:1006381630494
Chapple, C. C. S., Shirley, B. W., Zook, M., Hammerschmidt, R., and Somerville, S. C. (1994). “Secondary metabolism in Arabidopsis,” in: Arabidopsis, E. M. Meyerowitz (ed.), Cold Spring Harbor Laboratory Press, Cold Spring Harbor, NY, pp. 989-1030.
Chen, C.-L. (1992). “Nitrobenzen and cupric oxide oxidations,” in: Methods in Lignin Chemistry, Lin, S. Y., and Dence, C. W. (eds.), Springer, Berlin, pp. 301-321. DOI: 10.1007/978-3-642-74065-7_21
Choi, B., Kang, S.-Y., Bae, H.-J., Lim, H.-S., Bang, W.-S., and Bae, H. (2012). “Transcriptional analysis of the ρ-coumarate 3-hydroxylase (C3H) gene from Hibiscus cannabinus L. during developmental stages in various tissues as well as in response to abiotic stresses,” Res. J. Biotech. 7(3), 23-33.
Chowdhury, E. M., Choi, B. S., Park, S. U., Lim, H.-S., and Bae, H. (2012). “Transcriptional analysis of hydroxycinnamoyl transferase (HCT) in various tissues of Hibiscus cannabinus in response to abiotic stress conditions,” Plant Omics 5(3), 305-313.
Chowdhury, M. E. K., Choi, B., Cho, B.-K., Kim, J. B., Park, S. U., Natarajan, S., Lim, H. S., and Bae, H. (2013). “Regulation of 4CL, encoding 4-coumarate: coenzyme A ligase, expression in kenaf under diverse stress conditions,” Plant Omics 6(4), 254-262.
Dempsey, J. M. (1975). Fiber Crops, The University Presses of Gainesville, Gainesville, FL.
Fan, L., Shi, W.-J., Hu1, W.-R., Hao, X.-Y., Wang, D.-M., Yuan, H., and Yan, H.-Y. (2009). “Molecular and biochemical evidence for phenylpropanoid synthesis and presence of wall-linked phenolics in cotton fibers,” J. Integr. Plant Biol. 51(7), 626-637. DOI: 10.1111/j.1744-7909.2009.00840.x
Galliano, H., Cabane, M., Eckerskorn, C., Lottspeich, F., Sandermann, H., and Ernst, D. (1993). “Molecular cloning, sequence analysis, and elicitor-/ozone-induced accumulation of cinnamyl alcohol dehydrogenase from Norway spruce (Picea abies),” Plant. Mol. Biol. 23(1), 145-156. DOI: 10.1007/BF00021427
Gao, J., Jiang, N., Qin, X., Zhu, X., Ai, T., Peng, T., Peng, T., Wu, J., Wu, Y., and Chen, F. (2013). “Physiological and metabolic responses of Jatropha to chilling stress,” Int. J. Agric. Biol. 15(5), 871-877.
Ghosh, R., Choi, B., Jeong, M.-J., Bae, D. W., Shin, S. C., Park, S. U., Lim, H.-S., Kim, J., and Bae, H. (2012). “Comparative transcriptional analysis of caffeoyl-coenzyme A 3-O-methyltransferase from Hibiscus cannabinus L., during developmental stages in various tissues and stress regulation,” Plant Omics 5(2), 184-193.
Ghosh, R., Choi, B., Cho, B.-K., Lim, H.-S., Park, S.-U., Bae, H.-J., Natarajan, S., and Bae, H. (2014). “Characterization of developmental- and stress-mediated expression of Cinnamoyl-CoA Reductase in kenaf (Hibiscus cannabinus L.),” Sci. World J. 2014, 601845. DOI: 10.1155/2014/601845
Gutiérrez, A., Rodríguez, I., and Del Río, J. (2004). “Chemical characterization of lignin and lipid fractions in kenaf bast fibers used for manufacturing high-quality papers,” J. Agri. Food Chem. 52(15), 4764-4773. DOI: 10.1021/jf049540w
Hu, Y., Li, W. C., Xu, Y. Q., Li, G. J., Liao, Y., and Fu, F. L. (2009). “Differential expression of candidate genes for lignin biosynthesis under drought stress in maize leaves,” J. Appl. Genet. 50(3), 213-223. DOI: 10.1007/BF03195675
Janská, A., Aprile, A., Zámecník, J., Cattivelli, L., and Ovesná, J. (2011). “Transcriptional responses of winter barley to cold indicate nucleosome remodelling as a specific feature of crown tissues,” Funct. Integr. Genomic. 11(2), 307-325. DOI: 10.1007/s10142-011-0213-8
Jeong, M.-J., Choi, B. S., Bae, D. W., Shin, S. S., Park, S. U., Lim, H.-S., Kim, J., Kim, J. B., Cho, B.-K., and Bae, H. (2012). “Differential expression of kenaf phenylalanine ammonia-lyase (PAL) ortholog during developmental stages and in response to abiotic stresses,” Plant Omics 5(4), 392-399.
Kim, S. J., Kim, M. R., Bedgar, D., Moinuddin, S. G. A., Cardenas, C. L., Davin, L. B., Kang, C. C. K., and Lewis, N. G. (2004). “Functional reclassification of the putative cinnamyl alcohol dehydrogenase multigene family in Arabidopsis,” Proc. Natl. Acad. Sci. USA 101(6), 1455-1460. DOI: 10.1073/pnas.0307987100
Kim, Y.-H., Bae, J. M., and Huh, G.-H. (2010). “Transcriptional regulation of the cinnamyl alcohol dehydrogenase gene from sweet potato in response to plant developmental stage and environmental stress,” Plant Cell Rep. 29(7), 779-791. DOI: 10.1007/s00299-010-0864-2
Kim, J., Choi, B., Cho, B.-K., Lim, H.-Y., Kim, J. B., Natarajan, S., Kwak, E., and Bae, H. (2013a). “Molecular cloning, characterization and expression of the caffeic acid O-methyltransferase (COMT) ortholog from kenaf (Hibiscus cannabinus),” Plant Omics 6(4), 246-253.
Kim, J., Choi, B., Natarajan, S., and Bae, H. (2013b). “Expression analysis of kenaf cinnamate 4-hydroxylase (C4H) ortholog during developmental and stress responses,” Plant Omics 6(1), 65-72.
Kim, J., Choi, B., Park, Y.-H., Cho, B.-K., Lim, H.-S., Natarajan, S., Park, S.-U., and Bae, H. (2013c). “Molecular characterization of Ferulate 5-Hydroxylase gene from kenaf (Hibiscus cannabinus L.),” Sci. World J. 2013, 421578. DOI: 10.1155/2013/421578
Kostyn, K., Czemplik, M., Kulma, A., Bortniczuk, M., Skała, J., and Szopa, J. (2012). “Genes of phenylpropanoid pathway are activated in early response to Fusarium attack in flax plants,” Plant Sci. 190, 103-115. DOI: 10.1016/j.plantsci.2012.03.011
Lam, T. B. T., Hori, K., and Iiyama, K. (2002). “Structural characteristics of cell walls of kenaf (Hibiscus cannabinus L.) and fixation of carbon dioxide,” J. Wood. Sci. 49, 255-261. DOI: 10.1007/s10086-002-0469-7
Lapierre, C., Pilate, G., Pollet, B., Mila, I., Leple, J. C., Jouanin, L., Kim, H., and Ralph, J. (2004). “Signatures of cinnamyl alcohol dehydrogenase deficiency in poplar lignins,” Phytochem. 65(3), 313-321. DOI: 10.1016/j.phytochem.2003.11.007
Li, X., Weng, J., and Chapple, C. (2008). “Improvement of biomass through lignin modification,” Plant J. 54(4), 569-581. DOI: 10.1111/j.1365-313X.2008.03457.x
Lynch, D., Lidgett, A., Mclnnes, R., Huxley, H., Jones, E., and Mahoney, N. (2002). “Isolation and characterization of three cinnamyl alcohol dehydrogenase homologue cDNAs from perennial ryegrass (Lolium perenne L.),” J. Plant Physiol. 159(6), 653-660
Ma, Q.-H. (2010). “Functional analysis of a cinnamyl alcohol dehydrogenase involved in lignin biosynthesis in wheat,” J. Exp. Bot. 61(10), 2735. DOI: 10.1093/jxb/erq107
McKie, J. H., Jaouhari, R., Douglas, K. T., Goffner, D., Feuillet, C., Grima-Pettenati, J., Boudet, A. M., Baltas, M., and Gorrichon, L. (1993). “A molecular model for cinnamyl alcohol dehydrogenase, a plant aromatic alcohol dehydrogenase involved in lignification,” Biochim. Biophys. Acta. 1202(1), 61-69. DOI: 10.1016/0167-4838(93)90063-W
Moura, J. C., Bonine, C. A., de Oliveira Fernandes Viana, J., Dornelas, M. C., and Mazzafera, P. (2010). “Abiotic and biotic stresses and changes in the lignin content and composition in plants,” J. Integr. Plant Biol. 52(4), 360-376. DOI: 10.1111/j.1744-7909.2010.00892.x
Neves, G. Y. S., Marchiosi, R., Ferrarese, M. L. L., Siqueira-Soares, R. C., and Ferrarese-Filho, O. (2010). “Root growth inhibition and lignifications induced by salt stress in soybean,” J. Agron. Crop Sci. 196(6), 467-473. DOI: 10.1111/j.1439-037X.2010.00432.x
Pande, H., and Roy, D. N. (1996). “Delignification kinetics of soda pulping of kenaf,” J. Wood. Chem. Technol. 16(3), 311-325. DOI: 10.1080/02773819608545811
Park, S. C., Kim, Y. H., Jeong, J. C., Kim,.C. Y., Lee, H. S., Bang, J. W., and Kwak, S. S. (2011). “Sweet potato late embryogenesis abundant 14 (IbLEA14) gene influences lignification and increases osmotic- and salt stress-tolerance of transgenic calli,” Planta 233(3), 621-634.
Ralph, J., Lapierre, C., Marita, J. M., Kim, H., Lu, F., Hatfield, R. D., Ralph, S., Chapple, C., Franke, R., Hemm, M. R., et al. (2001). “Elucidation of new structures in lignins of CAD- and COMT-deficient plants by NMR,” Phytochem. 57(6), 993-1003. DOI: 10.1016/S0031-9422(01)00109-1
Rastogi, S., and Dwivedi, U. (2008). “Manipulation of lignin in plants with special reference to O-methyltransferase,” Plant Sci. 174(3), 264-77. DOI: 10.1016/j.plantsci.2007.11.014
Sanchez-Aguayo, I., Rodriguez-Galan, J. M., Garcia, R., Torreblanca, J., and Pardo, J. M. (2004). “Salt stress enhances xylem development and expression of S-adenosyl-L-methionine synthase in lignifying tissue of tomato plants,” Planta 220(2), 278-285. DOI: 10.1007/s00425-004-1350-2
Sun, Y., Wu, Y., Zhao, Y., Han, X., Lou, H., and Cheng, A. (2013). “Molecular cloning and biochemical characterization of two cinnamyl alcohol dehydrogenases from a liverwort Plagiochasma appendiculatum,” Plant Physiol. Biochem. 70, 133-141. DOI: 10.1016/j.plaphy.2013.05.027
TAPPI (1992). “TAPPI Test Methods,” TAPPI Press, Atlanta, GA.
Vallee, B. L., and Aulds, D. S. (1990). “Zinc coordination, function and structure of zinc enzymes and other proteins,” Biochem. 29(24), 5647-5659. DOI: 10.1021/bi00476a001
Wei, H., Dhanaraj, A. L., Arora, R., Rowland, L. J., Fu, Y., and Sun, L. I. (2006). “Identification of cold acclimation-responsive Rhododendron genes for lipid metabolism, membrane transport and lignin biosynthesis: importance of moderately abundant ESTs in genomic studies,” Plant Cell Environ. 29(24), 558-570. DOI: 10.1111/j.1365-3040.2005.01432.x
Wi, S. G., Kim, H. J., Mahadevan, S. A., Yang, D, J., and Bae, H. J. (2009). “The potential value of the seaweed Ceylon moss (Gelidium amansii) as an alternative bioenergy resource,” Bioresour. Technol. 100(24), 6658-6660. DOI: 10.1016/j.biortech.2009.07.017
Yang, L., Wang, C. C., Guo, W. D., Li, X. B., Lu, M., and Yu, C. L. (2006). “Differential expression of cell wall related genes in the elongation zone of rice roots under water deficit,” Rus. J. Plant Physiol. 53(3), 390-395. DOI: 10.1134/S1021443706030150
Yokoyama, A., Yamashino, T., Amano, Y. I., Tajima, Y., Imamura, A., Sakakibara, H., and Mizuno, T. (2007). “Type-B ARR transcription factors, ARR10 and ARR12, are implicated in cytokinin-mediated regulation of protoxylem differentiation in roots of Arabidopsis thaliana,” Plant Cell Physiol. 48(1), 84-96. DOI: 10.1093/pcp/pcl040
Yoshimura, K., Masuda, A., Kuwano, M., Yokota, A., and Akashi, K. (2008). “Programmed proteome response for drought avoidance/tolerance in the root of a C-3 xerophyte (wild watermelon) under water deficits,” Plant Cell Physiol. 49(2), 226-241. DOI: 10.1093/pcp/pcm180
Youn, B., Camacho, R., Moinuddin, S.G.A., Lee, C., Davin, L. B., Lewis, N. G., and Kang, C. (2006). “Crystal structures and catalytic mechanism of the Arabidopsis cinnamyl alcohol dehydrogenases AtCAD5 and AtCAD4,” Org. Biomol. Chem. 4, 1687-1697. DOI: 10.1039/b601672c
Yousefzadi, M., Sharifi, M., Behmanesh, M., Ghasempour, A., Moyano, E., and Palazon, J. (2010). “Salicylic acid improves podophyllotoxin production in cell cultures of Linum album by increasing the expression of genes related with its biosynthesis,” Biotechnol. Lett. 32(11), 1739-1743. DOI: 10.1007/s10529-010-0343-4
Article submitted: June 10, 2015; Peer review completed: July 2, 2015; Revisions received: October 21, 2015; Revisions accepted: October 24, 2015; Published: November 9, 2015.
DOI: 10.15376/biores.11.1.105-125