
Abstract
To reduce the fluctuation of the heat source water temperature and ambient temperature caused by variations in solar radiation, a solar absorption refrigeration system with a supplementary biomass combustion device for the office area of a factory was designed. A numerical model of the solar energy absorption refrigeration system based on the Aspen Plus software was developed. In particular, the effects of the heat source water temperature, condenser temperature, evaporation temperature, and dilute solution flow rate on the cooling capacity, coefficient of performance, unit equipment duty, and generator temperature during actual operation were investigated. The heat load of each piece of equipment in the unit were found to increase correspondingly with the increase of the heat source temperature when the evaporating temperature and condensing temperature are constant. The coefficient of performance of the unit decreased as the condensing temperature increased keeping the temperature of the heat source constant. The results demonstrated that the flow rate of the dilute solution has effects on the occurrence temperature, cooling capacity, and the unit performance coefficient.
Download PDF
Full Article
Influence of Disturbances in the Operating Conditions on the Refrigeration Performance of a Regenerative Solar Absorption Refrigeration System with a Biomass Assisted Combustion Device
Dongmei Bi,a,* Fupeng Huang,a Kaizhen Zhang,a Haiquan Sun,b Yongjun Li,a Shanjian Liu,a and Xiulian Yin c
To reduce the fluctuation of the heat source water temperature and ambient temperature caused by variations in solar radiation, a solar absorption refrigeration system with a supplementary biomass combustion device for the office area of a factory was designed. A numerical model of the solar energy absorption refrigeration system based on the Aspen Plus software was developed. In particular, the effects of the heat source water temperature, condenser temperature, evaporation temperature, and dilute solution flow rate on the cooling capacity, coefficient of performance, unit equipment duty, and generator temperature during actual operation were investigated. The heat load of each piece of equipment in the unit were found to increase correspondingly with the increase of the heat source temperature when the evaporating temperature and condensing temperature are constant. The coefficient of performance of the unit decreased as the condensing temperature increased keeping the temperature of the heat source constant. The results demonstrated that the flow rate of the dilute solution has effects on the occurrence temperature, cooling capacity, and the unit performance coefficient.
DOI: 10.15376/biores.17.1.144-158
Keywords: Absorption refrigeration unit; Coefficient of performance (COP); Operating conditions disturbances; Refrigeration performance; Solar
Contact information: a: School of Agricultural Engineering and Food Science, Shandong University of Technology, Zibo 255000 China; b: School of New Energy Engineering, Weifang Institute of Technology, Weifang 262500 China; c: School of Life Science and Food Engineering, Jiangsu Provincial Engineering Laboratory for Biomass Conversion and Process Integration, Huaiyin Institute of Technology, Huai’an 223003 China; *Corresponding author: dongmei070719@163.com
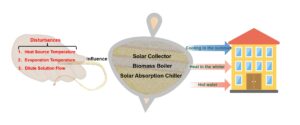
GRAPHICAL ABSTRACT
INTRODUCTION
Solar air conditioners are popular in the market owing to their many advantages, e.g., energy savings, environmental protection, compensating for seasonal variations, etc. (Iffa et al. 2017). Hence, the technology and application of solar air conditioners have rapidly developed in recent years (Wu et al. 2017). Solar absorption refrigeration technology has dominated in the application of solar refrigeration technology due to its high refrigeration efficiency, being able to compensate for seasonal variations, and low temperature requirements for heat sources (Siddiqui and Said 2015; Parvez et al. 2020). However, the operation performance of the absorption refrigeration unit is affected when the operation conditions vary due to the instability of solar energy (Fitó et al. 2018). To understand the changes in the refrigeration performance of the unit and reduce operation costs, it is necessary to investigate the dynamic performance of the system under different operating conditions. Hence, it is important to optimize the operation of solar air conditioning systems (Ma et al. 2018). Agyenim et al. (2010) designed a LiBr-water absorption solar cooling system and tested the import and export fluid temperature, mass flow, and ambient temperature. The results showed that the average coefficient of performance (COP) of the system was 3.6, and the cooling water temperature was as low as 7 °C. This demonstrated that the system could meet the requirements for cooling. Biomass is a kind of environment-friendly, low-cost renewable energy, and its rational utilization is conducive to realizing low-carbon economy (Wang et al. 2021; Liu et al. 2021). Prasartkaew and Kumar (2013) conducted an experimental test and a small solar air conditioning system with a biomass gasification furnace was used as an auxiliary heat source. The biomass energy gasification device was used to heat hot water after the storage of solar energy with a tank heat collecting system. The findings indicated that the addition of a biomass-assisted heat source could improve the system performance.
There are many components and fluid media involved in the operation of an absorption refrigeration device, e.g., a LiBr solution, hot source water, chilled-water, cooling water, etc. Therefore, it is necessary to study the changes in the system performance under different conditions based on modeling and simulations; such approaches not only can reduce the manufacturing and test costs, but they also can obtain a better scheme (Gkouletsos et al. 2019). Mansouri et al. (2018) carried out a study on a small capacity diffusion-absorption refrigeration unit using a stationary model and found that the absorption refrigeration unit had optimal operating conditions at a generator temperature of 167 °C. A simulation model of the refrigerator based on the Aspen Plus software was established. The deviations between the model predictions and the experimental measurements were less than 1% under the same input conditions. Wang et al. (2016) built a model of a single-effect LiBr absorption refrigeration circulation system based on the Aspen Plus software. It was reported that the difference between the input and output energy of the system would be higher than the increase of the heat source temperature under a certain evaporation temperature range. As a result, the total loss of energy of the system was increased. Therefore, ensuring a reasonable match between the heat source and the absorbent refrigeration could effectively reduce the loss of the heat source.
The goal of the present work was to develop a set of solar air-conditioning systems with a supplemental biomass combustion device, providing hot water in domestic settings in all seasons using solar energy. In addition, a simulation model based on the Aspen Plus software was established (Su et al. 2017). The purpose was to study the effects of temperature disturbance of the heat source water, condenser temperature, evaporation temperature, and dilute solution flow rate on system cooling capacity and system coefficient of performance, which provides a theoretical basis for the improvement of system performance and optimization design in the future.
PROCESS CONSTRUCTION AND SIMULATION
Process Description
The solar absorption air conditioning refrigeration system (as shown in Fig. 1) consisted of a lithium bromide (LiBr) absorption refrigerator as the cold source, a hot water system, a cooling water circulation system, and a refrigerant water system (Kim and Ferreira 2008). The hot water system consisted of a solar collector and an auxiliary biomass combustion boiler. The operation processes were as follows: the solar collector (the supplemental combustion device) heats the water in the circulating water pump and stores it in the hot water tank. When the temperature of the water tank reaches the set requirement, the valve opens, and the water in the hot water tank flows into the LiBr refrigerator as the driving heat source. The generated cooling capacity is passed from the refrigerant water system to the users for refrigeration purposes, and the absorption heat generated by the refrigerator is discharged by the cooling water system.
In this study, an auxiliary biomass combustion boiler was added to reduce the influence of climatic conditions on the performance of the solar absorption refrigeration system and ensure the normal operation of the system. When solar radiation was insufficient during the day or refrigeration capacity was needed at night, the control system would start the auxiliary biomass combustion boiler and hot water would be generated to ensure the continuous and stable operation of the entire system and meet the refrigeration or heating requirements of the user.

Fig. 1. Process of a solar absorption air conditioning refrigeration system
This system can transform both biomass energy and solar energy to cool in the summer, heat in the winter, and provide hot water year-round. During the summer, a LiBr absorption chiller is used for cooling, which is driven by the collected solar energy or 7 °C chilled water generated from the biomass boiler, and the room was cooled by a fan coil. During the winter, circulating water was first heated by the solar collector or the biomass boiler, and it then circulated through a pump when the temperature was heated from 35 to 45 °C to heat the room via a terrestrial heating pipe or fan coil. Year-round, the supplying hot water was heated by a solar collector or biomass boiler until temperatures up to 50 °C.
The model of the bromine cold unit used in the test was an RXZ-115 absorbent chiller, which was produced by Luxi New Energy Co., Ltd (Shandong, China). It had a rated cooling capacity of 115 kW, and the main frame included a LiBr unit, computer control box, vacuum pump, and hot water electric regulation valve. The minimum driving temperature of the hot water was 75 °C. The fouling coefficient of the cooling water and refrigerant water was 0.086 m2·h·℃/kW. The standard pressure of the cooling water chamber and refrigerant water chamber was lower than 0.8 MPa. The primary technical parameters of the unit are shown in Table 1. The LiBr absorption chiller was equipped with a vacuum pump. Various parameters, e.g., the temperature of the hot water, cooling water inlet, and refrigerant water outlet, could be displayed on the panel of the control cabinet.
In the test, the solar central air-conditioning system required a high temperature circulating medium, fast heat transfer, and stable operation throughout the year. Through comprehensive comparison, the metal thermal tube solar vacuum heat collection tube met these requirements (Assilzadeh et al. 2005). The total lighting area of this test platform was 560 m2.
The cooling tower and the cooling coil in the solar energy absorption refrigeration system are important components (Hosoz et al 2011). The cooling tower is a device that cools the water in the system through a comprehensive heat and mass exchange process. The cooling coil is used to exchange heat with the air outside the system to meet the required temperature and humidity.
Table 1. RXZ-115 Absorption Chiller Technical Parameters

The cooling coil and fresh air were used for heat exchange to convert the cooling capacity into a measurable temperature and potential humidity so that the air outside the system could reach the required temperature and humidity. The cooling water flowed from top to bottom in the cooling tower, and the air flowed from bottom to top or horizontally in the tower, taking heat away from the water via the evaporation of water and the heat transfer of air.
Model of the Absorption Refrigeration Cycle
A schematic diagram of the cycle of a LiBr absorption refrigeration system is shown in Fig. 2.
Assumption for calculation of the model
The absorption refrigeration cycle is a process of heat and mass transfer. In order to simplify the calculation of this model, the following assumptions were made (Hui et al. 2017): a) the outlet of the evaporator was saturated steam, and the outlet of the condenser was saturated water; b) the generating pressure was the same as the condensing pressure and the absorption pressure was the same as the evaporation pressure; c) there was no driving force for mass transfer in the process of occurrence and absorption, i.e., there was no inadequate response and insufficient absorption; d) there was no heat loss in each device; and e) the power consumed by the solution pump was ignored.

Fig. 2. Cycle diagram of LiBr absorption refrigeration system
Mathematical Model of the LiBr Absorption Refrigeration System
According to the heat and mass transfer equations and the conservation equations of energy and mass, the mathematical model of each component of the absorption refrigeration system could be obtained. The solar heating power is shown in Eq. 1,
 (1)
(1)
where μ is the average heat collecting efficiency of the solar collector (%), Ac is the heat collecting area of the solar collector (m2), and Jc is the solar radiation intensity (W/m2).
The energy conservation equation of the hot water tank is shown in Eq. 2,
 (2)
(2)where Mh is the mass of water in the hot water tank (kg), T0 and T1 are the inlet and outlet temperatures of the hot water in the water tank, respectively (K), mh is the mass of the heated hot water (kg), q is the solar heating power (kW), and Cpw is the specific heat of water at a constant pressure (kJ/(kg·K)).
The biomass combustion in the supplemental combustion device is shown in Eq. 3,
 (3)
(3)
where Qh is the effective heating capacity of the supplemental combustion device (W), is the mass flow rate of the hot water (kg/s), QMAX,h is the maximum heating power of the supplemental combustion device (kW), ηh is the efficiency of the supplemental combustion device, Uh is the total heat loss coefficient of the supplemental combustion device (W/K), and T is the ambient temperature (K).
Generator
The energy conservation equation is shown in Eq. 4, the solution mass conservation equation is shown in Eq. 5, the heat transfer equation is shown in Eq. 6, the venting range is shown in Eq. 7, and the circulation ratio is shown in Eq. 8,

where Mg is the total mass of the solution in the generator (kg), qm7 is the mass flow rate of the solution flowing into the generator (kg/s), qm4 is the mass flow rate of the solution flowing out of the generator (kg/s), qm5’ is the mass flow of steam out of the generator (kg/s), ug,v is the specific internal energy of the solution in the generator (J/kg), h7 is the specific enthalpy of the solution flowing into the generator (J/kg), h4 is the specific enthalpy of the solution of flowing out of the generator (J/kg), h7’ is the specific enthalpy of the steam flowing out of the generator (J/kg), and ξa and ξw represent the concentration of LiBr concentrated solution and dilute solution (mol/L), respectively.
Condenser
The energy conservation equation is shown in Eq. 9. The mass conservation equations are shown in Eqs. 10 and 11, and the heat transfer equation is shown in Eq. 12,

where Mc,v is the total mass of the steam in the condenser (kg), Mc,w is the total mass of the solution in the condenser (kg), is the mass flow of the gas flowing into the condenser (kg/s), qm3 is the mass flow of the liquid flowing out of the condenser (kg/s), is the mass flow of the steam flowing into the condenser which is converted to the liquid part (kg/s), uc,v is the specific internal energy of the solution in the condenser (J/kg), h5’ is the specific enthalpy of the gas flowing into the condenser (J/kg), and hc,w is the specific enthalpy of the steam flowing into the condenser which is converted to the liquid part (J/kg).
Evaporator
The energy conservation equation is shown in Eq. 13, the mass conservation equations are shown in Eqs. 14 and 15, and the heat transfer equation is shown in Eq. 16,


where Me,w is the total mass of the solution in the evaporator (kg), Me,v is the total mass of the steam in evaporator (kg), qm1 is the mass flow of the liquid flowing into the evaporator (kg/s), qm1’ is the mass flow rate of the gas flowing out of the evaporator (kg/s), is the internal energy of the liquid flowing into the evaporator (J/kg), ue,v is the specific internal energy of the liquid flowing into the evaporator that absorbs heat and changes into the gas portion (J/kg), h1’ is the specific enthalpy of the liquid flowing into the evaporator (J/kg), and he,w is the specific enthalpy of the liquid flowing into the evaporator (J/kg).
Absorber
The energy conservation equation is shown in Eq. 17, the mass conservation equations are shown in Eq. 18, 19, and 20, and the heat transfer equation is shown in Eq. 21,

where Ma is the total mass of the solution in the absorber (kg), is the mass flow rate of the vapor flowing into the absorber (kg/s), is the mass flow rate of the concentrated solution flowing into the absorber (kg/s), is the mass flow rate of the dilute solution flowing out of the absorber (kg/s), ua s the internal energy of the solution in the absorber (J/kg), is the specific enthalpy of the concentrated solution flowing into the absorber (J/kg), is the specific enthalpy of the vapor flowing into the absorber (J/kg), and h2 is the specific enthalpy of the dilute solution flowing out of the absorber (J/kg).
Solution heat exchanger
The energy conservation equations are shown in Eq. 22 and Eq. 23, and the heat transfer equation is shown in Eq. 24,

where Tex,a is the temperature of the concentrated solution (K), Tex,w is the temperature of the dilute solution (K), Vex is the specific volume of the heat exchanger (m3/kg), cp,ex,a is the specific heat capacity of the concentrated solution (kJ/(kg·K)-1), cp,ex,w is the specific heat capacity of the dilute solution (kJ/(kg·K)-1), ρex,a is the density of concentrated solution (kg/m3), ρex,w is the density of dilute solution (kg/m3), qma is the mass flow of concentrated solution (kg/s), and  is the mass flow of dilute solution (kg/s).
RESULTS AND DISCUSSION
Simulation of the Solar Absorption Refrigeration Air Conditioning System
Aspen Plus software (V11 (37.0.0.395), AspenTech, Bedford, MA) was used to establish the absorption refrigeration process. The modules corresponding to each device in the cycle are shown in Table 2 (Liang et al. 2017). The selection of the physical property method is a key step in the simulation, which is very important for the accuracy of the simulation results (Mansouri et al. 2015). In this simulation, the ELECNRTL physical property method was used (Yang et al. 2019). The model can describe electrolyte aqueous solution systems and mixed solvent electrolyte systems at the whole electrolyte concentration range.
Table 2. Equipment Unit Operation Module

Two Heater modules of condenser and evaporator were selected for simulation, respectively, and the selection pressure and the fraction of gas phase were initially specified. The process of the two-phase separation was carried out in the generator after the absorption of the dilute solution, and the Flash2 and Heater modules were selected. The fraction of gas phase and the generating pressure were initially specified. The Heat X module was used for the solution of the heat exchanger. The temperature difference between the outlet of heat flow and the outlet of cold flow were initially specified. Mix and Heater modules were selected for the absorber. The initial provisions of Mix and Heater were the pressure and the fraction of gas phase, respectively. Pump and Valve modules were selected for solution pump and throttle valve, respectively, and the flow pressure of the equipment was initially specified.
According to the selected unit operation modules, a simulation flow chart based on the Aspen Plus software was built according to the schematic diagram of the LiBr absorption refrigeration system, as shown in Fig. 3.
Each stream and simulation result of the absorption chiller is shown in Table 3. Simulation results: the generator load was 160.520 kW, and the evaporator load was 114.881 kW.

Fig. 3. Simulation process of a solar absorption refrigeration air conditioning system
Table 3. Simulation Results of the States (1 Through 22)

For an ideal absorption refrigeration cycle process, the mechanical work of the solution pump and other heat losses were negligible, and the thermal equilibrium relationship of the entire absorption refrigeration system could be obtained by the first law of thermodynamics, as shown in Eq. 25,
 (25)
(25)
where Qe refers to the evaporator duty (kW), Qg is the generator duty (kW), Qa is the absorber duty (kW), and Qc refers to the condenser duty (kW).
The thermal equilibrium relationship could be used to check whether the load results the heat exchange equipment were accurate. It can be used to test whether the simulation results of the established simulation model were accurate and whether the parameter settings of each process were reasonable. Generally, when the relative error of the design calculation was less than or equal to 1%, it was reasonable, as calculated by Eq. 26,
 (26)
(26)
According to Eqs. 25 and 26, the relative error of the simulation process in this study was less than 1%; therefore, the heat balance of the system simulation load met the requirements, indicating that the Aspen Plus simulation model was reasonable.
Influence of Disturbances of the Working Conditions on the Refrigeration Performance of the System
During the actual operation process, when the external conditions changed, the change trend of the absorption refrigeration unit characteristics would have more theoretical and practical guiding importance. However, in the actual situation, the unit cannot operate completely according to the designed working conditions. Therefore, the influence of the changes of the temperature of the heat source water, cooling water, and chilled water on the cooling capacity could be controlled, and the operation of the unit could be realized using the correct operations. As such, the optimization of the refrigerating system could be achieved (Arshad et al. 2019). The Aspen Plus process simulation software could realize the change in the refrigeration performance of the absorption refrigeration unit under the disturbance of working conditions.
The curves of the COP and unit equipment duty with the heat source temperature are shown in Fig. 4. As the heat source temperature increased, the COP and unit equipment duty of the system increased. The difference between the unit equipment duty and COP was that the former increased following a linear function, while the latter first increased from 0.35 to 0.76 and then became stable. When the heat source temperature reached between 87 and 92 °C, the COP growth rate of the system was 18%, 12%, 4%, 1.5%, and 1.4% for every 1 °C increase. When the heat source temperature was greater than 92 °C, the system COP growth rate was close to 0. Based on Aspen Plus, Xu et al. (2020) studied the influence of heat source temperature on COP. When the heat source temperature was 80 to 90 ℃, COP increased with the increase of heat source temperature; when the heat source temperature was 90 to 115 ℃, COP decreased with the increase of heat source temperature. The present results were similar. This was because the temperature and concentration of the LiBr concentrated solution at the generator outlet, as well as the refrigerant mass flow rate, increased as the heat source temperature increased. Therefore, the cooling capacity of the unit and the other corresponding equipment loads increased. The increase in heat source temperature would lead to an increase in heat consumption, the system COP growth rate was close to 0. A comprehensive analysis of the performance of the LiBr absorption refrigeration unit showed that the optimal heat source temperature range was 88 to 90 °C, and the corresponding maximum of COP value and evaporator duty reached 0.75 kW and 114.39 kW, respectively.

Fig. 4. Impact of the heat source water temperature on the COP and equipment duty
The effects on the COP and cooling capacity of the heat source temperature are depicted in Fig. 5a for several condenser temperature values. According to Fig. 5a, the condensation temperature decreased while the COP of the system increased when other design conditions were stable. For example, when the temperature of the heat source temperature was maintained at 90 °C, the condensation temperature was reduced from 45 to 35 ℃, and the COP of the system increased from 0.66 to 0.72. The above phenomenon occurs because as the heat source temperature increases, the generator outlet becomes concentrated. The concentration of the solution gradually increases, and the mass flow of the refrigerant participating in the refrigeration cycle increases, so the COP of the system gradually increases.
Figure 5b shows the variation of the COP and cooling capacity with different evaporation temperatures. According to Fig. 5b, the COP and cooling capacity of the refrigeration unit generally increased as the evaporating temperature increased, but the increase rate of COP gradually decreased as the evaporating temperature increased. Jia et al. (2014) studied the effect of evaporation temperature on the system based on Aspen Plus and found that the COP of the refrigeration unit also increased with the increase of evaporation temperature when the condensation temperature and the occurrence temperature were kept unchanged. As the evaporation temperature increased from 5 to 14 °C, the COP increased from 0.63 to 0.78, and the cooling capacity increased from 99 to 134 kW. When the evaporation temperature increased from 5 to 11 °C, the COP increased by 19.7%, but when it increased from 11 to 14 ℃, the system COP only increased by 3.2%. This shows that when the evaporating temperature changes from 5 to 11 °C, it is more beneficial in terms of increasing the cooling capacity. The reason for this phenomenon was that when the evaporation temperature increased, the refrigerant water vapor generated in the flash evaporator increased, the cooling capacity increased, the refrigerant vapor increased, and the water flow participating in the refrigeration cycle increased accordingly, so the COP increased. After comprehensive consideration, the evaporation temperature was more suitable in the range of 5 to 11 °C.

Fig. 5. (a) Impact of the condenser temperature on the COP; and (b) Impact of the evaporating temperature on the cooling capacity and COP

Fig. 6. (a) Impact of the dilute solution flow on the generator temperature and hot water temperature; and (b) Impact of the dilute solution flow on the cooling capacity and COP
Figure 6 shows the variations of the generator temperature, hot water temperature, COP, and cooling capacity with different dilute solutions. In the dilute solution process, the flow rate gradually increased from 2000 to 3000 kg/h, while the hot water temperature decreased from 96 to 81 ℃, the occurrence temperature decreased from 90 to 75 ℃, and the downward trend gradually decreased (Fig. 6a). At the same time, the cooling capacity of the unit increased from 113 to 127 kW, while the COP decreased from 0.7 to 0.63 (as shown in Fig. 6b). The reason for this phenomenon was that under the conditions of a constant design load, the flow rate of the refrigerant water vapor generated in the generator remained constant, and the concentration of the solution gradually decreased with the increase in the flow of the dilute solution. The corresponding temperature of the saturated concentrated solution at the outlet of the generator decreased. The temperature of the hot water also decreased gradually, which resulted in high energy consumption for heating by the generator and a low COP value. Although increasing the flow of the dilute solution can make full use of low-temperature waste heat resources, it is unreasonable to increase the flow of the dilute solution to reduce the occurrence temperature. Considering the four factors, i.e., the generator temperature, hot water temperature, COP, and cooling capacity, the flow of the dilute solution should range from 2000 to 2200 kg/h.
CONCLUSIONS
- Based on Aspen Plus software, the simulation model of the system was established to investigate the effects of key parameters, such as the temperature of heat source water, condenser temperature, evaporation temperature, and dilute solution flow rate on the cooling capacity, coefficient of performance (COP), unit equipment duty, and generator temperature. It was found that when keeping the evaporating temperature and condensing temperature constant, the heat load of each equipment of the unit will increase correspondingly with the increase of the heat source temperature.
- The cooling capacity of the unit was increased from 99.5 to 134.6 kW, and the coefficient of performance of the unit was increased from 0.63 to 0.78 when the evaporating temperature was increased from 5 to 14 ℃. The authors suggest that the coefficient of performance of the unit increased as the condensing temperature increased, while keeping the temperature of the heat source constant.
- An increase in the flow rate of the diluted solution results in a decrease in the temperature of the hot water. The flow rate of the refrigerant water vapor generated in the generator remains constant, and the concentration of the solution gradually decreased with the increase in the flow of the dilute solution. The temperature of the hot water also decreases gradually, which results in high energy consumption for heating by the generator and a low COP value.
ACKNOWLEDGMENTS
This research was funded by the National Natural Science Foundation of China (No. 51606113), Shandong Provincial Natural Science Foundation, China (No. ZR2020ME184), the SDUT & Zhoucun City Integration Development Project (No. 2020ZCXCZH09), and major natural science research projects from colleges and universities in the Jiangsu Province (18KJA530002).
REFERENCES CITED
Agyenim, F., Knight, I., and Rhodes, M. (2010). “Design and experimental testing of the performance of an outdoor LiBr/H2O solar thermal absorption cooling system with a cold store,” Solar Energy 84(5), 735-744. DOI: 10.1016/j.solener.2010.01.013
Arshad, M. U., Ghani, M. U., Ullah, A., Güngör, A., and Zaman, M. (2019). “Thermodynamic analysis and optimization of double effect absorption refrigeration system using genetic algorithm,” Energy Conversion and Management 192, 292-307. DOI: 10.1016/j.enconman.2019.03.083
Assilzadeh, F., Kalogirou, S. A., Ali, Y., and Sopian, K. (2005). “Simulation and optimization of a LiBr solar absorption cooling system with evacuated tube collectors,” Renewable Energy 30(8), 1143-1159. DOI: 10.1016/j.renene.2004.09.017
Fitó, J., Coronas, A., Mauran, S., Mazet, N., and Stitou, D. (2018). “Definition and performance simulations of a novel solar-driven hybrid absorption-thermochemical refrigeration system,” Energy Conversion and Management 175, 298-312. DOI: 10.1016/j.enconman.2018.08.098
Gkouletsos, D., Papadopoulos, A. I., Seferlis, P., and Hassan, I. (2019). “Systematic modeling under uncertainty of single, double and triple effect absorption refrigeration processes,” Energy 183, 262-278. DOI: 10.1016/j.energy.2019.06.067
Hosoz, M., Ertunc, H. M., and Bulgurcu, H. (2011). “An adaptive neuro-fuzzy inference system model for predicting the performance of a refrigeration system with a cooling tower,” Expert Systems with Applications 38(11), 14148-14155. DOI: 10.1016/j.eswa.2011.04.225
Hui, X., Hao, Q., Yan, G., and Wang, Q. (2017). “The collector matching analysis of solar cooling system based on three kinds of woking medium,” Procedia Engineering 205, 1310-1315. DOI: 10.1016/j.proeng.2017.10.090
Iffa, R. B., Bouaziz, N., and Kairouani, L. (2017). “Optimization of absorption refrigeration systems by design of experiments method,” Energy Procedia 139, 280-287. DOI: 10.1016/j.egypro.2017.11.209
Jia, B., Qu, Y., Lv, Z., and Feng, F. (2014). “Simulation analysis of solar energy lithium bromide absorption refrigeration system,” New Energy and Technology 6, 30-34. DOI: 10.16189/j.cnki.nygc.2014.06.007
Kim, D. S., and Ferreira, C. A. I. (2008). “Solar refrigeration options – A state-of-the-art review,” International Journal of Refrigeration 31(1), 3-15. DOI: 10.1016/j.ijrefrig.2007.07.011
Liang, Y., Li, S., Yue, X., and Zhang, X. (2017). “Analysis of NH3-H2O-LiBr absorption refrigeration integrated with an electrodialysis device,” Applied Thermal Engineering 115, 134-140. DOI: 10.1016/j.applthermaleng.2016.10.202
Liu, Y., Liu, S., Liu, W., Bi, D., and Li, N. (2021). “Preparation of dolomite-based porous ceramics with Al2O3-loading as the heat carrier for biomass catalytic pyrolysis,” BioResources 16(3), 5234-5247.
Ma, J., Li, Q., Kühn, M., and Nakaten, N. (2018). “Power-to-gas based subsurface energy storage: A review,” Renewable and Sustainable Energy Reviews 97, 478-496. DOI: 10.1016/j.rser.2018.08.056
Mansouri, R., Boukholda, I., Bourouis, M., and Bellagi, A. (2015). “Modelling and testing the performance of a commercial ammonia/water absorption chiller using Aspen-Plus platform,” Energy 93(Part 2), 2374-2383. DOI: 10.1016/j.energy.2015.10.081
Mansouri, R., Bourouis, M., and Bellagi, A. (2018). “Steady state investigations of a commercial diffusion-absorption refrigerator: Experimental study and numerical simulations,” Applied Thermal Engineering 129, 725-734. DOI: 10.1016/j.applthermaleng.2017.10.010
Parvez, M., Khalid, F., and Khan, O. (2020). “Thermodynamic performance assessment of solar based combined power and absorption refrigeration cycle,” International Journal of Exergy 31(3), 232-248.
Prasartkaew, B., and Kumar, S. (2013). “Experimental study on the performance of a solar-biomass hybrid air-conditioning system,” Renewable Energy 57(3), 86-93. DOI: 10.1016/j.renene.2013.01.034
Siddiqui, M. U., and Said, S. A. M. (2015). “A review of solar powered absorption systems,” Renewable and Sustainable Energy Reviews 42, 93-115. DOI: 10.1016/j.rser.2014.10.014
Su, B., Han, W. and Jin, H. (2017). “An innovative solar-powered absorption refrigeration system combined with liquid desiccant dehumidification for cooling and water,” Energy Conversion and Management 153, 515-525. DOI: 10.1016/j.enconman.2017.10.028
Wang, Y., Wang, C., and Xiao, F. (2016). “Optimal match between heat source and absorption refrigeration,” Computers & Chemical Engineering 102, 268-277. DOI: 10.1016/j.compchemeng.2016.11.003
Wang, X., Liu, S., Zhang, D., Bi, D., Wang, L., Zhang, J., and Yi, W. (2021). “Selective preparation of furfural via the pyrolysis of cellulose catalyzed with nitrided HZSM-5,” BioResources 16(4), 7578-7591.
Wu, X., Xu, S., and Jiang, M. (2017). “Development of bubble absorption refrigeration technology: A review,” Renewable and Sustainable Energy Reviews 82(Part 3), 3468-3482. DOI: 10.1016/j.rser.2017.10.109
Xu, M., Zhang, K., Liang, J., and Xu, A. (2020). “Performance analysis of a lithium bromide absorption refrigeration system driven by low-grade waste heat based on Aspen Plus,” Resource information and Engineering 35(6), 123-126. DOI: 10.19534/j.cnki.zyxxygc.2020.06.036.
Yang, S., Deng, C., and Liu, Z. (2019). “Optimal design and analysis of a cascade LiBr/H2O absorption refrigeration/transcritical CO2 process for low-grade waste heat recovery,” Energy Conversion and Management 192, 232-242. DOI: 10.1016/j.enconman.2019.04.045
Article submitted: August 23, 2021; Peer review completed: September 28, 2021; Revised version received and accepted: October 21, 2021; Published: November 11, 2021.
DOI: 10.15376/biores.17.1.144-158