
Abstract
There is increasing interest in regenerated cellulose (RC) films for advanced manufacturing applications using natural polymers and renewable materials. In this study, RC films were isolated via solution casting process using microcrystalline cellulose (MCC) and the ionic liquid 1-butyl-3-methylimidazolium chloride ([BMIM]Cl). Initially, MCC was synthesized from oil palm empty fruit bunch using total chlorine-free (TCF) pulping and acid hydrolysis. Effects of MCC on the structures and physicochemical properties of the isolated RC films were determined for 4 wt%, 6.5 wt%, and 9 wt% of MCC at 80 °C. Several analytical methods were employed to evaluate degree of crystallinity, chemical stability, mechanical properties, morphology, opacity, water vapor permeability, and thermal stability of the RC films. The results showed that the addition of 6.5 wt% of MCC yielded the greatest tensile strength. Compared with the RC films with 6.5 wt% of MCC, thermal stability and water vapor permeability slightly increased when the MCC content was 9 wt%. According to the analytic hierarchy process (AHP), 6.5 wt% of MCC was the optimum MCC concentration to mix with [BMIM]Cl to manufacture RC films for packaging applications, while 9 wt% of MCC was ideal for photocatalytic and electrically conductive thin film applications.
Download PDF
Full Article
Isolation and Characterization of Regenerated Cellulose Films Using Microcrystalline Cellulose from Oil Palm Empty Fruit Bunch with an Ionic Liquid
P. R. D. Weerasooriya,a H. P. S. Abdul Khalil,a Noor Haida Mohd Kaus,b Md. Sohrab Hossain,a Salim Hiziroglu,c M. R. Nurul Fazita,a Deepu A. Gopakumar,a and M. K. Mohamad Haafiz a,*
There is increasing interest in regenerated cellulose (RC) films for advanced manufacturing applications using natural polymers and renewable materials. In this study, RC films were isolated via solution casting process using microcrystalline cellulose (MCC) and the ionic liquid 1-butyl-3-methylimidazolium chloride ([BMIM]Cl). Initially, MCC was synthesized from oil palm empty fruit bunch using total chlorine-free (TCF) pulping and acid hydrolysis. Effects of MCC on the structures and physicochemical properties of the isolated RC films were determined for 4 wt%, 6.5 wt%, and 9 wt% of MCC at 80 °C. Several analytical methods were employed to evaluate degree of crystallinity, chemical stability, mechanical properties, morphology, opacity, water vapor permeability, and thermal stability of the RC films. The results showed that the addition of 6.5 wt% of MCC yielded the greatest tensile strength. Compared with the RC films with 6.5 wt% of MCC, thermal stability and water vapor permeability slightly increased when the MCC content was 9 wt%. According to the analytic hierarchy process (AHP), 6.5 wt% of MCC was the optimum MCC concentration to mix with [BMIM]Cl to manufacture RC films for packaging applications, while 9 wt% of MCC was ideal for photocatalytic and electrically conductive thin film applications.
Keywords: Regenerated cellulose; Microcrystalline cellulose; Ionic liquid; Oil palm empty fruit bunch; Analytic hierarchy process
Contact information: a: School of Industrial Technology, Universiti Sains Malaysia, 11800 Penang, Malaysia; b: School of Chemical Sciences, Universiti Sains Malaysia, 11800 Penang, Malaysia; c: Department of Natural Resource Ecology and Management, Oklahoma State University, Stillwater, Oklahoma 74078-6013, U.S.A.; *Corresponding author: mhaafiz@usm.my (M.K. Mohamad Haafiz)
GRAPHICAL ABSTRACT
INTRODUCTION
The use of petroleum-based plastics in packaging has raised serious environmental concerns due to the plastics’ non-biodegradability and non-biocompatibility (Keshk and Al-Sehemi 2013; Wang et al. 2016). Moreover, the rapid depletion of petroleum is motivating the development of alternative materials to petroleum products in packaging (Keshk and Al-Sehemi 2013). Therefore, scientists and environmental technologists seek sustainable materials from renewable resources for use in packaging materials. Among these, regenerated cellulose (RC) film is highly promising and has been considered as a potential candidate to replace synthetic polymers (Keshk and Al-Sehemi 2013; Soheilmoghaddam et al. 2014). The advantages of using RC film from natural polymers in packaging include maintenance of product quality, biodegradability, reusability, environmental friendliness, decreased production costs, and decreased environmental pollution (Fink et al. 2001; Zhang et al. 2012; Soheilmoghaddam and Wahit 2013; Hina et al. 2015). Overall, cellulose is the most abundant natural polymer and is biodegradable and biocompatible (Zhang et al. 2019b). It is estimated that annual production of cellulosic materials is 90 × 109 metric tons (Pinkert et al. 2009). Cellulose is the main structural component of plants, constitutes a large fraction of lignocellulosic material, and can be found in plant cell walls (Kreuter 1996; Pinkert et al. 2009). Cellulose is the linear polysaccharide in which D-glucopyranose rings are connected to one another with β-(1,4)-D-glucosidic links (Kreuter 1996; Soheilmoghaddam and Wahit 2013). However, the presence of lignin and hemicellulose in lignocellulosic materials hinders the isolation of pure cellulose (Ul-Islam et al. 2012).
Native cellulose is a semi-crystalline polymer with microfibrils and certain amorphous parts (Pinkert et al. 2009), with a hydrogen-bonded supramolecular structure. Many intermolecular and intramolecular hydrogen bonds and van der Waals forces make cellulose highly crystalline (Zhao et al. 2009). Therefore, cellulose cannot be dissolved in most organic solvents, which is a key challenge for cellulose bioprocessing. Cellulose nanocrystals (CNC) are made by dissolving amorphous regions via acid hydrolysis, as crystalline regions are resistant to acid attack (Tayeb et al. 2018). Ideally, all hydrogen bonds within the cellulose microfibrils should be broken during the dissolution process. Starting from the dissolving pulp as a purified raw material, cellulose is converted by large scale industrial processes into cellulose derivatives, including ethers and esters. Depending on the interactions of the solvent molecules with polysaccharides, solvents are categorized into two types: derivatizing and non-derivatizing (Pinkert et al. 2009). Solvents of the former type interact chemically with the cellulose hydroxyl groups and create intermediates (Pinkert et al. 2009), while the latter-type solvents interfere with inter-molecular bonding by means of physical modifications only (Wang et al. 2016). Numerous studies have examined the use of ionic liquids as an ideal solution for dissolving cellulose and preparing RC, as their attractive properties include a negligible vapor pressure (Pinkert et al. 2009), low melting point (Turner et al. 2004; Zhu et al. 2006), chemical and thermal stability, and non-flammability (Zhu et al. 2006). After completion of cellulose dissolution, an antisolvent can be introduced to decrease the solubility of the solute (cellulose) in the used solvent (ionic liquid). As a result, the solute is precipitated, and the solvent is dissolved in the antisolvent (Sun et al. 2007). Cellulose separation can be accomplished by this phenomenon and is called “regeneration” (Lara-Serrano et al. 2019). Compressed CO2, ethanol, and water are some known antisolvents (Sun et al. 2007). Because the ionic liquids have low vapor pressure (Mahmoudian et al. 2012), solvent evaporation is limited, and the need for respiratory protection and exhaust systems can be minimized. This quality also enhances the recyclability of ionic liquids (Pinkert et al. 2009). Ionic liquids can be defined as molten salts with melting temperature less than 100 °C, and they are also able to dissolve lignin (Pinkert et al. 2009).
The ionic liquid 1-butyl-3-methylimidazolium chloride ([BMIM]Cl) is most suitable to dissolve cellulose, with good dissolving power (Mahmoudian et al. 2012; Zhong et al. 2017) and an approximate melting point of 70 °C (Zhao et al. 2009). The finished product after dissolution of raw cellulose in [BMIM]Cl has been subjected to 13C nuclear magnetic resonance spectra, and the absence of degradation products confirms the non-derivatizing ability of [BMiM]Cl (Zhao et al. 2009). Typically, RC materials are prepared from cellulose solution through physical dissolution and shaping (Wang et al. 2016). The shape of the regenerated material depends on the regeneration method and conditions. Thin films with a thickness between 0.1 mm and 0.2 mm can be obtained by solution casting. The process parameters of dissolution time and precipitation rate are affected by the initial cellulose concentration of the solvent (Pinkert et al. 2009). Battista (1950) introduced a methodology to obtain microcrystalline cellulose (MCC) starting from native cellulose by acid hydrolysis using 2.5 N HCl at 105 °C for 30 min with constant agitation in the ratio of 1:20 pulp to liquor (Mohamad Haafiz et al. 2013). Furthermore, it has been shown that the MCC obtained from native cellulose is similar in chemical network to native cellulose, as shown by equivalent Fourier-transform infrared spectra (Mohamad Haafiz et al. 2013). Quan et al. (2010) showed that 4 wt% of cellulose is the optimum concentration for the electrospinning of cellulose in [BMIM]Cl. It has also been confirmed that the ideal dissolution temperature is typically 10 °C greater than the melting temperature of the ionic liquid (Pinkert et al. 2009).
The main objective of this study was to determine the optimum amount of MCC to produce robust RC films (Zhang et al. 2019a) for advanced manufacturing applications, including packaging, photocatalysts, and electrically conductive films. The RC films were fabricated using [BMIM]Cl as an ionic liquid to dissolve MCC isolated from oil palm empty fruit bunch (OP-EFB). Because the melting point of [BMIM]Cl is approximately 70 °C (Zhao et al. 2009), the experiments were performed at 80 °C to dissolve 4 wt%, 6.5 wt%, and 9 wt% of MCC into the [BMIM]Cl. The solution casting method was applied to form thin films, and distilled water was used as the antisolvent to facilitate precipitation of those films.
EXPERIMENTAL
Materials
The MCC used for the production of the RC films was isolated from OP-EFB following the methods discussed by Mohamad Haafiz et al. (2013). The OP-EFB was collected from the United Oil Palm Sdn Bhd (Nibong Tebal, Penang, Malaysia), and NaOH, HCl, and NH4OH were purchased from Merck (Kenilworth, NJ, USA). Tannic acid (TA) was supplied by HmbG Chemicals (Hamburg, Germany), whereas basic copper carbonate (Cu2(OH)2CO3) and the ionic liquid [BMIM]Cl with ≥98% purity was purchased from Sigma-Aldrich (St. Louis, MO, USA).
Isolation of MCC from OP-EFB
In the initial stage of the research, experiments were conducted using OP-EFB pulp. It was found that great quantities of chemicals and long reaction times were required to dissolve the highly amorphous structure of OP-EFB. Therefore, the amorphous cellulose structure was converted to a highly crystalline structure, i.e., MCC. The OP-EFB fibrous strands were pre-hydrolyzed by heating in a water bath at 170 °C for a total reaction time of 60 min. Then, soda pulping was performed using 25% NaOH. The mixture obtained after soda pulping, which is known as total chlorine-free (TCF) pulp, was subjected to oxygen, ozone, and hydrogen peroxide bleaching to obtain a pulp with a resultant off-white color (Mohamad Haafiz et al. 2013). Next, the pulp was hydrolyzed with 2.5 N HCl using a 1:20 ratio of pulp to liquor at 105 °C ± 2 °C for 30 min with constant agitation using a magnetic stirrer. Later, the mixture was filtered at room temperature, and the precipitate was washed with distilled water, followed by 5% diluted NH4OH and distilled water until obtaining a neutral pH. The wet solid mass was dried under vacuum at 105 °C ± 2 °C until reaching a constant weight. At the end of this step, the dry solid mass became snowy-white in color. This material was subjected to grinding with a rotary ball mill to obtain a fine dust (i.e., MCC), and the particles with a size of 50 µm were collected after performing a sieve analysis. The ground product was kept in a storage bottle before being used for RC film manufacturing.
Fabrication of RC films
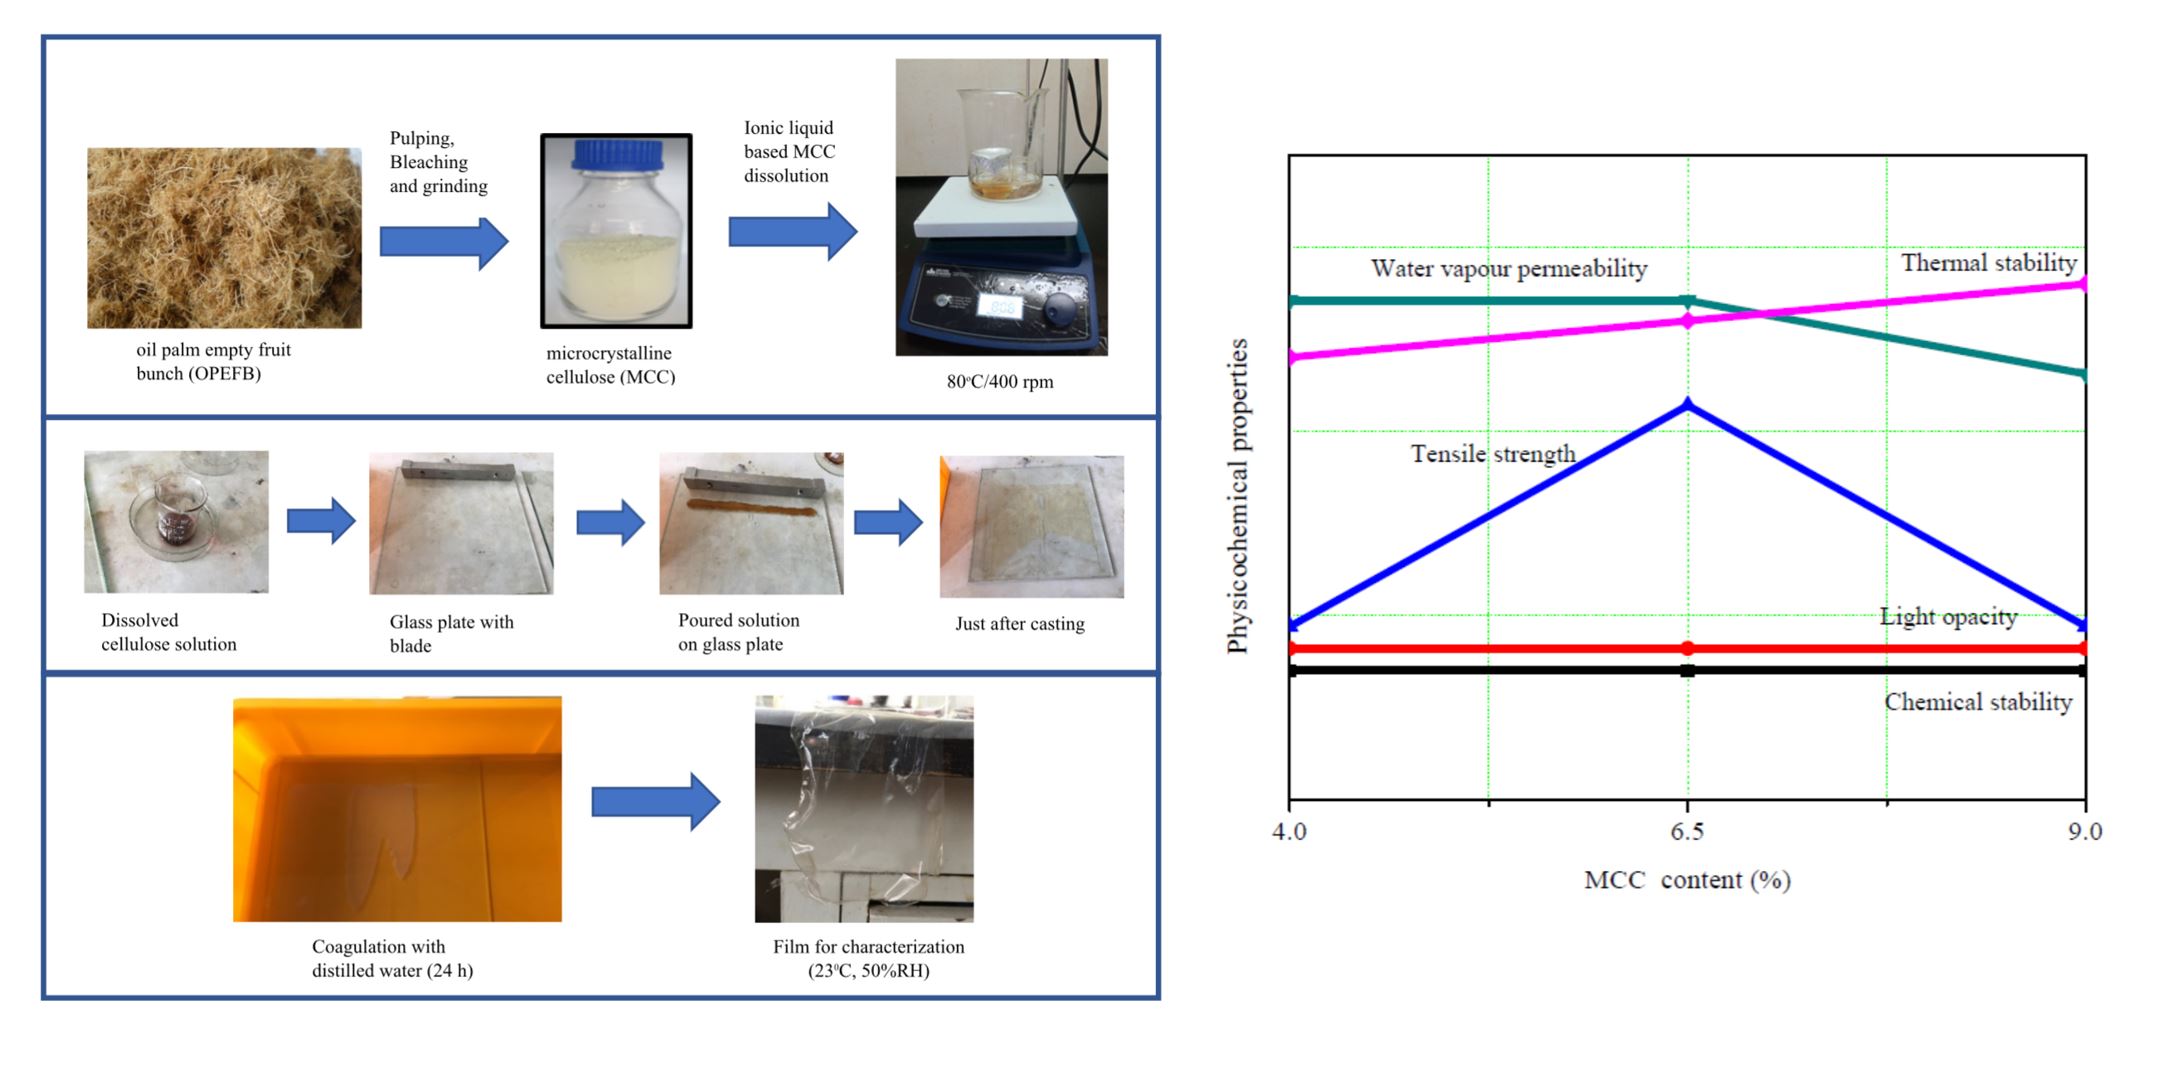
Figure 1 depicts the dissolution of MCC in the ionic liquid to fabricate the RC films. In these experiments, the ionic liquid weight percentage was maintained as 96 wt%, 93.5 wt%, or 91 wt% for MCC compositions of 4 wt%, 6.5 wt%, and 9 wt%, respectively. Initially, the stirrer hot plate was turned on, and the temperature was set to 80 °C by immersing the temperature probe in the oil bath that was kept on the hot plate. Then, 18.7 g of ionic liquid was added into a 100-mL beaker in its gel form. Subsequently, it was put in oil bath while the heating progressed to attain liquid [BMIM]Cl. After obtaining [BMIM]Cl liquid, a magnet was inserted into the beaker, 2 wt% of TA (as the cellulose stabilizer) was added, and the stirrer speed was set to 400 rpm.

Fig. 1. (a) MCC dissolution process inside [BMIM]Cl and (b) solution casting process steps to form thin films
A clear brownish liquid was visible after 30 min. If the temperature reached 80 °C, the required amount of MCC for a total batch weight of 20 g was measured, and it was slowly added into the ionic-liquid-containing beaker. The beaker was closed, and the mixture was left for a few hours. A clear liquid was visible after 6 h of dissolution. Then, the stirring was stopped, and the mixture was removed from the oil bath. The viscous solution was poured onto a glass plate and cast with the aid of a blade, with the adjusted thickness of 0.03 mm. Immediately, the glass plate with the cast layer was immersed in a distilled water bath, and coagulation was allowed for 24 h to remove the ionic liquid from the RC film samples. In the next step, the film samples were dried at room temperature and conditioned at 23 °C ± 2 °C and 50% relative humidity before analysis. All RC films, with an average thickness of 0.03 mm, were prepared in triplicate. The varied MCC loadings of 4 wt%, 6.5 wt%, and 9 wt% were identified as RC4, RC6.5, and RC9, respectively.
X-ray Diffraction (XRD)
An X’Pert X-ray diffractometer (Siemens D5000, Siemens, Munich, Germany) was employed to determine the crystallinity indices of the prepared RC films. Approximately 10 mg of each film was cut into small pieces and placed on the sample holder. The operating voltage was 40 kV with a current of 50 mA. Nickel-filtered Cu Kα radiation was introduced at an angular incidence of 10 to 60° (2θ angle range). Similarly, MCC powder was also subjected to this analysis. The crystallinity index of the sample was calculated using Eq. 1 (Ioelovich and Veveris 1987). The crystalline-to-amorphous ratio of the material was expressed as the degree of crystallinity or crystallinity index (Cri):
 (1)
(1)


where Jc and Jo are the corrected and normalized diffraction intensities (smoothened XRD function using Origin 8.0 (OriginLab, Northampton, MA, USA)) for crystalline regions and sample (all crystalline and amorphous regions), respectively, and ϕ is the angle measured along the 2θ angle range (Ioelovich and Veveris 1987).
Fourier-transform Infrared Spectroscopy (FTIR) Analysis
The chemical structure of the prepared thin films was examined using an attenuated total reflectance Fourier-transform infrared spectrometer (ATR-FTIR) IRPrestige-21 (Shimadzu, Kyoto, Japan). The films were fastened between the horizontal crystals and robust pressure clamp. The infrared spectra were recorded in the wavenumber range of 600 cm-1 to 4000 cm-1, and the wavenumbers corresponding to the relevant transmittance peaks were obtained with the aid of the “Find peak tool” in Nicolet OMNIC 5.01 software (Nicolet Instrument Corporation, Madison, WI, USA). The FTIR spectra of MCC, TA, and [BMIM]Cl were also obtained to study the chemical stability of cellulose during regeneration.
Tensile Test
The ISO 1924-2 (2008) method was used to evaluate the mechanical behavior of the RC films. The RC films were uniformly cut into strips (140 mm × 15 mm × 0.03 mm) before clamping them onto the tensile testing machine (F81.50200, Frank-PTI, Birkenau, Germany) with respect to the ISO 1924-2 (2008) standard. First, the thickness of each sample was measured with using a micrometer screw gauge on three distinct positions along the length, and the mean value was multiplied by 15 mm (the width of the sample) to calculate the effective cross-sectional area. The initial grip separation and load cell used were 100 mm and 500 N, respectively. For every film, average values of 5 different measurements were taken to calculate the mean tensile strength (TS) (σ = F / A) and elongation at break (EAB) (deformation / strain € = e / L). Young’s modulus (E) was calculated using Hooke’s law based on Eq. 2,
 (2)
(2)
where F is the load (N), A is the effective cross-sectional area (mm2), e is the tensile displacement (mm), and L is the initial length (140 mm).
Degree of Polymerization (DP)
Degree of polymerization (DP) of cellulose (MCC and RC films) was calculated using a viscosity test performed with cellulose mixed cuoxam solutions. Initially cuoxam solution was prepared by dissolving 2.5 g of (Cu2(OH)2CO3) in 100 mL of NH4OH solution at room temperature with 400 rpm of magnetic stirring. Approximately 0.15 g of MCC and RC films, which were cut into small pieces to facilitate dissolution, were added into cuoxam solution in each mixing. Then the specific viscosity (ηsp) of the blue homogeneous solution was evaluated using Ubbelohde viscometer at 25 °C. Further, the viscosity of pure cuoxam solution was also measured to perform the viscosity calculation using Eq. 3. Then, DP of MCC and RC films was calculated according to Eq. 4 (Bu et al. 2019),
ηsp = (t1/t0) – 1 (3)
where t1 and to are flow times of cellulose mixed cuoxam solution and pure cuoxam collusion respectively in viscosity test.
DP = ηsp / ((1+0.29 ηsp) x 5 x 10⁻⁴ x c) (4)
In Eq. 4, c is the cellulose concentration in cuoxam solutions with the units of g/L.
Scanning Electron Microscopy (SEM)
Morphological studies of the RC films were conducted using a scanning electron microscope (EVO MA10, Zeiss, Oberkochen, Germany). The RC films subjected to tensile testing were examined on their cross sections through the fractured region. The films were fixed onto cylindrical aluminum stubs, and gold coating was performed because the RC films are non-conductive. The cross-sections of the films were examined at magnifications of 5000× and 10000×, with an accelerating voltage of 15 kV.
Light Opacity Test
A UV-1601 PC UV-Vis spectrophotometer (Shimadzu, Kyoto, Japan) was used for light opacity analysis. The prepared RC film strips (10 mm × 40 mm) were placed on the internal side of the machine, and the film absorbance was measured using an empty test cell as a reference. The opacity values were determined using the calculation described by Han and Floros (1997) (Nor Amalini et al. 2019) (Eq. 5.). Each film was tested in triplicate,
Opacity = Abs600 / X (5)
where Abs600 is the absorbance value at 600 nm, and X is the film thickness (mm). Absorption at 600 nm was considered according to the transparency calculation explained by Han and Floros (1997).
Water Vapor Permeability Test
The ASTM E96 / E96M (2016) methodology was used to measure the water vapor permeability of the prepared RC films. The films were mounted on permeation glass cups, with a height of 410 mm and width of 450 mm, containing silica gel. The initial weights of the cups together with the films and silica gel were measured before placing in a desiccator containing water at a temperature of 25 °C ± 2 °C. The weights of the cups were recorded (± 0.0001 g) at 6-h intervals until a constant weight was observed for each. Weight gained versus time was plotted for every film. The water vapor transmission rate and water vapor permeability were calculated as per Eqs. 6 and 7, respectively, while each film was tested in triplicate (Nor Amalini et al. 2019).
WVTR = slope of weight gained vs. time / A (6)
WVP = (WVTR × L) / ΔP (7)
where WVTR is the water vapor transmission rate (g/(s·m2)) through a film, calculated from the slope of the straight line of the plot divided by the exposed film area, A (m2), L is the mean film thickness (m), and ΔP is the partial water vapor pressure difference (Pa) across the two sides of the film. Thus, water vapor permeability (WVP) can be expressed as g/(s·m·Pa).
Thermogravimetric Analysis (TGA)
A thermogravimetric analyzer (TGA/DSC 1, Mettler Toledo, Columbus, OH, USA) was employed for this experiment. The RC films were cut into small pieces as in the sample preparation for XRD. Approximately 10 mg of each sample was put into the sample holder. Then, it was subjected to temperatures from 30 °C to 800 °C with a heating rate of 10 °C/min under nitrogen atmosphere. Thermograms of the prepared RC films were recorded based on mass changes across temperature and time.
Analytic Hierarchy Process
The analytic hierarchy process (AHP) is a mathematical approach developed by Prof. T. L. Saaty from 1971 to 1975 to solve difficult decision-making tasks with a simplified methodology (Saaty 1987). It quantifies qualitative factors by ranking factors and expected outputs using a matrix calculation. The AHP was employed in this study because it was difficult to find the optimum MCC content for the application requirements based on the obtained physicochemical properties (Saaty 2002). In this study, the factors affecting on the behavior of the RC films were chemical stability, mechanical properties, light opacity, water vapor permeability, and thermal stability. In AHP theory, these are known as “criteria.” Similarly, the expected output is the best formulation of RC4, RC6.5, or RC9, and these formulations are known as “alternatives.”
Initially, pairwise comparisons were made among the criteria by ranking each criterion based on the requirements of the selected application. Then, the comparison matrix was developed by converting fractions into decimals. Subsequently, the squared matrix was obtained by calculating the second power of the comparison matrix. The number of rows and columns of this matrix was equal to the number of criteria. The row elements were summed to obtain the column vector. After that, the numerical value of each element was divided by the sum of the elements of this vector to obtain the eigenvector of the criteria. The accuracy of the values was measured by repeating the squared matrix obtaining process and immediate calculations until obtaining the eigenvector of the criteria. The individual elements of the eigenvector are called eigen values. If the difference between the eigenvalues of corresponding elements of two consecutive eigenvectors was approximately zero, the values could be accepted. If the difference was not negligible, the process was repeated until attaining a negligible difference of eigenvalues. The rows of the eigenvector represented the criteria according to the naming order. In the next step, a pairwise comparison was made for each criterion among alternatives. Then, the separate eigenvectors could be obtained for each criterion, and the rows of these vectors corresponded to the alternatives. These separate eigenvectors were kept together to form a matrix in which rows and columns represented alternatives and criteria, respectively. Afterwards, this matrix was multiplied by the eigenvector obtained for the criteria by pairwise comparison. The resultant column vector contained the eigenvalues corresponding to each alternative, and the greatest eigenvalue provided the best output for the analysis (in this study, the optimum RC film). Fig. 2 summarizes the main steps of the AHP.

Fig. 2. Basic steps of AHP: (a) preparation of criteria eigenvector and (b) finding resultant column vector
RESULTS AND DISCUSSION
Isolation of RC Films
The RC films were isolated by dissolving the MCC in the [BMIM]Cl with and without TA as a stabilizer. The visual appearance of the conditioned RC films is displayed in Fig. 3. The RC film isolated without stabilizer cracked during coagulation. Therefore, 2 wt% of TA was added in the MCC dissolution process (with respect to the total batch weight of the [BMIM]Cl and MCC mixture) to obtain stable cellulose for film formation and a crack-free RC film structure. Similarly, TA has been utilized to obtain stabilized colloidal complexes with methylcellulose, cellulose nanocrystals (Narukulla et al. 2019), and citrus nanofibers (CNF) (Wang et al. 2018). In MCC dissolution, TA causes to enhance a strong electrostatic repulsion among MCC particles and thereby improves the dispersibility of MCC in [BMIM]Cl. Also TA contributes on network stability of cellulose (Narukulla et al. 2019). RC films prepared from commercial MCC is fragile and opaque compared with those obtained from OP-EFB based MCC. Therefore OP-EFB based MCC is more favorable for intended applications.

Fig. 3. Photographs of RC films: (a) RC4, (b) RC6.5, and (c) RC9
Degree of Crystallinity of RC Films
It is important to study the crystallinity of polymers, especially in a regeneration process. X-ray diffraction patterns of all the RC films and MCC are shown in Fig. 4, and the materials’ crystallinity indices are listed in Table 1. According to Fig. 4, the significant peaks of the XRD pattern of MCC appeared at approximately 17° and 19° and were absent in the XRD curves of the RC films. Another peak at approximately 22.6° was less dominant in the RC films (low amplitude) compared with MCC. Also, the crystallinity indices of all RC films were less than that of MCC, which had a value of 59% (Table 1). This result implies that the ionic liquid interfered with the crystalline network of cellulose during dissolution.

Fig. 4. XRD patterns obtained for (a) RC4, (b) RC6.5, (c) RC9, and (d) MCC
During regeneration, the broken crystalline networks did not re-form. The crystallinity indices of RC6.5 and RC9 were 39% and 36%, respectively, and greater than that of RC4 (15%). Hence, the greater crystallinity indices of RC6.5 and RC9 could be due to the increased MCC loading. Similar research has been reported by Dadi et al. (2006), who demonstrated that RC based on commercial MCC prepared by [BMIM]Cl was amorphous in structure. According to that theory, RC4 is more amorphous than RC6.5 and RC9. Table 2 displays the calculations of available ionic liquid content per unit of MCC. Because the available ionic liquid content was greater in the RC4 dissolution compared to other two RC films, the ionic strength enhanced dissolution kinetics and resulted in an amorphous or less crystalline structure (Dadi et al. 2006).
Table 1. Crystallinity Indices of RC films and MCC

Table 2. Calculation of Available Ionic Liquid Content for MCC Dissolution

Determination of Chemical Stability of MCC during Dissolution
In this test, three FTIR spectra obtained for RC films were compared with the FTIR spectra of MCC, [BMIM]Cl, and TA to identify whether the chemical network was altered during dissolution and regeneration (Yang et al. 2010). According to the analysis (Fig. 5 and Table 3), the spectra of the RC films and MCC showed similar patterns without any additional peaks.

Fig. 5. FTIR spectra obtained for (a) MCC, (b) RC4, (c) RC6.5, (d) RC9, (e) [BMIM]Cl, and (f) TA
Further, it was observed that the RC films did not follow a pattern similar to [BMIM]Cl or TA. Therefore, the TA did not interfere with the intended application requirements, and it can be concluded that [BMIM]Cl is a non-derivative solvent. Moreover, [BMIM]Cl is a gel at ambient temperature (melting point ≈ 70 °C) and causes surface wetting. Because the obtained films had adequate dryness at ambient conditions, it could be concluded that [BMIM]Cl was not retained on the RC films after conditioning.
Table 3. Motions of Organic Bonds at FTIR Peak Wavenumbers (Yang et al. 2010; Mohamad Haafiz et al. 2013)

Mechanical Properties of RC Films
Mechanical properties are key factors to be concerned in the design of load-bearing materials. It is necessary to evaluate a packaging material’s ability to undergo load profiles throughout its service life. In the formation of RC films after coagulation, MCC content does not affect shrinkage of the film because the MCC has been fully dissolved in the ionic liquid. Prepared RC films were tensile tested according to the ISO 1924-2 (2008) method. Figures 6, 7a, and 7b depict the stress strain curves of tensile test, TS, and EAB values, respectively, at different MCC contents.

Fig. 6. Stress strain curves of tensile test performed for (a) RC4, (b) RC6.5 and (c) RC9

Fig. 7. Variation of (a) TS and (b) EAB of RC films with respect to MCC content
 Fig. 8. (a) Variation of Young’s modulus of RC films and (b) comparison of (p) crystallinity index and (q) Young’s modulus of RC films with respect to MCC content
Figure 8a shows the Young’s modulus values for different MCC contents, while Fig. 8b shows the relationship of Young’s modulus and crystallinity index in the RC films. According to Fig. 7, RC6.5 had the greatest TS and EAB among the RC films. Research on crystalline polymers has found that increased chain regularity results in greater crystallinity, the formation of thicker lamellas, and increased modulus (Menyhárd et al. 2015).
According to the XRD results (Table 1), RC6.5 had the greatest crystallinity index among the films (39%). These findings agreed with the explanation of Menyhárd et al. (2015), and the greatest Young’s modulus observed was 296 MPa in RC6.5. Meanwhile, RC9 had the second greatest Young’s modulus (250 MPa) and the second greatest crystallinity index (36%). This explanation is well depicted in Fig. 8b, as greater crystallinity indices corresponded to greater Young’s modulus values and vice versa. Hence 6.5 wt% of MCC is a proper amount to include in an RC preparation solution due to the greatest Young’s modulus of RC6.5. Moreover, the TS of RC6.5 was 10.2 MPa, which is within the TS range (8.3 MPa to 31.4 MPa) (Spence et al. 2010) of commercially available low-density polyethylene (LDPE). Thus, the RC6.5 thin film can be considered for use in applications where LDPE substitutes are required.
Degree of Polymerization (DP)
Table 4 summarizes the Young’s modulus of RC films, as well as the crystallinity indices and DP values of MCC and RC films. According to the results, RC films showed a reduction of DP compared with MCC, while DP increased with added MCC content. However RC4 had the lowest DP value (367), while RC6.5 and RC9 showed similar values with RC4. However the reason for the highest crystallinity index and Young’s modulus in RC6.5 may due to the increased chain regularity and formation of thicker lamellas (Menyhárd et al. 2015) even though the DP of RC6.5 was slighlty below that of RC9. The percentage reduction of DP in RC9 with respect to MCC was 15%, which is equivalent to the results reported in a recent study regarding regenerated cellulose prepared by bamboo pulp (Bu et al. 2019) . The difference of DP values with respect to MCC loading is due to the recrystallization of original cellulose crystalline I form into crystalline II form during regeneration (Bu et al. 2019).
Table 4. Young’s Modulus of RC films, Crystallinity Indices and DP Values of MCC and RC Films

Morphology of RC Films
Photographs were taken under a printed paper background for all RC films, as shown in Fig. 2. The films appeared smooth, homogeneous, crack-free, and glossy to the naked eye. The RC films were thin, flexible, and easily peeled off from the glass plate after completion of the drying process. Cross-sectional morphology was examined by SEM. Surface morphologies of RC4, RC6.5, and RC9 were viewed under 5000× and 10000× magnifications, as shown in Fig. 9, which reveals a smooth microstructure. As explained by Nor Amalini et al. (2019), a more compact and smooth structure is due to greater dispersion of cellulose chains during dissolution. Thus, it could be understood that [BMIM]Cl is able to dissolve MCC thoroughly at the selected process conditions (80 °C and 400 rpm).
Light Opacity of RC Films
The light opacity test results are displayed in Fig. 9a. Opacity and transparency are important properties to consider in thin film applications. Greater opacity corresponds to lower transparency (Nor Amalini et al. 2019). Highly transparent films are preferred in superficial applications like packaging, while highly opaque films are required to minimize oxidation of light-sensitive items (e.g., vitamins, drugs, and certain spices and herbs) (Nor Amalini et al. 2019). Research has been found that 3 wt% of cellulose is adequate to obtain a film with high transparency and strength (Zheng et al. 2019). According to Fig. 2, the macroscale films have good transparency.

Fig. 9. Cross-sectional SEM images of RC films: (a and b) RC4, (c and d) RC6.5, and (e and f) RC9 captured at (a, c, and e) 5000× and (b, d, and f) 10000× magnifications
In Fig. 10a, although the average opacity values of the RC films differed, statistical analysis showed that the values were similar, as the error bars overlapped. As explained by Zheng et al. (2019), when the cellulose concentration is greater than 3 wt%, the resultant films are transparent. Therefore, in this study, light opacity was not influenced by MCC content.

Fig. 10. Variation of (a) opacity and (b) water vapor permeability values of RC films with respect to MCC content
Water Vapor Permeability of RC Films
Water vapor permeability is a permeation process via activated diffusion, in which molecules are transferred via concentration gradients by random molecular motions (Siracusa 2012). Water vapor permeability values are displayed in Fig. 10b. According to theory, vapor or gas permeation is facilitated by an amorphous structure due to the presence of a long, tortuous path between the crystallites (Siracusa 2012). According to that conception, water vapor permeability should be lowest in RC6.5, because it has the greatest crystallinity index with limited tortuous path. In contrast, the greatest water vapor permeability should be observed in RC4, because it has the lowest crystallinity index with increased tortuous path length. However, the water vapor permeability results for RC4 and RC6.5 were similar, as the error bars overlapped (Fig. 9b). Compared to those two films, RC9 had slightly lower water vapor permeability, as its error bars did not overlap with those of RC4 and RC6.5. According to Parris et al. (1995), decreased water vapor permeability may due to decreased space between macromolecules. According to that explanation, the RC9 network may have less space between its macromolecules compared to RC6.5, even though the crystallinity index of RC6.5 is greater than that of RC9.
Thermal Degradation of RC films
Evaluating material performance at different temperatures is important for thin films because they are subjected to temperature gradients during their service life. Thermogravimetric analysis experiments were conducted for the three different RC films, and the graphs are shown in Fig. 11a. The TGA graphs depict the weight changes of the materials during heating; the derivative thermogravimetric (DTG) curves are shown in Fig. 11b. Thermal degradation temperatures for a sample weight loss of 20% (T20) and maximum weight loss (Tmax) are listed in Table 5. The thermal degradation temperatures slightly increased when the cellulose loading increased. According to Abdulkhani et al. (2013), thermal degradation is affected by the supramolecular structure of cellulosic materials. According to Nor Amalini et al. (2019), thermal stability is enhanced by a more compact microstructure due to hindrance of heat penetration in a compact molecular network.

Fig. 11. (a) TGA curves and (b) DTG curves of (p) RC4, (q) RC6.5, and (r) RC9 films
Table 5. Thermal Degradation Temperatures and Residual Weights of RC films

According to the statement of space reduction of macromolecules (in the section of water vapor permeability of RC films) (Parris et al. 1995) and observed different water vapor permeability values, macromolecules may become arranged in different ways during regeneration. Cross-sectional morphology images (Fig. 9) showed a slight increase in compactness with MCC content, which may due to the arrangement of macromolecules in regeneration. Therefore, T20, Tmax, and the final residue after TGA testing increased when the MCC content increased due to increased thermal stability as explained above.

Fig. 12. Representation of experimental findings for applying AHP calculations
Determination of Optimum MCC Content
According to the individual results and their comparisons, it is difficult to find the ideal MCC content to mix with the ionic liquid [BMIM]Cl to fabricate RC films for the proposed applications. Because there are contradictions among the different formulations in different properties, the AHP was applied to determine the optimum MCC content with respect to the application. A summary of experimental findings was plotted in Fig. 12 before performing the AHP calculations. Because there was not a difference among the FTIR peaks for each alternative, chemical stability could be disregarded in the AHP analysis. Light opacity was also independent of MCC content and was therefore also ignored in this analysis. Film morphology was examined to identify the molecular arrangement during the regeneration process, but it cannot be quantified for AHP analysis. Therefore, mechanical properties, water vapor permeability, and thermal stability were the criteria considered. Rankings based on application are listed in Table 6. Pairwise comparisons and the eigenvector of the criteria of the RC films used for packaging applications are shown in Table 7. The eigenvalues were obtained by performing separate pairwise comparisons among each alternative using the experimental results of the three different properties. Those were kept together to form the final matrix for packaging applications (Table 8). This matrix was multiplied by the eigenvector in column 5 of Table 7 to obtain the final eigenvalues corresponding to the alternatives. This calculation method was repeated for both the photocatalytic and electrically conductive applications of films, and the results are shown in Fig. 13. Based on the greatest eigenvalues of each result, it was clear that the optimum amount of MCC was 6.5 wt% for RC films applied as packaging materials. Similarly, the optimum amount of MCC was 9 wt% for prepared RC films for photocatalytic or electrically conductive thin film applications.

Fig. 13. Final eigenvalues for (a) packaging, (b) photocatalytic, and (c) electrically conductive applications of RC films
Table 6. Rankings Based on Application Requirements

Table 7. Pairwise Comparison and Eigenvector of the RC Films for Packaging Applications

Table 8. Matrix Obtained by the Pairwise Comparison Made among Alternatives for Every Criterion for Packaging Applications

CONCLUSIONS
- Regenerated cellulose film was fabricated using microcrystalline cellulose (MCC) from oil palm empty fruit bunch (OP-EFB) and [BMIM]Cl as ionic liquid.
- The [BMIM]Cl was a favorable ionic liquid to dissolve MCC to yield regenerated cellulose (RC) thin film as an ultimate product.
- Fourier-transform infrared spectroscopy showed that [BMIM]Cl is a non-derivatizing solvent, which implies that the MCC was chemically stable during regeneration.
- Light opacity was independent of MCC content, while water vapor permeability was slightly lower in RC9 compared to the other two compositions.
- Thermal stability slightly increased with increased MCC content. Analysis of mechanical properties revealed that the RC film with 6.5 wt% of MCC had the greatest TS, which is the essential requirement for load-carrying applications.
- The AHP showed that 6.5 wt% of MCC was the optimum MCC content to synthesize RC films for packaging applications, while 9 wt% was optimal for photocatalytic and electrically conductive thin film applications.
- The results showed that the MCC from OP-EFB has the potential to yield RC thin films, which can be utilized as bio-packaging or as photocatalytic or electrically conductive materials.
ACKNOWLEDGMENTS
This work was supported by Research University Grant Scheme (RU) 1001.PKIMIA.8011069 and 1001/PTEKIND/8011098, allocated by Universiti Sains Malaysia, and the Fundamental Research Grant Scheme (FRGS) 203/PTEKIND/6711819 from the Ministry of Higher Education, Malaysia.
REFERENCES CITED
Abdulkhani, A., Marvast, E. H., Ashori, A., Hamzeh, Y., and Karimi, A. N. (2013). “Preparation of cellulose/polyvinyl alcohol biocomposite films using 1-n-butyl-3-methylimidazolium chloride,” International Journal of Biological Macromolecules 62, 379-386. DOI: 10.1016/j.ijbiomac.2013.08.050
ASTM E96 / E96M (2016). “Standard test methods for water vapor transmission of materials,” ASTM International, West Conshohocken, PA, USA.
Battista, O. A. (1950). “Hydrolysis and crystallization of cellulose,” Industrial & Engineering Chemistry 42(3), 502-507. DOI: 10.1021/ie50483a029
Bu, D., Hu, X., Yang, Z., Yang, X., Wei, W., Jiang, M., Zhou, Z., and Zaman, A. (2019). “Elucidation of the relationship between intrinsic viscosity and molecular weight of cellulose dissolved in tetra-n-butyl ammonium hydroxide/dimethyl sulfoxide,” Polymers, 11(10). DOI: 10.3390/polym11101605
Dadi, A. P., Varanasi, S., and Schall, C. A. (2006). “Enhancement of cellulose saccharification kinetics using an ionic liquid pretreatment step,” Biotechnology and Bioengineering 95(5), 904-910. DOI: 10.1002/bit.21047
Kreuter, J. (1996). “Nanoparticles and microparticles for drug and vaccine delivery,” Journal of Anatomy 189, 503-505.
Fink, H.-P., Weigel, P., Purz, H. J., and Ganster, J. (2001). “Structure formation of regenerated cellulose materials from NMMO-solutions,” Progress in Polymer Science 26(9), 1473-1524. DOI: 10.1016/S0079-6700(01)00025-9
Han, J. H., and Floros, J. D. (1997). “Casting antimicrobial packaging films and measuring their physical properties and antimicrobial activity,” Journal of Plastic Film & Sheeting 13(4), 287-298. DOI: 10.1177/875608799701300405
Hina, S., Zhang, Y., and Wang, H. (2015). “Role of ionic liquids in dissolution and regeneration of cellulose,” Reviews on Advanced Materials Science 40, 215-226.
Ioelovich, M. Y., and Veveris, G. P. (1987). “Determination of cellulose crystallinity by X-ray diffraction method,” Journal of Wood Chemistry 80(5), 72-80.
ISO 1924-2 (2008). “Paper and board — Determination of tensile properties — Part 2: Constant rate of elongation method (20 mm/min),” International Organization for Standardization, Geneva, Switzerland.
Keshk, S. M. A. S., and Al-Sehemi, A. G. (2013). “New composite based on starch and mercerized cellulose,” American Journal of Polymer Science 3(3), 46-51. DOI: 10.5923/j.ajps.20130303.02
Lara-Serrano, M., Morales-delaRosa, S., Campos-Martín, J. M., and Fierro, J. L. G. (2019). “Fractionation of lignocellulosic biomass by selective precipitation from ionic liquid dissolution,” Applied Sciences 9(9). DOI: 10.3390/app9091862
Mahmoudian, S., Wahit, M. U., Ismail, A. F., and Yussuf, A. A. (2012). “Preparation of regenerated cellulose/montmorillonite nanocomposite films via ionic liquids,” Carbohydrate Polymers 88(4), 1251-1257. DOI: 10.1016/j.carbpol.2012.01.088
Menyhárd, A., Suba, P., László, Z., Fekete, H. M., Mester, Á. O., Horváth, Z., Vörös, G., Varga, J., and Móczó, J. (2015). “Direct correlation between modulus and the crystalline structure in isotactic polypropylene,” Express Polymer Letters 9(3), 308-320. DOI: 10.3144/expresspolymlett.2015.28
Mohamad Haafiz, M. K., Eichhorn, S. J., Hassan, A., and Jawaid, M. (2013). “Isolation and characterization of microcrystalline cellulose from oil palm biomass residue,” Carbohydrate Polymers 93(2), 628-634. DOI: 10.1016/j.carbpol.2013.01.035
Narukulla, R., Ojha, U., and Sharma, T. (2019). “Enhancing the stability and redispersibility of o/w Pickering emulsion through polyacryloyl hydrazide-tannic acid synergy,” Colloids and Surfaces A: Physicochemical and Engineering Aspects 568, 204-215. DOI: 10.1016/j.colsurfa.2019.02.012
Nor Amalini, A., Noor Haida, M. K., Imran, K., and Mohamad Haafiz, M. K. (2019). “Relationship between dissolution temperature and properties of oil palm biomass based-regenerated cellulose films prepared via ionic liquid,” Materials Chemistry and Physics 221, 382-389. DOI: 10.1016/j.matchemphys.2018.09.028
Parris, N., Coffin, D. R., Joubran, R. F., and Pessen, H. (1995). “Composition factors affecting the water vapor permeability and tensile properties of hydrophilic films,” Journal of Agricultural and Food Chemistry 43(6), 1432-1435. DOI: 10.1021/jf00054a004
Pinkert, A., Marsh, K. N., Pang, S., and Staiger, M. P. (2009). “Ionic liquids and their interaction with cellulose,” Chemical Reviews 109(12), 6712-6728. DOI: 10.1021/cr9001947
Quan, S.-L., Kang, S.-G., and Chin, I.-J. (2010). “Characterization of cellulose fibers electrospun using ionic liquid,” Cellulose 17(2), 223-230. DOI: 10.1007/s10570-009-9386-x
Saaty, R. W. (1987). “The analytic hierarchy process—What it is and how it is used,” Mathematical Modelling 9(3-5), 161-176. DOI: 10.1016/0270-0255(87)90473-8
Saaty, T. L. (2002). “Decision making with the analytic hierarchy process,” Scientia Iranica 9(3), 215-229.
Siracusa, V. (2012). “Food packaging permeability behaviour: A report,” International Journal of Polymer Science 2012. DOI: 10.1155/2012/302029
Soheilmoghaddam, M., and Wahit, M. U. (2013). “Development of regenerated cellulose/halloysite nanotube bionanocomposite films with ionic liquid,” International Journal of Biological Macromolecules 58, 133-139. DOI: 10.1016/j.ijbiomac.2013.03.066
Soheilmoghaddam, M., Sharifzadeh, G., Pour, R. H., Wahit, M. U., Whye, W. T., and Lee, X. Y. (2014). “Regenerated cellulose/β-cyclodextrin scaffold prepared using ionic liquid,” Materials Letters 135, 210-213. DOI: 10.1016/j.matlet.2014.07.169
Spence, K. L., Venditti, R. A., Habibi, Y., Rojas, O. J., and Pawlak, J. J. (2010). “The effect of chemical composition on microfibrillar cellulose films from wood pulps: Mechanical processing and physical properties,” Bioresource Technology 101(15), 5961-5968. DOI: 10.1016/j.biortech.2010.02.104
Sun, X., Chi, Y., and Mu, T. (2007). “Studies on staged precipitation of cellulose from ionic liquid by compressed carbon dioxide,” Green Chemistry 16, 2736-2744. DOI: 10.1039/C4GC00085D
Tayeb, A. H., Amini, E., Ghasemi, S., and Tajvidi, M. (2018). “Cellulose nanomaterials—Binding properties and applications: A review,” Molecules 23(10). DOI: 10.3390/molecules23102684
Turner, M. B., Spear, S. K., Holbrey, J. D., and Rogers, R. D. (2004). “Production of bioactive cellulose films reconstituted from ionic liquids,” Biomacromolecules 5(4), 1379-1384. DOI: 10.1021/bm049748q
Ul-Islam, M., Khan, T., and Park, J. K. (2012). “Nanoreinforced bacterial cellulose–montmorillonite composites for biomedical applications,” Carbohydrate Polymers 89(4), 1189-1197. DOI: 10.1016/j.carbpol.2012.03.093
Wang, J. S., Wang, A. B., Zang, X. P., Tan, L., Ge, Y., Lin, X. E., Xu, B. Y., Jin, Z. Q., and Ma, W. H. (2018). “Physical and oxidative stability of functional avocado oil high internal phase emulsions collaborative formulated using citrus nanofibers and tannic acid,” Food Hydrocolloids, 82, 248-257. DOI: 10.1016/j.foodhyd.2018.02.013
Wang, S., Lu, A., and Zhang, L. (2016). “Recent advances in regenerated cellulose materials,” Progress in Polymer Science 53, 169-206. DOI: 10.1016/j.progpolymsci.2015.07.003
Yang, Z., Peng, H., Wang, W., and Liu, T. (2010). “Crystallization behavior of poly(ε-caprolactone)/layered double hydroxide nanocomposites,” Journal of Applied Polymer Science 116(5), 2658-2667. DOI: 10.1002/app.31787
Zhang, H., Han, Q., Gao, X., Tang, X., Chen, K., and Li, M. (2019a). “Impact of reinforcing additives on the structure and performance of composite films based on regenerated cellulose from corn stalk pith,” BioResources 14(4), 8455-8469. DOI: 10.15376/biores.14.4.8455-8469
Zhang, X., Liu, X., Zheng, W., and Zhu, J. (2012). “Regenerated cellulose/graphene nanocomposite films prepared in DMAC/LiCl solution,” Carbohydrate Polymers 88(1), 26-30. DOI: 10.1016/j.carbpol.2011.11.054
Zhang, H., Tang, X., Gao, X., and Chen, K. (2019b). “Fabrication and comparative evaluation of regenerated cellulose films using pulp fines and pith from corn stalk in DMAc/LiCl solvent system,” BioResources, 14(3), 6421-6432. DOI: 10.15376/biores.14.3.6421-6432
Zhao, H., Jones, C. L., Baker, G. A., Xia, S., Olubajo, O., and Person, V. N. (2009). “Regenerating cellulose from ionic liquids for an accelerated enzymatic hydrolysis,” Journal of Biotechnology 139(1), 47-54. DOI: 10.1016/j.jbiotec.2008.08.009
Zheng, X., Huang, F., Chen, L., Huang, L., Cao, S., and Ma, X. (2019). “Preparation of transparent film via cellulose regeneration: Correlations between ionic liquid and film properties,” Carbohydrate Polymers 203, 214-218. DOI: 10.1016/j.carbpol.2018.09.060
Zhong, C., Cheng, F., Zhu, Y., Gao, Z., Jia, H., and Wei, P. (2017). “Dissolution mechanism of cellulose in quaternary ammonium hydroxide: Revisiting through molecular interactions,” Carbohydrate Polymers 174, 400-408. DOI: 10.1016/j.carbpol.2017.06.078
Zhu, S., Wu, Y., Chen, Q., Yu, Z., Wang, C., Jin, S., Ding, Y., and Wu, G. (2006). “Dissolution of cellulose with ionic liquids and its application: A mini-review,” Green Chemistry 8(4), 325-327. DOI: 10.1039/b601395c
Article submitted: July 10, 2020; Peer review completed: Aug. 23, 2020; Revised version received and accepted: Sept. 4, 2020; Published: September 14, 2020.
DOI: 10.15376/biores.15.4.8268-8290