
Abstract
The kinetics of cellulase saccharification of corn stover (CS) after pretreatment by lignin peroxidase (LiP) and H2O2 was modeled in this work. The Impeded Michaelis model was applied in fitting all experimental data. The model gave the initial activity and accessibility of the enzyme on the substrate (Kobs,0) and the gradual loss of enzyme activity (Ki). The maximum Ytrs (55.56%) was obtained at pH 4.7, 48.6 °C, a 1.5% cellulase, and 12.4:1 water-to-material ratio. The binary quadratic model provide a good fit of the data on Ytrs and of the model parameters Kobs,0 and Ki. The results showed that Ytrs was positively correlated with Kobs,0 and negatively correlated with Ki. This study laid a foundation for improving the cellulase saccharification efficiency of lignocellulosic biomass after pretreatment by H2O2 and LiP.
Download PDF
Full Article
Kinetics of Cellulase Saccharification of Corn Stover after Pretreatment by Lignin Peroxidase and H2O2
Zhi C. Zhang,a,* Jin H. Li,b and Feng Wang b
The kinetics of cellulase saccharification of corn stover (CS) after pretreatment by lignin peroxidase (LiP) and H2O2 was modeled in this work. The Impeded Michaelis model was applied in fitting all experimental data. The model gave the initial activity and accessibility of the enzyme on the substrate (Kobs,0) and the gradual loss of enzyme activity (Ki). The maximum Ytrs (55.56%) was obtained at pH 4.7, 48.6 °C, a 1.5% cellulase, and 12.4:1 water-to-material ratio. The binary quadratic model provide a good fit of the data on Ytrs and of the model parameters Kobs,0 and Ki. The results showed that Ytrs was positively correlated with Kobs,0 and negatively correlated with Ki. This study laid a foundation for improving the cellulase saccharification efficiency of lignocellulosic biomass after pretreatment by H2O2 and LiP.
Keywords: Kinetics; Heterogeneous system; Enzyme hydrolysis; Impeded Michaelis model; Binary quadratic model
Contact information: a: Institute of Agro-production Processing Engineering, Jiangsu University, 306 Xuefu, Zhenjiang, Jiangsu 212013, P. R. China; b: School of Food and Biological Engineering, Jiangsu University, 306 Xuefu, Zhenjiang, Jiangsu 212013, P. R. China;
* Corresponding author: zhangzhicai@ujs.edu.cn
INTRODUCTION
Lignocellulosic biomass represents a variety of biomass sources, including agricultural waste, where lignocelluloses can be utilized as raw materials and converted into valuable chemicals, food products, and/or bio-energy (Baeyens et al. 2015). The conversion of cellulose from lignocelluloses into bioenergy has attracted a great deal of interest among researchers (Kang et al. 2014). However, only a minimal amount of lignocellulose is typically utilized. As such, a great quantity of lignocellulose has been wastefully discarded, resulting in environmental pollution and a serious waste of natural resources. Lignin inhibits the degradation of cellulose and hemicellulose by preventing contact with the cellulase and hemicellulase (Shi et al. 2008; Bellido et al. 2014; Wang et al. 2015). The crystal structure reduces access to the surface area between cellulase and cellulose, and between hemicellulose and hemicellulase. Therefore, the aim of the pretreatment is to degrade the lignin and to improve enzymatic saccharification efficiency. The H2O2 oxidative degradation is a particularly promising pre-treatment method (Ramadoss and Muthukumar 2015; Zhang et al. 2015; Cao et al. 2016; Qing et al. 2016). The catalysts used in H2O2 oxidative degradation of lignin include alkali (Cao et al. 2016), inorganic salt (Ramadoss and Muthukumar 2015; Qing et al. 2016), and enzymes (Zhang et al. 2015). However, the use of alkali and inorganic salt as catalysts results in environmental pollution. The potential advantages of enzymatic-H2O2 oxidative degradation of lignin include cost-effectiveness, speed, convenience, safety, high yield of total reducing sugar (Ytrs), low environmental impact, and the lack of a need for special equipment. However, the hydrolysis solution of this method contains high amounts of lignin degradation products. These degradation products may affect the next step in the saccharification of cellulose catalyzed by cellulase.
A kinetic model that completely describes the enzymatic hydrolysis process is essential for reactor design. The Michaelis–Menten model for enzyme kinetics is well suited for application in homogeneous systems. However, many bio-catalytic reactions take place in heterogeneous systems where the effects of mass-transfer and reaction occur, such as accessibility and reactivity of enzymes on insoluble substrates, and enzyme deactivation (Xu and Ding 2007; Bansal et al. 2009). Previous studies have proposed alternative models to simulate enzymatic reactions in a heterogeneous system, such as the jammed Michaelis model, the fractal Michaelis model, and the model of the shrinking particle theory (Movagharnejad and Sohrabi 2003; Xu and Ding 2007; Bansal et al. 2009). These models have the following disadvantages: (i) the models consist of complicated ordinary differential equations that must be solved; (ii) the models contain many parameters that cannot be effectively determined; and (iii) some parameters are arbitrarily selected rather than research supported (Ye and Berson 2011). To overcome the above-mentioned disadvantages of these models, the Impeded Michaelis model has been developed by modifying the Michaelis-Menten model with a time-dependent decay coefficient of impeded enzyme reaction (Yang and Fang 2015a, 2015b). However, this model cannot directly show the correlation between the yield of total reducing sugar (Ytrs) and the initial activity and accessibility of the enzyme on the substrate (Kobs,0) or the gradual loss of enzyme activity (Ki) in a heterogeneous system.
In the authors’ previous study, Aspergillus oryzae CGMCC5992 was isolated from the sludge of the Yudai River at Jiangsu University, and was able to remove chemical oxygen demand (COD) from vinasse (Zhang et al. 2013). When gallic acid is used as the substrate, Aspergillus oryzae CGMCC5992 can synthesize lignin peroxidase (LiP), and laccase (Guo et al. 2013). Proteomic analysis has shown that the strain secretes LiP in the presence of corn stover (CS) (Guan et al. 2015). These enzymes play key roles in the degradation of lignin and aromatic compounds. Furthermore, the authors have developed a method to degrade lignin in CS by combining solid state fermentation and enzymatic hydrolysis, and have found that A. oryzae grows well on H2O2-pretreated CS. This method has a higher synthesis of LiP, a greater disintegration of lignin (Zhang et al. 2014), a reduced treatment time of 10 days rather than 50 days, and an increased efficiency of lignin degradation of 80% compared to the 57.8% efficiency of solid-state fermentation (Zhang et al. 2014). However, it has two major drawbacks of requiring a large production location and having a long fermentation cycle. Recently, a combination of liquid-state fermentation and enzymatic hydrolysis has been applied in the pretreatment of CS, and the Ytrs reaches a maximum of 46.28% (Zhang et al. 2015). In the present study, the authors aimed to further explore the kinetics of enzymatic hydrolysis of cellulose from the CS pre-treated by LiP and assess the effects of various factors on the enzymatic hydrolysis kinetics. Moreover, the authors investigated the correlations between Ytrs and Kobs,0 and between Ytrs and Ki in a heterogeneous system and clarified the enzymatic saccharification law of cellulose in the presence of the degradation products of lignin. This study will help to optimize hydrolysis conditions to lay the foundation for next step in ethanol fermentation, which might include using CS as a raw material.
EXPERIMENTAL
Materials
The CS was obtained from a local farm (Jurong, China) and ground to less than 0.25-mm. The content of hemicellulose, cellulose, and lignin of the ground CS consisted of 26.24%, 32.12%, and 15.42%, respectively. A commercial Trichoderma reesei cellulase was purchased from Guangzhou Global Green Tech. Ltd. (Guangzhou, China). The activities of carboxymethyl-cellulase (CMCase), filter paper enzyme (FPase), b-glucosidase, and hemicellulase were 5.97 × 10⁴ U/mL, 821 FPU/mL, 10.1 U/mL, and 284 U/mL, respectively. All chemicals used were of analytic grade and purchased from East China chemical and glass- Instruments Co. Ltd. (Zhenjiang, China).
Microorganism
The A. oryzae CGMCC5992 applied in the study was isolated from the sludge of the Yudai River at Jiangsu University and stored in the China General Microbiological Culture Collection Center. The strain in all of the experiments was cultured on PDA slants at 28 °C for 4 days, then stored in refrigerator at 4 °C and transferred every 2 months.
LiP preparation
The crude LiP solution was prepared according to the method described by Zhang et al. (2015) with minor modifications. A total of 1 × 10⁶ spores from the A. oryzae slant were inoculated aseptically into a 250-mL Erlenmeyer, loading 100 mL potato dextrose medium and then incubated in a rotary incubator shaker at 35 °C, 125 rpm for 24 h. This culture broth was used as seed in the LiP fermentation. Subsequently, 10 mL of seed culture was aseptically inoculated into a 250-mL Erlenmeyer flask containing 100 mL of minimal medium (pH 6.8 to 7.0). The minimal medium consisted of: 30 g/L CS powder, 2.5 g/L glycerol, 2.5 g/L maltose, 15 g/L yeast extraction, 4.5 g/L (NH4)2SO4, 0.4 g/L FeSO4∙7H2O, 0.4 g/L CuSO4∙5H2O, 1 g/L MnSO4∙H2O, 0.6 g/L MgSO4∙7H2O, 0.1 g/L VB12, and 0.004 g/L glycine. After inoculation, the flask was incubated at 35 °C in a rotary incubator shaker (125 rpm) for 72 h. Then, the incubation broth was centrifuged, and the supernatant was examined to determine the LiP activity. The LiP activity was adjusted to 500 U/L, and the supernatant was used as an enzyme in the lignin hydrolysis.
Oxidative degradation of CS by H2O2 using A. oryzae CGMCC 5992 broth as catalyst
Next, 20 g CS was mixed with 250 mL H2O in a 500-mL three-neck round-bottom flask, and the mixture was pretreated at 110 °C for 10 min and then cooled to 35 °C. Subsequently, 75 mL enzyme solution (the above-described LiP-containing supernatant) was added to the flask, and the mixture solution was stirred at 100 rpm and preheated to 35 °C in the water bath. Then, 100 mL H2O2 (1.5%) was added to the mixture at a flow rate of 0.5 mL/min. After 8 h of hydrolysis, the mixture was filtered, and the filtered residue was dried to a constant weight and used as raw material in the cellulase saccharification reaction. The lignin content of the filtered residue (the pretreated CS) was 9.8%.
Cellulose saccharification in CS after enzymatic catalysis by A. oryzae CGMCC 5992 broth
All saccharification tests of pretreated CS cellulose were conducted in 250-mL Erlenmeyer flasks. First, 10 g CS pretreated with H2O2 and LiP was added into 100 mL of 0.1 mol/L acetate buffer containing 1% cellulase (pH 4.5). After being fully mixed, the initial concentration of reducing sugar was denoted as C0. The saccharification reaction was conducted at 50 °C in a shaking bath (120 rpm) for 12 h. Then, 1-mL samples were collected at 4 h, 8 h, 12 h, 24 h, and 48 h. Each sample was immediately cooled in an ice bath to room temperature to terminate the reaction. The reducing sugar concentration in each flask was denoted as C1. The Ytrs was calculated according the following equation,
![]()
where Ytrs is the yield of total reducing sugar, V is the volume of reaction solution (mL), G is the weight of total dry substrate (g), and C1 and C0 are the reducing sugar concentrations (g/mL) at 0 h and t h of reaction.
Methods
One-factor-at-a-time test
Various factors, including pH, water to materials ratio, temperature, and enzyme concentration, were assessed by the one-factor-at-a-time method. The pH values of the acetate buffer were 2, 3, 4, 5, 6, and 7, respectively. Water to materials ratios were 8:1, 10:1, 12:1, 14:1, and 16:1, respectively. Temperature was set at 35 °C, 40 °C, 45 °C, 50 °C, 55 °C, and 60 °C, respectively. The enzyme concentration was 0.5%, 0.75%, 1%, 1.25%, 1.5%, and 2%, respectively.
Response surface design
The effects of reaction temperature, pH of acetate buffer, water to materials ratio, and enzyme concentration on Ytrs were evaluated via the Box–Behnken Design (BBD) modification of the response surface design (Amini et al. 2009a, 2009b; Cerino-Córdova et al. 2011, 2012; Dávila-Guzmana et al. 2012). A four-factor and three-level response surface analysis was designed using Ytrs, the initial observed rate constant (Kobs,0), and the coefficient of the ineffective enzyme during the hydrolysis reaction (Ki) as response variables. The reaction pH of the acetate buffer, temperature, water-to-material ratio, and cellulase concentration were used as independent variables. Table 1 shows the levels of the variables that were identified from the results of the one-factor-at-a-time experiments.
Table 1. Factors and Levels of Box-Behnken Design of Response Surface*
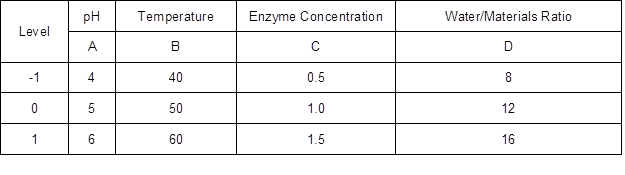
*: The units of temperature and enzyme concentration were °C and %.
Analysis
The LiP activity of the broth was spectrophotometrically (Shanghai Analytical Instrument Co., Ltd., Shanghai, China) measured according to the method described by Mitchell and Lonsane (1993). The reaction solution consisted of 1.5 mL of 10 mM veratryl alcohol, 50 μL enzyme sample, and 0.25 M sodium tartrate buffer (pH 2.5). The reaction was initiated by adding H2O2 (5 mM). One unit (U) of LiP activity was defined as the amount of enzyme required to oxidize 1 μmol veratryl alcohol to veratryl aldehyde in 1 min at 30 °C. The total lignin content (acid-soluble lignin + acid-insoluble lignin) of substrates and raw materials was determined as recommended by Sluiter et al. (2008). The reducing sugar concentration in the hydrolysis solution was identified according to the 3,5-dinitrosalicylic acid method (Miller 1959).
All tests were repeated at least three times, and the results were presented as means due to their negligible standard errors. All data were fitted using Microsoft Excel (Microsoft, Redmond City, America) and SPSS 17.0 software (IBM, Ammonst City, USA). The analysis of Box–Behnken Design (BBD) was performed with the Design-Expert version (8.0.4). All the regression equation and the analysis of variance (ANOVA) were performed using SPSS 17.0 software.
Impeded Michaelis kinetic model
The enzymatic saccharification of CS pretreated with H2O2 and LiP was conducted in a heterogeneous system, in which many factors affect the reaction kinetics. These factors include product inhibition, mass-transfer resistance, interaction between enzyme and the inert, nonreactive site of lignocellulosic biomass, and enzyme inhibition (Gan et al. 2003). Based on the Michaelis–Menten model with minor modifications, the impeded kinetic model in a heterogeneous system constructed by Yang et al. (2015a, 2015b) was applied to fit all of the test data.
Michaelis–Menten model believes that the enzymatic reaction process is divided into two step including that the substrate (S) combined with enzyme (E) forms the enzyme-substrate complex (ES) and that ES is converted into E and product (P).
According to impeded Michaelis kinetic model, the efficiency dependent upon the pretreatment on the substrate, the initial accessibility of cellulase to the cellulose of pretreated CS, and the activity of cellulase on the cellulose (Kobs,0) = k2(E0) / Km, the correlation between the yield of total reducing sugar (Ytrs), reaction time (t) and Kobs,0 was as follows,
where E0 is the initial enzyme concentration, k2 is the rate constants from enzyme-substrate complex to product, Km is the Michaelis constant, and α is a constant. The coefficient of the time-dependent inactive enzyme (Ki) can be calculated according to the constant α and the following equation,
where inactive enzyme results from the combined effects of product inhibition, the action of enzyme on the inert and nonreactive site of lignocellulose biomass, and the mass-transfer resistance for enzymes. Equation 2 can be solved to give:

Equation 4 then can be rearranged as,

where Eq. 5 was applied to fit the experimental results by plotting t / (−ln(1 – Ytrs)) versus t. The coefficient of t term and the constant term are α / Kobs,0 and 1 / Kobs,0, respectively. The value for Ki was calculated according to Eq. 3, and the predicted Ytrs (Ytrs, pred) was calculated under optimum condition according to the equation below.

RESULTS AND DISCUSSION
In the enzymatic degradation of solid cellulose, the action of cellulase in the mobile components of insoluble cellulosic substrates produces chemical and physical changes, resulting in an increased release of the residual lignin or lignin monomer in the residual solid phase of pretreated CS (Balat and Balat 2008). Because the enzymatic saccharification of cellulose is a rather slow process, these actions and the feedback inhibition of the products are negligible in the initial reaction stage.
One-factor-at-a-time Method
All Ytrs determined at various time in the one-factor-at-a-time are shown in Table 2. Table 3 shows Kobs,0 and Ki obtained from the regression equation and the ANOVA of the data. All p values were less than 0.01 and R2 was close to adj-R2 in Table 3, which implied that all fitted equations were statistically significant (p<0.05) and all data were reliable.
Effect of water to materials ratio
The addition of water may have three effects on the system. Firstly, it will tend to favor enzyme diffusion from the solution to the reaction interface, and the product diffusion from the reaction interface to the solution. Secondly, addition of water affects the microenvironment of the enzyme, which can affect catalytic activity and susceptibility to denaturation (Liu et al. 2010; Salum et al. 2010; Liu et al. 2011). Thirdly, water protects the cellulase from combining residual lignin and degrading products, which further affects the reaction velocity. However, if the water-to-material ratio is too high, it will reduce the concentrations of enzyme and substrate, which will decrease the reaction rate. Similarly, high water-to-material ratio leads to lower ethanol concentration, increasing the cost of subsequent ethanol-water distillation, and the volume of reactors. Therefore, the optimal water-to-material ratio must provide enzymatic saccharification and require low cost to concentrate the final product. The authors studied the effect of the water-to-material ratio on the saccharification kinetics of cellulose, as shown in Table 2. Table 3 reveals the variation tendency of parameters Kobs, 0, and Ki from the kinetic equation (5) with an increase of water to materials ratio. Tables 2 and 3 shows that (1) Ytrs at 12 h of reaction and Kobs, 0 gradually increased from 39.60% to 50.42%, and from 0.2762 h-1 to 0.3537 h-1, respectively, when the water to materials ratio increased from 8:1 to 10:1, and that they gradually decreased with further increase of the water to materials ratio; (2) Ki presented a U-shaped curve when the water to materials ratio was changed within the tested range; (3) the minimum Ki (0.1231 h-1) was obtained at a water to materials ratio of 12:1. Because Kobs,0 = k2[E0] / Km and [E0] was the initial cellulase concentration and a constant in the experiment, an increase of Kobs,0 hinted at an increase of k2 or decrease of Km. The Km value represents the affinity of the reaction between the enzyme and substrate. When Km was smaller, the affinity was greater and vice versa. Because Ki was the coefficient of the ineffective enzyme during the hydrolysis reaction, a lower Ki indicated that there was less ineffective enzyme and more effective enzyme. Therefore, it was deduced that the water to materials ratio increased Ytrs by adjusting the affinity between the enzyme and substrate, which led to an increased amount of effective enzyme. Under the condition of a lower water to materials ratio, diffusion was limited, Kobs,0 decreased, Ki increased, and Ytrs decreased. Under the condition of a higher water to materials ratio, the concentrations of cellulase and substrate decreased, as did Ytrs.
Table 2. Yield of Total Reducing Sugar (Ytrs) in One-Factor-at-a-Time (%)
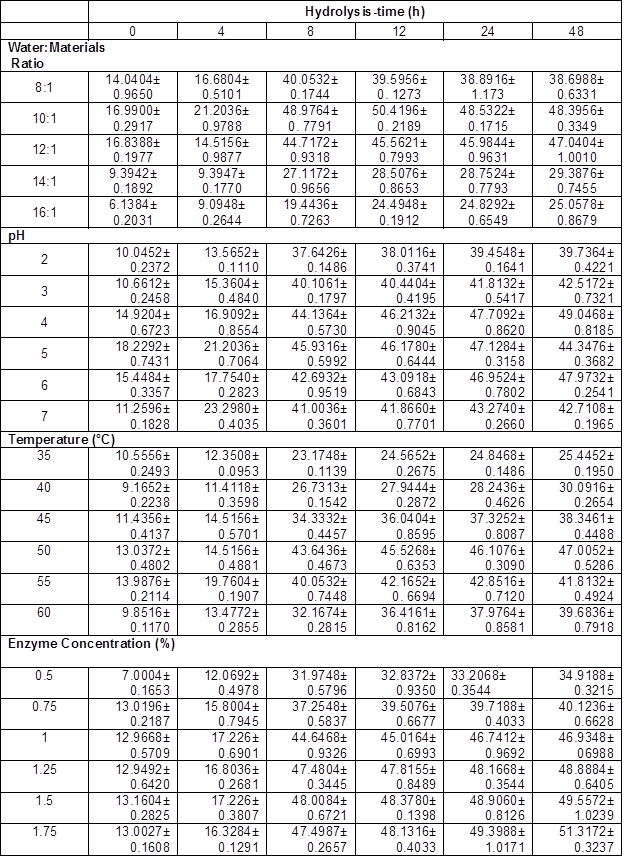
Table 3. Results of Regression Analysis in One-Factor-at-a-Time Experiment
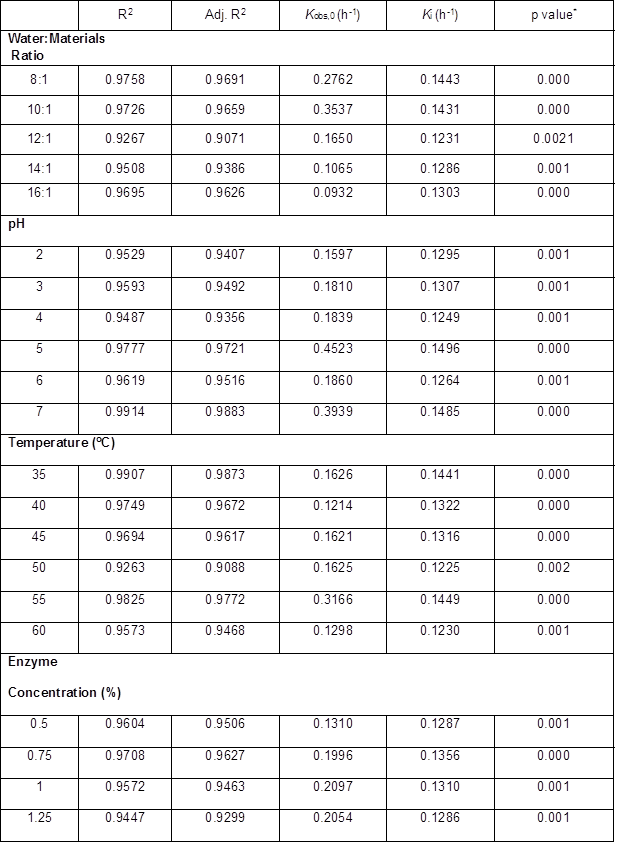
*: p value is Prob > F
Effect of pH
The shape of the pH effect curve on the Ytrs, Kobs,0, and Ki of a hydrolysis reaction was determined by the pH. The pH could change the structure of enzymes and the charge quantities on the binding and catalysis sites of enzymes, thus affecting the reaction velocity. In the present study, the authors compared the pH effect of reaction resolution on Ytrs, Kobs,0, and Ki of the cellulose saccharification reaction of pretreated CS. The Ytrs in Table 2 and Kobs,0 in Table 3 had a maximum, respectively, and Ki presented a wavy-value with pH change within the tested range, as shown in Table 3. The maximum response of Ytrs and Kobs,0 occurred between a pH of 4.0 to 5.0. The results showed that pH increased Ytrs by increasing the affinity of the enzyme and the substrate, or the reaction velocity from the enzyme-substrate complex to the product when pH was increased from 2.0 to 4.0. The authors’ result was different from the results of the cellulase hydrolysis of Douglas fir treated with a wet explosion pretreatment using CCD, where 5.5 is the optimal pH for the maximum Ytrs (Biswas et al. 2015a,b). This discrepancy could have been explained by differences in the substrates and the sources and properties of the cellulase. The primary driving force for enzyme action is binding cellulase via their surface hydrophobic properties, which can be affected by suspension pH through surface functional groups (Lan et al. 2012). The wavelike Ki curve shows that the pH effect on the combination of the inhibitor (lignin) and the site in the enzyme was unsynchronized with the pH change.
Effect of temperature
An increase in the reaction temperature might have increased the saccharification reaction velocity, though this occurred only over a strictly limited temperature range. The reaction velocity is initially increased as an increasing temperature certainly increases the mobility of molecules, but also increase the kinetic constant of the reaction (Arrhenius equation). However, the kinetic energy of the enzymes exceeded the energy barrier for breaking the weak hydrogen and hydrophobic bonds. At a higher temperature, denaturation predominated, accompanied by a loss of catalytic activity.
To explore the optimal temperature of saccharification, the authors performed the saccharification reaction at a series of temperatures, (35 °C, 40 °C, 45 °C, 50 °C, 55 °C and 60 °C) and investigated the effect of reaction temperature on Ytrs, Kobs,0, and Ki , as shown in Table 2 and Table 3.
Tables 2 and 3 show the variation tendency for the Ytrs, Kobs,0 and Ki. The maximum Ytrs (45.53%) at 12 h of reaction was obtained at 50 °C (Table 2), while the maximum Kobs,0 (0.3166 h-1) was obtained at 55 °C (Table 3). The Ki was gradually decreased from 0.1441 h-1 to 0.1225 h-1 when the temperature increased from 35 °C to 50 °C (Table 3). The Ki then increased from 0.1225 h-1 to 0.1449 h-1 when the temperature was further increased from 50 °C to 55 °C. Based on these results, the authors deduced that when the temperature was lower than 50 °C, the increase in temperature increased the affinity between the substrate and enzyme, and facilitated the conversion of the enzyme-substrate complex into product, which resulted in a decreased concentration of ineffective enzyme, increased concentration of effective enzyme, and an increased Ytrs. When the temperature was between 50 °C and 55 °C, the increase in temperature enhanced the affinity between the substrate and the enzyme, and facilitated the conversion of the enzyme-substrate complex into product. However, the amount of ineffective enzyme also increased.
Effect of enzyme concentration
Enzyme concentration was found to be a key factor in controlling the speed of CS saccharification. In general, higher enzyme concentration led to an increased Ytrs. Tables 2 and 3 show the effect of cellulase concentration on Ytrs, Kobs,0, and Ki. Table 3 summarizes the results of the ANOVA analysis. All p values were less than 0.01 and R2 was close to the adj-R2 in Table 3, which suggested that these equations provided a good fitting degree. From Table 2 and Table 3, it was clear that when the enzyme concentration increased from 0.5% to 1.5%, Ytrs at 12 h of reaction gradually increased from 32.84% to 48.38%, and Kobs,0 increased from 0.1310 h-1 to 0.2107 h-1. However, Ki remained stable within a range of enzyme concentrations. This finding could have been explained by the substrate absorption. Many studies have reported that solid substrate can absorb some enzymes (Vallander and Eriksson 1987; Lee et al. 1994; Rosgaard et al. 2007). Unsurprisingly, the Ytrs increased with enzyme concentration. When the enzyme concentration in the reaction mixture was very low, the substrate (CS) adsorbed fewer enzymes, and the Ytrs and Kobs,0 were positively correlated with enzyme concentration. Therefore, when the enzyme concentration was less than 1.5%, Ytrs and Kobs,0 rapidly increased with enzyme concentration. However, after substrate adsorption reached the saturation state, the excessive enzymes in the solution could not be absorbed, and the Ytrs and Kobs,0 were slowly increased when the enzyme concentration increased from 1% to 2%. This finding could have been explained by substrate limitation.
Optimization of LiP Synthesis Conditions Using RSM
Based on the results of the one-factor-at-a-time method, the water to materials ratio, pH, reaction temperature, and cellulase concentration were selected as the most influential factors. The authors further investigated the effect of their interactions on the Ytrs, Kobs,0, and Ki of the saccharification kinetics of cellulose in CS using BBD with four factors, three levels, and three response values (a total of 29 experiments, as shown in Table 4). Three levels were coded as -1, 0, and +1 (Dávila-Guzmana et al. 2012). The second-order polynomial equation to fit the experimental results and identify the relevant model terms was based on Eq. 7 as follows,
| Y =β0+ΣβiXi+ΣβijXiXj+Σβii(Xi)2 | (7) |
where Y is the predicted response, β0 is the constant, βi is the linear coefficient, βij is the interaction coefficient, βii is the quadratic coefficient, and Xi and Xj are the coded independent variables (Cerino-Córdova 2012).
Table 4. Box-Behnken Design of Response Surface Method and the Run Results
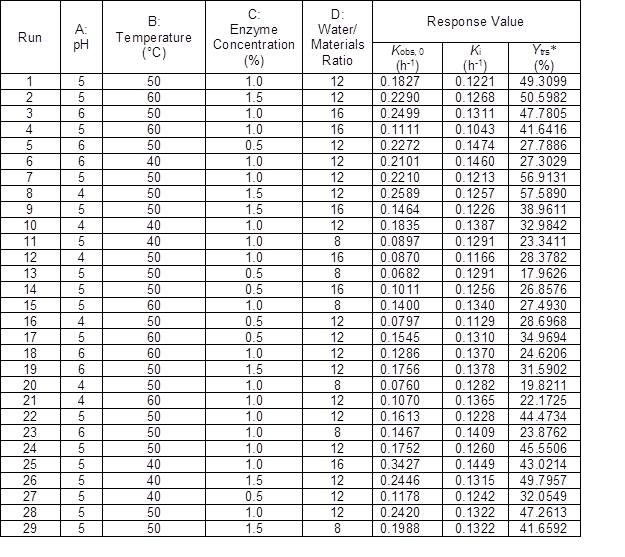
*:Ytrs was the yield of total reducing sugar at 12 h of reaction
Tables 5 and 6 exhibit the authors’ test data conducted with the independent variable t and the three dependent variables Ytrs, Kobs,0, and Ki of each run in the response surface designs, respectively. After plotting the t / −ln(1 − Ytrs) vs. t of the experimental data in 29 runs, it was fitted with Eq. 5, the corresponding regression equation, and the R2, adj-R2, and p values are shown in Table 6. All p values were less than 0.01 and R2 was close to adj-R2 in Table 6, which suggested that the 29 fitted equations were highly significant.
Table 5. Yield of Total Reducing Sugar (Ytrs) at Various Hydrolysis Time of Each Run of Response Surface (%)
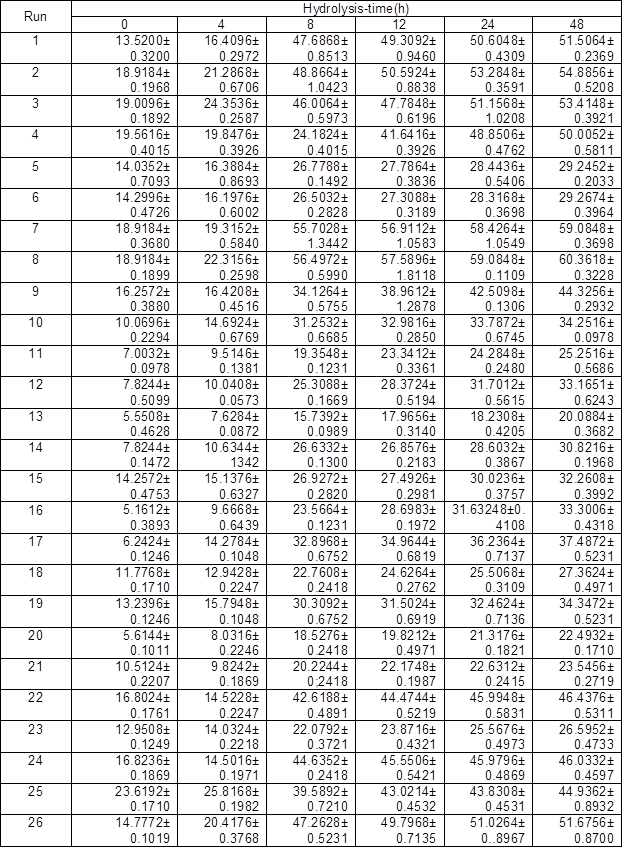
Table 6. Regression Analysis of Each Run of RSM *: p value is Prob > F
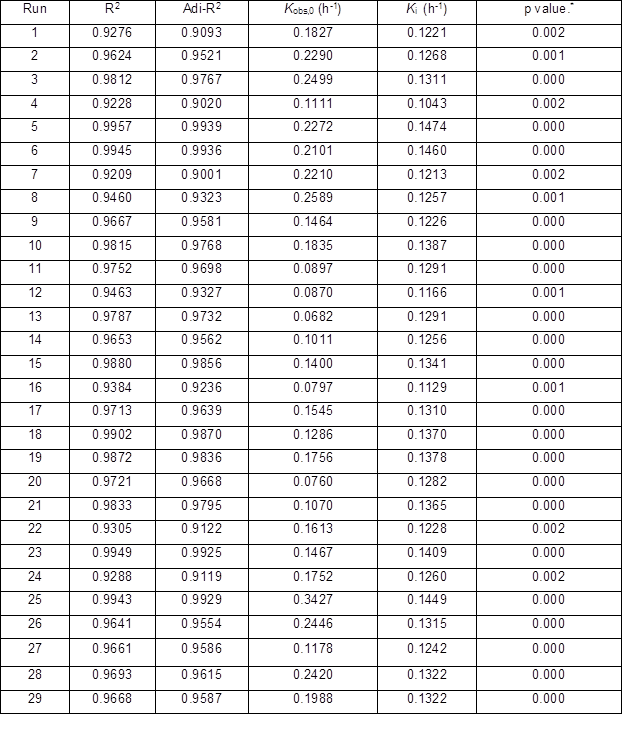
Table 7. ANOVA Analysis for Quadratic Response Surface Model Fitting
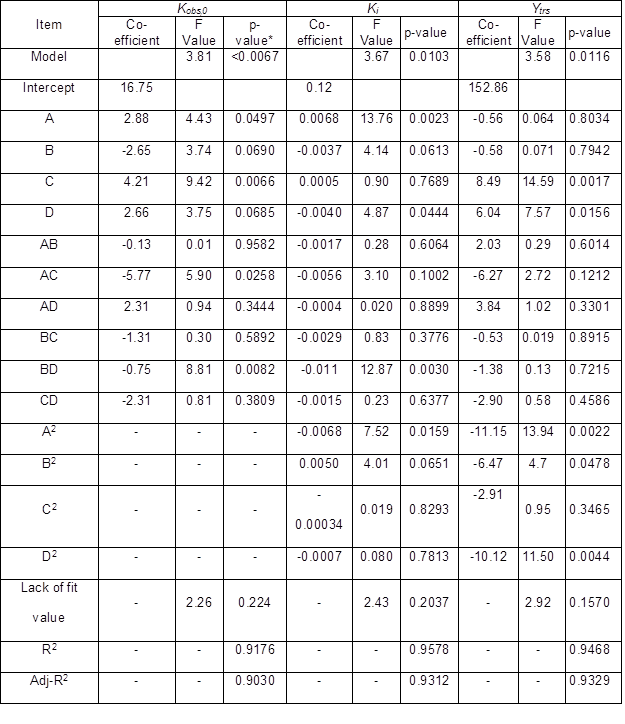
*: p value is Prob > F
The ANOVA testing was useful in that it could be used to determine the “goodness of fit” of a quadratic model. Table 7 summarizes the ANOVA results. Three quadratic models’ F values of Ytrs, Kobs,0, and Ki were 3.58, 3.81, and 3.67, respectively, which indicated that three developed quadratic models were significant (p < 0.05). There was only a 1.16%, <0.67%, and 1.03% chance for Ytrs, Kobs,0, and Ki, respectively, that a model F value could occur due to chance. Because the three models showed insignificant “lack of fit F values”, which were 2.92, 2.26, and 2.43, respectively, three response values of Ytrs, Kobs,0, and Ki were sufficiently explained by three regression equations.
The goodness of fit of the three models was also confirmed by the R2 values of the three regression models. The R2 values of Ytrs, Kobs,0, and Ki were 0.9486, 0.9176, and 0.9578, respectively, which were higher than the highest reported R2 value of 0.80 in a model with good fit (Govarthanan et al. 2015). These results indicated that the predictability of the three models was relatively more reliable, and that the three response values of Ytrs, Kobs,0, and Ki were sufficiently explained by the three regression equations. Their adjusted R2 was 0.9329, 0.9030, and 0.9312, which was close to their R2 values, and indicated a good adjustment of the theoretical response values to the experimental data by the developed model. The three regression relationships were given in three equations as follows,
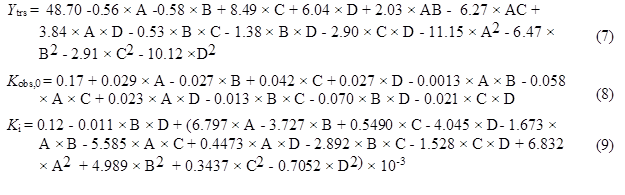
where A is pH, B is temperature (°C), C is enzyme concentration (%), and D is water to materials ratio.
The p values of “Prob > F” of the model term were less than 0.0500, which indicated that the terms were significant. Terms C, D, A2, B2, and D2 were significant in the Ytrs model. In the Kobs,0 model, terms A, C, AC, and BD were signifcant, and terms A, D, BD, and A2 were significant terms in the Ki model. Therefore, the Ytrs model contained two linear terms (C, D), three quadratic terms (A, B, and D), and one block term; the Kobs,0 model contained two linear terms (A, C), two interaction terms (AC and BD), and one block term; the Ki model consisted of two linear terms (A, D), one interaction term (BD), one quadratic term (A2), and one block term.
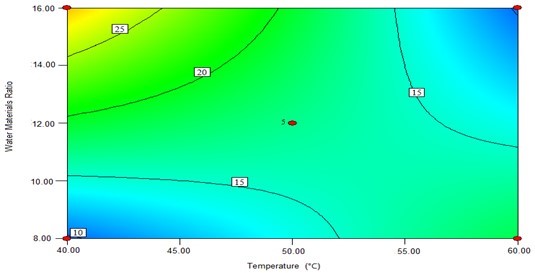
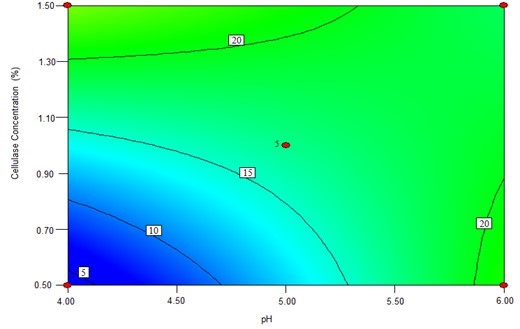
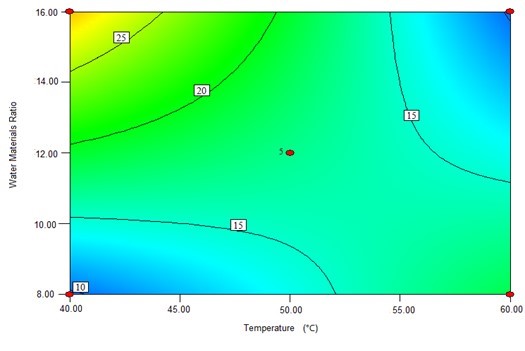
The contour plots were constructed to study the interaction among the various factors and to optimize each factor for optimal production (Beg et al. 2003; Tanyildizi et al. 2005). Figure 1 illustrates 2D contour plots with the effects of temperature, water to materials ratio, pH, and, cellulose concentration on Kobs,0 and the effects of temperature and water to materials ratio on Ki. Figure 1a shows that when the temperature was increased from 40 °C to 60 °C, and the water to materials ratio decreased from 16:1 to 8:1, Kobs.0 decreased from its maximum to its minimum. Figure 1b demonstrates that when the pH cellulase concentration increased within the tested range, Kobs,0 rapidly increased. Figure 1c shows the effects of temperature and water to materials ratio on Ki. When the temperature increased from 40 °C to 50 °C and the water to materials ratio increased from 8:1 to 16:1, the Ki gradually decreased, whereas when the temperature was further increased from 55 °C to 60 °C, the Ki increased.
(a)
(b)
(c)
Fig. 1. The contour plots of the response surface methods; (a) Effects of temperature and water to materials ratio on Kobs,0; (b) Effects of pH and cellulase on Kobs,0; and (c) Effects of temperature and water to materials ratio on Ki
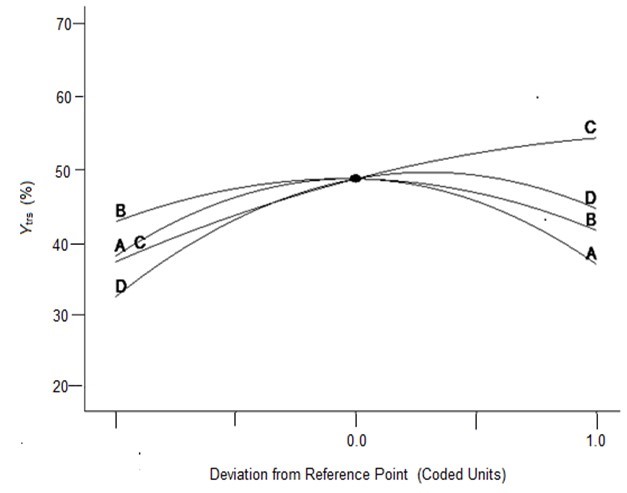
To verify the effects of the four variables on Ytrs, Kobs,0, and Ki, the authors further analyzed the perturbation plots as shown in Fig. 2. Figure 2a shows that the effect curves of pH, temperature, and water to materials ratio on the Ytrs resulted in an inverted-U-shaped curve, and that the effect curve of cellulase concentration on Ytrs resembled a line. The optimal condition for the maximum Ytrs was a pH of 4.7, a temperature of 48.6 °C, a cellulase concentration of 1.5%, and a water to materials ratio of 12.4. Under such conditions, the maximum Ytrs,pred was 55.56%. Figure 2b shows that the effect curves of the four variables on the Kobs,0 were close to straight lines. The cellulase concentration was positively correlated with Kobs,0, whereas other variables were negatively correlated with Kobs,0. The optimal conditions predicted for Kobs,0 were a pH of 6.0, a temperature of 40 °C, a cellulase concentration of 0.53%, and a water to materials ratio of 16:1. Under such conditions, the maximum Kobs,0 was 0.3656 h-1. Figure 2c shows that the effect curves of pH and temperature on Ki presented a U-shaped curve, and the effect curves of cellulase concentration and water to materials ratio on Ki were close to a line. The optimal condition for the minimum Ki was a pH of 4.0, a temperature of 60 °C, a cellulase concentration of 0.55%, and water to materials ratio of 16:1. Under such conditions, the minimum predicted Ki was 0.1100 h-1.
(a)
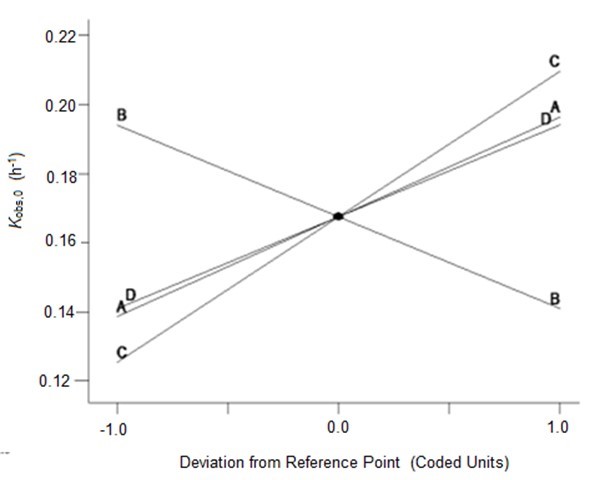
(b)
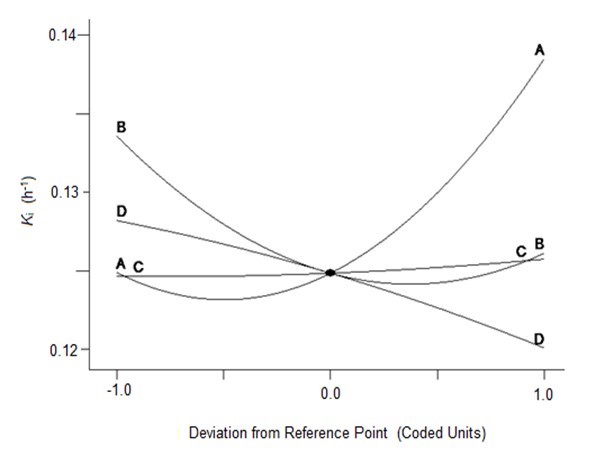
(c)
Fig. 2. Perturbation of the response surface methods; (a) Ytrs, (b) Kobs,0, and (c) Ki
In conclusion, the optimal medium for maximum Ytrs was determined using a one-factor-at-a-time design and a BBD-RSM. The predicted maximum Ytrs, Kobs,0, and minimum Ki were 55.56%, 0.3656 h-1, and 0.1100 h-1, respectively. The predicted value of Ytrs was relatively high compared to previously reported yields (Zhang et al. 2015; Chakraborty et al. 2016). The optimized conditions were a pH of 4.7, a temperature of 48.6 °C, a cellulase concentration of 1.5%, and a water to materials ratio of 12.4. Using the optimized culture medium, 2 kg of CS pretreated with H2O2 and LiP-containing A. oryzae CGMCC 5992 broth was hydrolyzed. The Ytrs, Kobs,0, and Ki reached 58.28%, 0.3532 h-1, and 0.1323 h-1, respectively, after 12 h of hydrolysis, which was consistent with the results of RSM optimization.
Analysis of Correlation Between Ytrs, Kobs,0, and Ki
The Impeded Michaelis model was developed and verified, indicating that it could be applied to other hydrolysis systems (Yang and Fang 2015a,b). The p values were less than 0.01 and R2 was higher than 0.9 in all regression equations in the above-described experiments, which suggested that the Impeded Michaelis model fit the results well. By providing Kobs,0 and Ki,, the model helped to illustrate the mechanism through which each condition affected Ytrs in the process of lignocellulose saccharification. However, the model was not able to show the correlation between Ytrs and Kobs,0 or Ki, which was a disadvantage.
Because Kobs,0 was equal to k2[E0] / Km, and [E0] was the initial cellulase concentration, which was a constant, Kobs,0 was proportional to k2 / Km. The variable k2 represents the rate constant facilitating reactions from enzymatic-substrate complex to final products. The greater the value of k2, the higher the final product (reducing sugar) concentration will be (Ytrs). The term Km represents the Michaelis-Menten constant, which reflects the concentration of the substrate when the reaction velocity is equal to one half of the maximal velocity for the reaction. The smaller the value of Km, the greater the affinity, the greater the value of Ytrs and vice versa. Therefore, it was reasonable to deduce that Ytrs was positively correlated with Kobs,0. The variable Ki is the coefficient of ineffective enzyme during the hydrolysis reaction, thus a lower value of Ki indicated less ineffective enzyme and more effective enzyme. Taken together, the authors believed that the Ytrs was negatively correlated with Ki.
To verify the two deductions, the authors analyzed the data on Ytrs, Kobs,0, and Ki in Tables 2, 3, 5, and 6 with a more simple and intuitive binary quadratic regression using the following function,
![]()
where α, b, c, and d are the coefficients of (Kobs,0)2, Kobs,0, (Ki)2, and Ki, respectively, and e is a constant.
Table 8. Coefficient of Regression Analysis of Items between Ytrs, Kobs,0, and Ki*
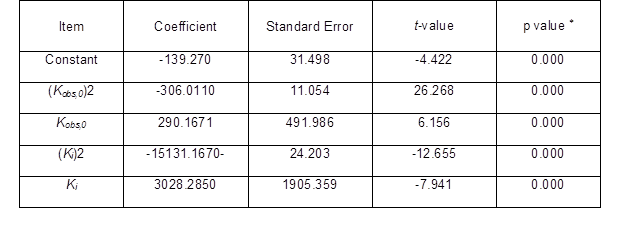
*: F-value = 574.458, p = 0.000, R2 = 0.9801, adj-R2 = 0.9779
Table 8 shows the variance analysis of the relationships among Ytrs, Kobs,0, and Ki. From Table 8, the F value of the Fisher’s test (574.458) and the p value of the t-test (0.000) showed that the correlation among Ytrs, Kobs,0, and Ki was extremely significant, and that the credibility of the analysis was extremely high. The fitness of the model was also confirmed by the R2 value. The value for R2 was 0.9801, which was higher than the reported highest R2 value of 0.80 in a good fitting model (Govarthanan et al. 2015). This indicated that the predictability of the present model was relatively more reliable and that only 2% of the total variations were unable to be explained by the model. The adjusted R2 was 0.9779, which was very close to the R2 value. The proximity of the adjusted R2 to R2 suggested a good fitness of the model. The column diagram of model with better gaussian distribution could further establish the goodness of fit of the developed model Fig. 3. The analysis in Table 8 demonstrated that a significant correlation existed among Ytrs, Kobs,0, and Ki.
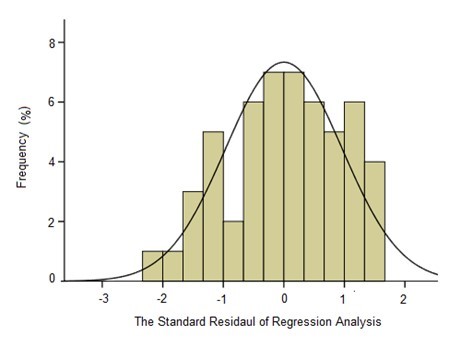
Fig. 3. The column diagram of the standard residual of regression analysis; the dependent variable: Ytrs; the independent variables: Kobs,0 and Ki; the standard error = 0.961; and df = 54
Coefficients for all of the parameters were extremely significant (p = 0.000). The negative coefficients of (Kobs,0)2 and (Ki)2 in Table 8 demonstrated that the relationship curve between Ytrs and Kobs,0 or between Ytrs and Ki appeared to have an inverted-U-shaped relationship, and that Ytrs had the maximum value. After the coefficient of each item in Table 8 was introduced into Eq. 10, the equation below was given.
![]()
The following two equations were obtained by taking the derivation of pt to Kobs,0 and Ki, respectively.
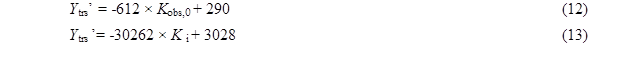
Suppose that Ytrs’= 0, Kobs,0 = 290 / 612 = 0.4739, and Ki = 3028 / 30262 = 0.1001. When Kobs,0 < 0.4739 and Ki < 0.1001, it follows that Ytrs’ > 0, which could have been explained by the finding that Ytrs was significantly positively correlated with Kobs,0 and Ki. Conversely, when Kobs,0 > 0.4739 and Ki > 0.1001, then Ytrs’ < 0, which could have been explained by the finding that Ytrs was significantly negatively correlated with Kobs,0 and Ki. When Kobs,0 = 0.4739 and Ki = 0.1001, Ytrs reached its maximum (82.07%). In Table 3 and Table 6, all Kobs,0 values were less than 0.4739 and all Ki values were higher than 0.1001. The Ytrs was positively correlated with Kobs,0 and negatively correlated with Ki. Because Kobs,0 was the initial activity and accessibility of enzyme on the substrate and Ki was the coefficient of ineffective enzyme during the hydrolysis reaction, the Ytrs was positively correlated with the initial activity and accessibility of the enzyme on the substrate and negatively correlated with the coefficient of ineffective enzyme during the hydrolysis reaction. The regression analysis could more simply and intuitively exhibit the correlation between Ytrs and Kobs,0 and the correlation between Ytrs and Ki than the Impeded Michaelis model.
CONCLUSIONS
- A simplified Impeded Michaelis kinetic model containing two independent variables (Kobs,0 and a) and one dependent variable (Ytrs) could be applied to fit the data of the saccharification reaction cellulose of CS after pre-treatment with a combination of LiP and H2O2. The Ki was calculated from the variable a.
- One-factor-at-a-time experimentation and RSM were applied to optimize the conditions for obtaining maximum Ytrs and Kobs,0 and minimum Ki. After optimization, the maximum Ytrs (55.56%) was obtained.
- The binary quadratic function model fit the correlations between Ytrs and Kobs,0 and between Ytrs and Ki. The profile curves between Ytrs and Kobs,0 and between Ytrs and Ki presented an inverted-U-shaped curve.
- Under the tested conditions, Ytrs was significantly and positively correlated with Kobs,0 and negatively correlated with Ki.
ACKNOWLEDGEMENTS
The authors would like to sincerely thank the following for their generous research grant funding: Taixing Yiming Bioproduction Co. Ltd., the Scientific and Technological Innovation Projects of Jiangsu Province General University Graduate Students (No. CXLX13687), the National Natural Science Foundation of China (No.31101269), the China Postdoctoral Science Foundation (2015M571691), the Senior Talent Scientific Research Initial Funding Project of Jiangsu University (15JDG061), and the 2014 Excellent Key Young Teachers Project of Jiangsu University.
REFERENCES CITED
Amini, M., Younesi, H., and Bahramifar, N. (2009a). “Statistical modeling and optimization of the cadmium biosorption process in an aqueous solution using Aspergillus niger,” Colloids Surf. A- Physicochem. Eng. Asp. 337(1-3), 67-73. DOI: 10.1016/j.colsurfa.2008.11.053
Amini, M., Younesi, H., and Bahramifar, N. (2009b). “Biosorption of nickel (II) from aqueous solution by Aspergillus niger: Response surface methodology and isotherm study,” Chemosphere 75(11), 1483-1491. DOI: 10.1016/j.chemosphere.2009.02.025
Balat, M.., and Balat, H. (2008). “Progress in bioethanol processing,” Prog. Energy Combust. Sci. 34(5), 551-573. DOI: 10.1016/j.pecs.2007.11.001
Bansal, P., Hall, M., Realff, M. J., Lee, J. H., and Bommarius, A. S. (2009). “Modeling cellulase kineticson lignocellulosic substrates,” Biotechnol. Adv. 27(6), 833-848. DOI: 10.1016/j.biotechadv.2009.06.005
Baeyens, J., Kang, Q., Appels, L., Dewil, R., Lv, Y., and Tan, T. (2015). “Challenges and opportunities in improving the production of bio-ethanol,” Prog. Energy Combust. Sci. 47(1), 60-88. DOI:10.1016/j.pecs.2014.10.003
Beg, Q. K., Sahai, V., and Gupta, R. (2003). “Statistical media optimization and alkaline protease production from Bacillus mojavensis in a bioreactor,” Process Biochem. 39(3), 203-209. DOI: 10.1016/S0032-9592(03)00064-5
Bellido, C., Loureiro-Pinto, M., Coca, M., Gonzalez-Benito, G., and Garcia-Cubero, M. T. (2014). “Acetone-butanol-ethanol (ABE) production by Clostridium beijerinckii from wheat straw hydrolysates: Efficient use of penta and hexa carbohydrates,” Bioresource Technol. 167(1), 198-205. DOI: 10.1016/j.biortech.2014.06.020
Biswas, R., Teller, P. J., and Ahring, B. K. (2015). “Pretreatment of forest residues of douglas fir by wet explosion for enhanced enzymatic saccharification,” Bioresource Technol. 192(1), 46-53. DOI: 10.1016/j.biortech.2015.05.043
Biswas, R., Uellendahl, H., and Ahring, B. K. (2015). “Wet explosion: A universal and efficient pretreatment process for lignocellulosic biorefineries,” Bioenerg. Res. 8(3), 1101-1116. DOI: 10.1007/s12155-015-9590-5
Cao, W., Sun, C., Qiu, J., Li, X. D., Liu, R. H., and Zhang, L. (2016). “Pretreatment of sweet sorghum bagasse by alkaline hydrogen peroxide for enhancing ethanol production,” Korean J. Chem. Eng. 33(3), 873-879. DOI: 10.1007/s11814-015-0217-5
Cerino-Córdova, F. J., García-León, A. M., Garcia-Reyes, R. B., Garza-González, M. T., Soto-Regalado, E., Sánchez-González, M. N., and Quezada-López, I. (2011). “Response surface methodology for lead biosorption on Aspergillus terreus,” Int. J. Environ. Sci. Technol. 8(4), 695-704. DOI: 10.1007/BF03326254
Cerino-Córdova, F. J., García-León, A. M., Soto-Regalado, E., Sánchez-González, M. N., Lozano-Ramírezb, T., García-Avalos, B. C., and Loredo-Medrano, J. A. (2012). “Experimental design for the optimization of copper biosorption from aqueous solution by Aspergillus terreus,” J. Environ. Manag. 95, S77-S82. DOI: 10.1016/j.jenvman.2011.01.004
Chakraborty, S., Gupta, R., Jain, K. K., and Kuhad, R. C. (2016). “Cost-effective production of cellulose hydrolysing enzymes from Trichoderma sp. RCK65 under SSF and its evaluation in saccharification of cellulosic substrates,” Bioprocess Biosyst. Eng. 39(11), 1659-1670. DOI: 10.1007/s00449-016-1641-6
Dávila-Guzmana, N. E., Cerino-Córdova, F. J., Diaz-Floresb, P. E., Rangel-Mendez, J. R., Sánchez-González, M. N., and Soto-Regalado, E. (2012). “Equilibrium and kinetic studies of ferulic acid adsorption by Amberlite XAD-16,” Chem. Eng. J. 183(1), 112-116. DOI: 10.1016/j.cej.2011.12.037
Gan, Q., Allen, S. J., and Taylor, G. (2003). “Kinetic dynamics in heterogeneous enzymatic hydrolysis of cellulose: An overview, an experimental study and mathematical modeling,” Process Biochem. 38(7), 1003-1018. DOI: 10.1016/s0032-9592(02)00220-0
Govarthanan, M., Selvankumar, T., Selvam, K., Sudhakar, C., Aroulmoji, V., and Kamala-Kannan, S. (2015). “Response surface methodology based optimization of keratinase production from alkali-treated feather waste and horn waste using Bacillus sp. MG-MASC-BT,” J. Ind. Eng. Chem. 27(6), 25-30. DOI: 10.1099/00207713-50-2-831
Guan, G. Q., Zhang, Z. C., Ding, H. X., Li, M., and Shi, D. F. (2015). “Enhanced degradation of lignin in corn stalk by combined method of Aspergillus oryzae solid state fermentation and H2O2 treatment,” Biomass. Bioenerg. 81(2), 224-233. DOI: 10.1016/j.biombioe.2015.07.008
Guo, D. Z., Zhang, Z. C., Liu, D., and Chen, K. P. (2013). “A comparative study on the degradation of gallic acid (GA) by Aspergillue oryzae and Phanerochaete chrysosporium,” Water Sci. Technol. 70(1), 175-181. DOI: 10.2166/wst.2014.213
Kang, Q., Huybrechts, j., Van Der Bruggen, B., Baeyens, J., Tan, T., and Dewil, R. (2014). “Hydrophilic membrances to replace molecular sieves in dewatering the bioethanol/water azeotropic mixture,” Sep. Purif. Technol. 136(1), 144-149. DOI:10.1016/j.seppur.2014.09.009
Lan, T. Q., Lou, H., and Zhu, J. Y. (2012). “Enzymatic saccharification of lignocelluloses should be conducted at elevated pH 5.2–6.2,” Bioenerg. Res. 6(2), 476-485. DOI: 10.1007/s12155-012-9273-4
Lee, D., Yu, A. H. C., and Saddle, J. N. (1994). “Evaluation of cellulase recycling strategies for the hydrolysis of lignocellulosic substrates,” Biotechnol. Bioeng. 45(4), 328-436. DOI: 10.1002/bit.260450407
Liu, Y., Liu, T., Wang, X., Xu, L., and Yan, Y. (2011). “Biodiesel synthesis catalyzed by Burkholderia cenocepacia lipase supported on macroporous resin NKA in solvent-free and isooctane systems,” Energ. Fuel. 25(9), 1206-1212. DOI: 10.1021/ef200066x
Liu, Y., Tan, H., Zhang, X., Yan, Y., and Hameed, B. H. (2010). “Effect of monohydric alcohols on enzymatic transesterification for biodiesel production,” Chem. Eng. J. 157(2), 223-229. DOI: 10.1016/j.cej.2009.12.024
Miller, G. L. (1959). “Use of dinitrosalicylic acid reagent for determination of reducing sugars,” Anal. Chem. 31(3), 426-428. DOI: 10.1021/ac60147a030
Mitchell, D. A., and Lonsane, B. K. (1993). “Definition, characteristics and potential,” in: Solid Substrate Cultivation, H. W. Doelle, C. Rolz (eds.), Elsevier Applied Science, London, UK.
Movagharnejad, K., and Sohrabi, M. A. (2003). “A model for the rate of enzymatic hydrolysis of some cellulosic waste materials in heterogeneous solid–liquid systems,” Biochem. Eng. J. 14(1), 1-8. DOI: 10.1016/S1369-703X(02)00104-3
Qing, Q., Zhou, L., Huang, M., Guo, Q., He, Y. C., Wang, L. Q., and Zhang, Y. (2016). “Improving enzymatic saccharification of bamboo shoot shell by alkalic salt pretreatment with H2O2,” Bioresource Technol. 201(2), 230-236. DOI: 10.1016/j.biortech.2015.11.059
Ramadoss, G., and Muthukumar, K. (2015). “Influence of dual salt on the pretreatment of sugarcane bagasse with hydrogen peroxide for bioethanol production,” Chem. Eng. J. 260(15), 178-187. DOI: 10.1016/j.cej.2014.08.006
Rosgaard, L., Andric, P., Dam-Johansen, K., Pedersen, S., and Meyer, A. S. (2007). “Effects of substrate loading on enzymatic hydrolysis and viscosity of pretreated barley straw,” Appl. Biochem. Biotech. 143(1), 27-40. DOI: 10.1007/s12010-007-0028-1
Sasaki, M., Kabyemela, B., Malaluan, R., Hirose, S., Takeda, N., Adschiri, T., and Arai, K. (1998). “Cellulose hydrolysis in subcritical and supercritical water,” J. Supercrit. Fluid 13(1), 261-268. DOI: 10.1016/S0896-8446(98)00060-6
Salum, T. F. C., Villeneuve, P., Barea, B., Yamamoto, C. I., Cóco, L. C., Mitchell, D. A., and Krieger, N. (2010). “Synthesis of biodiesel in column fixed-bed bioreactor using the fermented solid produced by Burkholderia cepacia LTEB11,” Process Biochem. 45(8), 1348-1354. DOI: 10.1016/j.procbio.2010.05.004
Shi, J., Chinn, M. S., and Sharma-Shivappa, R. R. (2008). “Microbial pretreatment of cotton stalks by solid state cultivation of Phanerochaete chrysosporium,” Bioresource Technol. 99(4), 6556-6564. DOI: 10.1016/j.biortech.2007.11.069
Sluiter, B., Hames, R., Ruiz, C., Scarlata, J., Sluiter, J., Templeton, D., and Crocker, D. (2008). “Laboratory analytical procedure (LAP): Determination of Structural Carbohydrates and Lignin in Biomass (Report NREL/TP-510-42618), National Renewable Energy Laboratory, Golden, Co, USA.
Tanyildizi, M. S., Özer, D., and Elibol, M. (2005). “Optimization of a-amylase production by Bacillus sp. using response surface methodology,” Process Biochem. 40(7), 2291-2296. DOI: 10.1016/j.procbio.2004.06.018
Vallander, L., and Eriksson, K. E. (1987). “Enzyme recirculation in saccharification of lignocellulosic materials,” Enzyme Microb. Tech. 9(12), 714-720.
Wang, W., Zhu, Y., Du, J., Yang, Y., and Jin, Y. (2015). “Influence of lignin addition on the enzymatic digestibility of pretreated lignocellulosic biomasses,” Bioresource Technol. 181(1), 7-12. DOI: 10.1016/j.biortech.2015.01.026
Xu, F., and Ding, H. A. (2007). “A new kinetic model for heterogeneous (or spatially confined) enzymatic catalysis: contributions from the fractal and jamming (overcrowding) effects,” Appl. Catal. A- Gen. 317(1), 70-81. DOI: 10.1016/j.apcata.2006.10.014
Yang, C. Y., and Fang, T. J. (2015a). “Kinetics for enzymatic hydrolysis of rice hulls by the ultrasonic pretreatment with a bio-based basic ionic liquid,” Biochem. Eng. J. 100(1), 23-29. DOI: 10.1016/j.bej.2015.04.012
Yang, C. Y., and Fang, T. J. (2015b). “Kinetics of enzymatic hydrolysis of rice straw by the pretreatment with a bio-based basic ionic liquid under ultrasound,” Process Biochem. 50(4), 623-629. DOI: 10.1016/j.procbio.2015.01.013
Ye, Z., and Berson, R. E. (2011). “Kinetic modeling of cellulose hydrolysis with first order inactivation of adsorbed cellulose,” Bioresource Technol. 102(24), 11194–11199. DOI: 10.1016/j.biortech.2011.09.044
Zhang, Z, C., Jia, J., Li, M., and Pang, Q. X. (2014). “H2O2 can increase lignin disintegration and decrease cellulose decomposition in the process of solid-state fermentation (SSF) by Aspergillus oryzae using corn stalk as raw materials,” BioResources 9(2), 3077-3087. DOI: 10.15376/biores.9.2.3077-3087
Zhang, Z., Xia, L., Wang, F., Lv, P., Zhu, M. X. Q., Li, J. H., and Chen, K. P. (2015). “Lignin peroxidase in corn stalk by combined method of H2O2 hydrolysis and Aspergillus oryzae CGMCC5992 liquid-state fermentation,” Biotechnol. Biofuels 8(2), 183-193. DOI: 10.1186/s13068-015-0362-4
Zhang, Z. C., Liu, D., Feng, F., Li, J. S., Li, M., and Pang, Q. X., and Chen, K. P. (2013). “Optimization of the nutrition for biodegradation of vinasse by Aspergillus oryzae using response surface methodology,” Water Sci. Technol. 67(4), 772-779. DOI: 10.2166/wst.2012.631
Article submitted: March 2, 2017; Peer review completed: June 5, 2017; Revisions accepted: June 8, 2017; Published: June 13, 2017.
DOI: 10.15376/biores.12.3.5462-5486