
Abstract
Soluble products from oil palm frond hydrolysate (OPFH) were incorporated as the fermentation substrate for succinic acid (SA) production. To construct a reliable kinetic model for the production of SA from OPFH, the inhibitory effects during fermentation involving glucose were evaluated based on the modified Gompertz model. The application of the modified Gompertz model was found to fit well with the experimental data for characterizing the SA fermentation profile and could predict the maximum potential of the metabolite formation in the form of concentrations, production rates, and initial lag times. The maximum potential of the SA production was determined to be 38.0 g/L, which was yielded from 61.3 g/L glucose in anaerobic batch cultivation after 30 h. The inhibitory effects on the cell growth and SA production became more apparent at higher substrate concentrations, which coincided with the substrate inhibition constant of 78.7 g/L. The model also helped in estimating the OPFH fermentation baseline, which consequently led to a SA concentration of 36.5 g/L and productivity of 1.95 g/Lh. The results suggested that OPFH as an inexpensive and renewable source of lignocellulosic syrup is advantageous for the economic production of SA.
Download PDF
Full Article
Kinetics of the Bioproduction of Succinic Acid by Actinobacillus succinogenes from Oil Palm Lignocellulosic Hydrolysate in a Bioreactor
Abdullah Amru Indera Luthfi,a Jamaliah Md Jahim,a,b,* Shuhaida Harun,a,b Jian Ping Tan,a Shareena Fairuz Abdul Manaf,a,c and Siti Syazwani Mohd Shah a
Soluble products from oil palm frond hydrolysate (OPFH) were incorporated as the fermentation substrate for succinic acid (SA) production. To construct a reliable kinetic model for the production of SA from OPFH, the inhibitory effects during fermentation involving glucose were evaluated based on the modified Gompertz model. The application of the modified Gompertz model was found to fit well with the experimental data for characterizing the SA fermentation profile and could predict the maximum potential of the metabolite formation in the form of concentrations, production rates, and initial lag times. The maximum potential of the SA production was determined to be 38.0 g/L, which was yielded from 61.3 g/L glucose in anaerobic batch cultivation after 30 h. The inhibitory effects on the cell growth and SA production became more apparent at higher substrate concentrations, which coincided with the substrate inhibition constant of 78.7 g/L. The model also helped in estimating the OPFH fermentation baseline, which consequently led to a SA concentration of 36.5 g/L and productivity of 1.95 g/Lh. The results suggested that OPFH as an inexpensive and renewable source of lignocellulosic syrup is advantageous for the economic production of SA.
Keywords: Actinobacillus succinogenes; Kinetics; Modified Gompertz model; Oil palm frond; Substrate inhibition; Succinic acid
Contact information: a: Research Centre for Sustainable Process Technology (CESPRO), Faculty of Engineering and Built Environment, Universiti Kebangsaan Malaysia, 43600 UKM Bangi, Selangor, Malaysia; b: Chemical Engineering Program, Faculty of Engineering and Built Environment, Universiti Kebangsaan Malaysia, 43600 UKM Bangi, Selangor, Malaysia; c: Faculty of Chemical Engineering, Universiti Teknologi MARA, 40450 Shah Alam, Selangor Darul Ehsan, Malaysia;
* Corresponding author: jamal@ukm.edu.my
INTRODUCTION
Succinic acid (SA) is a symmetrical, four-carbon dicarboxylic acid molecule that is extensively applied as a precursor in the production of numerous industrial products, including 1,4-butanediol, tetrahydrofuran, adipic acid, N-methyl pyrrolidinone, 2-pyrrolidinone, gamma-butyrolactone, succinamide, putrescine, succinonitrile, and succinate salts (Nghiem et al. 2017). Additionally, SA, 1,3-propanediol, and lactic acid can be used as monomers for the synthesis of polyesters (Yang et al. 2007). Microbial production of SA is recognized as a green technology that addresses the triple challenges of anthropogenic climate change, energy security, and human safety related to the overconsumption of fossil fuel reserves (Beach et al.2013). Given the versatility in yielding more than 30 commercially important derivatives, SA has been listed by the U.S. Department of Energy as a high-value biobased platform chemical, and represents a total addressable market of more than $7.2 billion (Saxena et al. 2017). Currently, biobased production of SA contributes to approximately 49% of the total SA market (Ahn et al. 2016).
Lignocellulosic material, which is composed of lignin, cellulose, and hemicellulose, is an attractive renewable resource for future SA production (Salvachúa et al. 2016). However, lignin is a complex non-carbohydrate phenolic polymer that needs to be eliminated by pretreatment with alkalis or acids (Santos et al. 2013) in order to avoid potential interference during the subsequent bacterial fermentation process. From the perspective of palm-oil biorefinery, especially in the maritime regions of Southeast Asia, the advent of modern biorefineries has helped to utilize readily available organic wastes derived from the palm-oil industry (Hossain et al. 2017). In Malaysia, the annual production of organic wastes has reached 0.2 billion tonnes, among which oil palm frond (OPF), oil palm trunk, oil palm mesocarp fibre, and palm kernel shell account for approximately 51 million tonnes, 19 million tonnes, 8 million tonnes, and 5 million tonnes each year, respectively (Aziz 2015). It has been well documented that one of the bottlenecks that hinder the scaling-up of biobased SA production is the cost of traditional feedstock (Nghiem et al. 2017). Nevertheless, because of the richness of structural carbohydrates with a relatively large availability, the utilization of OPF can provide economic value for a more cost-competitive bio-SA platform (Luthfi et al. 2016).
The fermentative production of SA has been intensively investigated using bacteria capable of producing copious amounts of SA, such as Actinobacillus succinogenes (Luthfi et al.2017b). This gram-negative anaerobic microorganism belongs to the Pasteurellaceae family and naturally produces SA via the reductive arm of the tricarboxylic acid (TCA) cycle (Li and Xing 2015). Actinobacillus succinogenes, which originates in bovine rumen, utilizes pentose and hexose simultaneously. Furthermore, the versatility of this attractive strain in using different carbon sources has been of interest for the industrial bioproduction of SA from various feedstock sources (Zheng et al. 2010).
Because of market competition and the high price of biobased SA, a cost-effective solution is needed to replace expensive refined sugars with lower-priced substitute inputs, such as OPF residue, for the fermentative feedstock. Bradfield and Nicol (2016) conducted fermentative production of SA using glucose and xylose, and demonstrated that the generation of SA from glucose was slightly higher than that of xylose. However, similar trends in both the metabolite formation and consumption rates were observed. Therefore, it is necessary to establish a performance baseline for glucose fermentation prior to OPF fermentation.
Kinetic modeling involves the use of mathematical expressions capable of characterizing microbial growth, substrate utilization, and SA formation (Rorke and Kana 2017). Inhibitory effects from the substrates or products are known to affect the performance of SA production (Corona-González et al. 2008). The Haldane kinetic model can be used to describe biomass growth for the limiting substrate, while the modified Gompertz model can be adopted to determine the production lag time, maximum production rate, and maximum product concentration for a given substrate (Siripatana et al. 2016). Although the modified Gompertz equation has been used for the production of ethanol (Rorke and Kana 2017) and hydrogen (Abdul et al.2013), no kinetic studies have hitherto been performed on SA fermentation to the authors’ knowledge.
In this paper, the Haldane and modified Gompertz models were applied to understand the SA production in a batch fermentation system. The study was conducted in a bioreactor because it allowed ample data to be collated from the reaction analysis of A. succinogenes (Brink and Nicol 2014). Thus, the importance of the present work lies in the fact that it is the first to explore the kinetics of SA production from the fermentation of oil palm frond hydrolysate (OPFH) relative to that of glucose in terms of the concentration, volumetric productivity, and conversion yield, based on the modified Gompertz model. Hence, this study aimed to optimize the SA production by varying the initial glucose loading. The identical process conditions, other than the substrate used, enabled a comparative investigation.
EXPERIMENTAL
Materials
Feedstock preparation
The OPF samples used in this study were fresh from an oil palm plantation owned by Universiti Kebangsaan (Bangi, Malaysia). The OPF bagasse was obtained by pressing to extract the juice using a sugarcane press machine (Model: YJ96-3, Zhejiang Yuejian Machinery Manufacture Co. Ltd., Zhejiang Sheng, China), which was followed by sun-drying for 2 d. The dried samples were ground mechanically into smaller pieces (~2 mm) prior to storage in a container filled with desiccants until further use. The composition of the raw OPF bagasse sample was analyzed in the previous study done by the authors and the results are shown in Table 1 (Manaf et al. 2018). Other components in the raw OPF bagasse included wax, fatty acids, terpenoids, phenolic substances, chlorophyll, soil, non-structural sugars, inorganic materials, proteins, and water-soluble oligomers (Sluiter et al. 2008).
Table 1. Chemical Composition of the Raw OPF Bagasse

Manaf et al. (2018)
Subsequently, a combination of alkaline pretreatment (4 wt.% NaOH; 1:10 solid to liquid ratio; 100 °C; 58 min) with autohydrolysis at a 1:10 water to sample ratio, 15 psi, and 121 °C for 20 min was employed to deconstruct the lignocellulosic components of the OPF bagasse.
The pretreated bagasse was hydrolyzed (pH = 4.8; 50 °C; 72 h) using enzymes purchased from Novozymes A/S (Bagsvaerd, Denmark). To optimize the sugar production from the OPFH, Cellic® CTec2 (Novozymes A/S, Bagsvaerd, Denmark) with an enzymatic activity of 142 filter paper unit (FPU)/mL and Cellic® HTec2 (Novozymes A/S) with an enzymatic activity of 1090 fungal xylanase unit (FXU)/mL were loaded at 0 FPU/g to 50 FPU/g and 0 FXU/g to 75 FXU/g of dry OPF, respectively. Subsequently, the hydrolyzed bagasse was filtered through a gauze cloth to remove the solid phase before being used in fermentation.
Microorganism
Native A. succinogenes 130Z was acquired from the German Collection of Microorganisms and Cell Cultures, DSMZ (Braunschweig, Germany). The prepared stock cultures were maintained in 20% glycerol at –40 °C. The bacterium was revived and inoculated in a brain heart infusion medium containing brain heart infusion broth (1.75% w/w) and peptone (1.00% w/w) at 37 °C and 120 rpm over 8 h.
Media composition
All of the chemicals used for the media preparation were of analytical grade, and were bought from Oxoid (Unipath Ltd. Basingstoke, Hampshire, England), unless stated otherwise. The fermentation media were composed of (per liter of water): 0.2 g of CaCl2, 0.2 g of MgCl2·6H2O, 1.0 g of NaCl, 1.0 g of antifoam B emulsion (Sigma-Aldrich, St. Louis, MI, USA), 3.0 g of KH2PO4, 15.0 g of yeast extract, and 20.0 g of Na2CO3. The D-glucose loading added for the inhibition study using the modified Gompertz model was varied over a range from 20 g/L to 120 g/L. The D-glucose and OPFH were separately heat-sterilized before being mixed with the other medium components under sterile conditions.
Methods
Fermentation experiments
Batch fermentations were conducted using two different substrates. Initially, the optimization and kinetics study of the batch fermentation for cell cultivation and SA production were conducted using pure glucose. Subsequently, the carbon source was substituted with OPFH and fermentation was performed under the optimum conditions established using the glucose-based medium. The benchtop bioreactor consisted of an aluminum sheath (top section) and borosilicate glass with a total volume of 3.6 L. The bioreactor was equipped with a jacketed glass vessel, three baffles, two Rushton impellers (Infors HT, Bottmingen, Switzerland), one-way valve sampling system, and peristaltic pump. A 0.2-µm PTFE membrane filter was fitted to each of the gas inlets and outlets to prevent airborne contamination (Midisart 2000 filters, Sartorius, Göttingen, Germany).
Batch cultivations were performed with a working volume of 1 L. The temperature was 37 °C and the pH was adjusted to 6.8 ± 0.05 using 4 M non-sterile KOH. Carbon dioxide gas (NIG Gases, Selangor, Malaysia) was sparged through the fermentation medium at 0.50 vvm and the agitation was controlled at 200 rpm. Samples measuring approximately 5 mL were taken at regular intervals from the fermentation medium to measure the cell growth, substrate consumption, and metabolite production.
Analytical methods
Liquid samples consisting of glucose, xylose, and organic acids were filtered through 0.22-µm Whatman membrane syringe filters (Maidstone, United Kingdom) in vials prior to the component analysis using high performance liquid chromatography (HPLC). The sugar and metabolite contents were analyzed with an UltiMate 3000 HPLC system (Dionex, Sunnyvale, CA, USA), equipped with a Phenomenex RoA column (300 mm × 7.8 mm; Sunnyvale, CA, USA) set at 60 °C and a refractive index detector (RID) set at 40 °C. Sulfuric acid (5 mN) was used as the mobile phase, which was eluted in an isocratic manner at a flow rate of 0.6 mL/min. The time between the sample injection and its elution from the column was set to a maximum of 30 min. All of the calibration curves and sample concentrations were determined with the aid of Chromeleon software (v7.2.2.6686, Dionex, Sunnyvale, CA, USA).
The cell biomass representing the bacterial growth was quantified by centrifuging 5 mL of the suspended culture at 10000 rpm for 15 min to separate the supernatant from the cells. Subsequently, the cell pellet was washed, resuspended with deionized water, and dried at 80 °C overnight to a constant weight. The dry cell weight was measured gravimetrically and denoted as x (g/L).
Model description and calculation
The following assumptions were made when developing the models for characterizing the batch fermentation of OPFH: (i) the effects of the nitrogen source on the fermentation performance were not considered, and (ii) the CO2-rich anaerobic condition was maintained throughout the whole fermentation process. Exploratory trials on different substrate loadings were performed with the Haldane model and modified Gompertz model. The Haldane model was used to describe the kinetics of the cell growth, and the parameters were obtained by comparing the model predictions with the experimental data. Hence, the specific growth rate based on the Haldane equation, i.e., an extended Monod expression, was used to determine the effect of the glucose concentration on the cell growth and was calculated using Eq. 1,
 (1)
(1)
where µ is the specific growth rate (h-1), µm is the maximum specific growth rate (h-1), S is the substrate concentration (g/L), KS is the substrate saturation constant (g/L), and KI is the substrate inhibition constant (g/L).
Subsequently, the modified Gompertz model was applied to explore the fermentation data and predict the kinetic constants governing the metabolite production relative to the initial substrate loading. The model was as follows,
 (2)
(2)
where P is the cumulative metabolite concentration (g/L), Pm is the maximum metabolite concentration (g/L), Rm is the maximum metabolite production rate (g/Lh), e is Euler’s number (dimensionless), λ is the lag phase time (h), and t is the fermentation time (h). Equation 2 was also applied to estimate the cell growth.
Sigma Plot Software 14.0 (Systat Software Inc., Chicago, IL, USA) was used for the regression and graphical analysis of the data.
RESULTS AND DISCUSSION
Enzymatic Hydrolysis of the Lignocellulosic Oil Palm Frond
Fermentable sugars in the OPF are derived from homopolymeric cellulose (i.e., the monomer is glucose) and heteropolymeric hemicellulose (i.e., the monomer is xylose) (Luthfi et al.2017b). In this work, an alkaline pretreatment was used to eliminate the silica and lignin in the OPF bagasse, while autohydrolysis was used to further loosen the intact structures of the cellulose-hemicellulose matrix to improve the accessibility of enzymes to the targeted substrates (Zakaria et al. 2015). The composition of the alkaline-autohydrolysis pretreated material (per 100 grams of dry OPF) was as follows: 62.7 g of glucan, 15.6 g of xylan, 0.4 g of lignin, and 4.1 g of total extractives. Regardless of the medium complexity, A. succinogenes can simultaneously ferment the component sugars (hexoses and pentoses) of the lignocellulosic syrup to produce SA (Li et al. 2011).
The pretreated OPF bagasse was hydrolyzed, and the effects of the CTec2 and HTec2 loadings on the sugar production are shown in Fig. 1. To evaluate the best CTec2 loading, the HTec2 was kept at the maximum dose of 75 FXU/g of dry OPF to remove the enzyme limitation. Following that, the total reducing sugar yield increased from 4.0 g/g to 38.6 g/g of raw OPF as the CTec2 loading increased from 0 FPU/g to 10 FPU/g of dry OPF. Figure 1 shows that glucose and xylose reached their maximum productions when the CTec2 loading was 30 FPU/g of dry OPF. In contrast, the total reducing sugar yield was only enhanced by 5.1% when the loading was 50 FPU/g of dry OPF, which indicated that a higher enzyme loading was not economically justifiable.


Fig. 1. Effect of the (a) CTec2 loading (0 FPU/g to 50 FPU/g) and (b) HTec2 loading (0 FXU/g to 75 FXU/g) on the total reducing sugars, glucose, and xylose yields of the pretreated OPF bagasse; the error bars represent standard deviations of the three independent experiments
Supplementation with HTec2 is crucial as it can improve the accessibility of enzymes to cellulose by removing the hemicellulose barrier (Xu et al. 2011). Thus, the influence of the HTec2 loading on the OPF bagasse was assessed based on the CTec2 loading of 30 FPU/g of dry OPF (Fig. 1b). Likewise, increasing the HTec2 loading resulted in a higher overall sugar production. The best HTec2 loading was 45 FXU/g of raw OPF because the total reducing sugar yield was 63.7%, which was superior to that obtained without HTec2. The optimum sugar yield was 54.2% g/g of raw OPF, which comprised 72.7 g/L of the total sugars, with glucose being the predominant carbon source in the hydrolysate.
Fermentation Kinetics using Pure Sugar
Substrate inhibition of microbial growth
The extent of carbon loading has been noted to be the major driving factor that affects the microbial growth and fermentation activity (Rorke and Kana 2017). The inhibition of the fermentation process is considered to have occurred when the cell growth is arrested because of the accumulation of substrates, products, or both at a certain threshold (Li et al. 2010a). To elucidate the substrate inhibition on the microbial growth, the growth pattern of A. succinogenes in batch fermentation was observed using media supplemented with different initial glucose concentrations ranging from 1.5 g/L to 120 g/L. Hypothetically, a minimum inhibitory effect on the cell growth should be investigated prior to an accurate measurement of the parameters, such as µm and KS (Song et al. 2008), i.e., when the ratio of S2 to KI can be neglected. Therefore, the classical Monod expression where µ is µmS/(S + KS) was applied for the estimation of the µm and KS values.
Subsequently, the collected data was used to estimate the Haldane inhibition constant, KI, which is the extent of the substrate concentration that can produce half the maximum inhibition (Bojanić et al. 2015). Table 2 outlines the obtained values of the model parameters for A. succinogenes for different initial glucose loadings. Using these values, the model predictions based on the Haldane equation (Eq. 1) were compared with the experimental data, which is shown in Fig. 2. The satisfactory agreement between the experimental and predicted values is demonstrated by a R2 value of 0.993. The KI and µm of A. succinogenes were found to be 78.7 g/L and 0.4 h-1, respectively.
Table 2. Values of the Model Kinetic Parameters

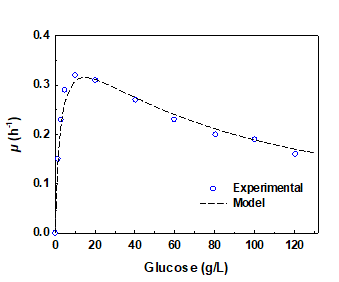
Fig. 2. Effect of the initial glucose concentration on the specific growth rate of A. succinogenes
Succinic acid production using the Gompertz model
Succinic acid is formed as a product through a series of enzyme-catalyzed reactions in the anaerobic reductive pathway of the TCA cycle (Li and Xing 2015). Figure 3 depicts the time course of the SA production from glucose at various initial concentrations based on the modified Gompertz model. Among the products observed in this study, formic acid (FA) and acetic acid (AA) were the only byproducts formed throughout fermentation, and neither ethanol nor lactic acid were detected. Similar observations have been documented in studies involving similar microorganisms (Corona-González et al. 2008; Luthfi et al. 2017a). However, the formation of lactic acid was detected by Kim et al. (2009), possibly because of the presence of molecular oxygen during fermentation that led to metabolic shifts in A. succinogenes (Wang et al. 2014).

Fig. 3. Time course of the (a) biomass formation, (b) glucose consumption, (c) SA production, (d) FA production, and (e) AA production in the batch culture with various initial glucose concentrations using the Gompertz model
In all of the cases, it was concluded that the model simulation matched favorably with the experimental results and enabled the characterization of the A. succinogenes fermentation during the SA production from glucose. Figure 3 illustrates that the formation of biomass declined with higher initial glucose concentrations. The lack of other nutrients in the fermentation medium, other than the primary carbon source, e.g., nitrogen source, has been demonstrated to exert a negligible effect on biomass formation (Corona-González et al. 2008). Therefore, it is probable that the variation in the biomass formation was directly influenced by the change in the carbon source (Lin et al. 2008). This was further evidenced by the findings of this study, which follow. Substrate inhibition did not manifest when the initial glucose concentration ranged from 20.3 g/L to 61.3 g/L, as was demonstrated by the unremarkable concomitant biomass reductions (< 2%). Conversely, the substrate inhibition became more apparent when the concentration exceeded the threshold of 61.3 g/L, above which biomass reductions exceeding 5% were observed. This result was consistent with the previous Haldane inhibition constant of 78.7 g/L glucose that had a noticeable inhibition on the cell growth and SA production. Apart from the effects of the substrate, metabolite formation may likewise inhibit the growth of A. succinogenes and subsequent SA production (Bradfield and Nicol 2016). Table 3 summarizes the performances of the SA production based on the fitted modified Gompertz model.
Table 3. Performance Parameters in the SA Production Based on the Modified Gompertz Model

Throughout this study, the production of acid mixtures (SA, FA, and AA) appeared to jeopardize the cell growth. This might have been because of an increase in the total carbon chain length, which enhanced the diffusivity of acid molecules across the cell membrane, thus acidifying the cytoplasm and inhibiting growth (Corona-González et al. 2008). The average maximum cell growth occurred at a concentration of approximately 30 g/L mixed acids. Conversely, the SA production reached a plateau at approximately 52 g/L mixed acids, and thereafter, no further increase in the SA concentration was observed. In contrast with the acid mixture, the production of individual acids appeared to exert various effects on the SA production. Li et al. (2010a) found that the initial co-production of the byproduct FA exerted a greater inhibitory effect on the SA production than the AA production. However, the maximum tolerated concentration of FA (35 g/L) was contradictorily and noticeably higher than that of AA (20 g/L) for A. succinogenes 130Z (Li et al. 2010a). Nonetheless, the presence of FA has been reported to contribute to an increase in the SA production (Litsanov et al. 2012; Ahn et al. 2017) because NADH can be generated from the oxidation of formate to CO2and 2H+ by formate dehydrogenase to achieve a redox balance (Leszczewicz and Walczak 2014; Luthfi et al. 2016).
Table 3 shows that the SA production increased gradually from 12.4 g/L to 38.0 g/L with productivities ranging from 1.1 g/Lh to 2.0 g/Lh when the initial glucose concentration ranged from 20.3 g/L to 61.3 g/L. These glucose concentrations not only led to augmented SA conversion yields, but also to consistent SA to byproduct ratios. Complete consumption of the glucose was achieved under these conditions within a fermentation time of 30 h. However, when the initial glucose concentration was above 61.3 g/L, the Pm, SA and Rm, SA diminished from 38.0 g/L to 29.7 g/L and from 2.0 g/Lh to 1.0 g/Lh, respectively. The consumption of glucose was incomplete in this case, despite prolongation of the fermentation time to 82 h (data not shown). It was found that the utilization of glucose by A. succinogenes remained nearly constant after a concentration of approximately 61 g/L was reached (Table 2). Moreover, the conversion yields and SA to byproduct ratios declined with an increase in the glucose concentration above 61.3 g/L.
A short fermentation time implies a minimum metabolite production lag phase and enhanced production rate (Rorke and Kana 2017). The lag phases of the SA production ranged between 3 h and 10 h for all of the batch fermentation runs, among which the shortest lag time was 3.3 h with a glucose concentration of 20.3 g/L. In all of the cases, the lag time of the metabolite production was longer with a higher glucose loading because of the inhibitory effects of glucose on fermentation. However, the production rates started to decline when the lag time was beyond the designated limits; i.e., λ greater than 6 h, 3 h, and 2 h for the SA, AA, and FA productions, respectively.
The highest SA production reported in this study was 38.0 g/L, which was with a 61.3-g/L initial glucose concentration and a yield of 0.62 g/g. After that, the SA production declined with an associated increase in the generation of byproducts. Zheng et al. (2009) found that the cell growth and SA production were inhibited when the initial sugar concentration, which originated from the corn straw hydrolysate, increased from 60 g/L to 80 g/L. Considering the highest possible SA production based on the modified Gompertz model, it seems likely that the optimum initial glucose concentration was close to 60 g/L. Thus, this model can be employed for the development of biobased SA production derived from the lignocellulosic medium.
Utilization of the Oil Palm Frond Hydrolysate
The total sugar in the OPFH consisting of glucose and xylose was diluted to approximately 60 g/L prior to fermentation to produce SA. The trend for the fermentative production of SA derived from the OPFH is depicted in Fig. 4. The R2 value of approximately 0.99 was attributed to the favorable agreement between the experimental data and fitted regression curve, which suggested that this model can characterize the kinetic behavior of SA production during the fermentation of OPFH. Accordingly, the production of SA derived from the OPFH under batch anaerobic fermentation can be expressed as Eq. 3,
 (3)
(3)
where PSA-OPFH is the cumulative SA concentration (g/L), e is Euler’s number (dimensionless), and t is the fermentation time (h).

Fig. 4. Predictive models of the (a) monosaccharide consumption and biomass formation, (b) SA production, (c) FA production, and (d) AA production from the OPFH
Figure 4 shows the rapid depletion of sugars from 0 h to 22 h with an increase in the biomass formation. In contrast, the biomass formation increased exponentially with time, reached its maximum after 15 h, and remained almost constant until 30 h; this trend was comparable to the fermentation of glucose at 61.3 g/L (Fig. 3a). The maximum formation of biomass from the fermentation of OPFH was 5.6 g/L with the corresponding percentage difference of 3.1% relative to that of glucose.
The lignocellulosic sugars in the OPFH were almost completely consumed by A. succinogenes, which corresponded to a utilization rate of 91%. Surprisingly, the ratio of glucose to xylose in the broth at the end of fermentation was approximately 1:0.25, which increased from the original ratio of 1:0.3. This finding corroborated that the trend of substrate utilization was consistent throughout the fermentation process and that A. succinogenes could consume xylose nearly as efficiently as glucose, as was reported by other studies in the literature (Li et al.2010b; Bradfield and Nicol 2016). Similar trends were observed in the consumption of glucose and xylose, which indicated the absence of carbon catabolite repression by these monosaccharides in A. succinogenes. This observation was consistent with the finding from a previous study by Bradfield and Nicol (2016). An exponential stage in the SA production occurred after 6 h, which led to a SA production of 36.5 g/L, yield of 0.57 g/g, and volumetric productivity of 1.95 g/Lh at the end of fermentation (t = 30 h). As a terminal product of anaerobic fermentation (Li and Xing 2015), SA was produced at high concentrations, alongside only minute amounts of other metabolites with a total production of less than 15 g/L (equivalent to 0.31 g of total byproducts/g of sugars). Moreover, the SA to byproducts ratio obtained through the OPFH fermentation (1:0.5) was comparable to that obtained from glucose (1:0.4), with a 1.25-fold difference. The high concentration of SA over other products was expected because SA is a predominant metabolite in A. succinogenes fermentation and is therefore produced abundantly, making it economically favorable for subsequent recovery.
The maximum SA concentration of 36.5 g/L obtained with OPFH was 4.2% lower than that obtained with glucose (38.0 g/L) under similar conditions. Table 4 outlines the comparison of the SA production performances for the different substrates, with initial concentrations (So) equal to the initial OPFH amounts. The results obtained in this work demonstrated that the pretreated OPFH sample brought about minimum inhibitory effects, as was likewise reflected by the higher SA concentration, yield in relation to the substrate, and volumetric productivity over other lignocellulosic materials used in previous studies.
Table 4. Comparison of the Performances in the Batch SA Production for the Different Substrates

In the batch fermentation of sugarcane bagasse hemicellulosic hydrolysate by A. succinogenes, 18.5 g/L SA was produced after 24 h of fermentation with an initial sugar concentration of 52 g/L (Borges and Pereira Jr. 2011). This was achieved through the addition of NaHCO3 (10 g/L), which catalyzed the hydration of CO2 to HCO3–. Furthermore, economic SA production from empty fruit bunch was demonstrated by Akhtar and Idris (2017), who yielded a maximum SA production of 33.4 g/L with a productivity of 0.69 g/Lh in shake flasks.
Thus, an understanding of the kinetics underlying SA fermentation is fundamental for the development of many other strategies. The concentration, conversion yield, and volumetric productivity of biobased SA can be further enhanced by adopting different strategies, such as adhesion and entrapment of cells to increase the cell density. For instance, repeat batch fermentations with A. succinogenes entrapped in agar beads have produced up to 43.4 g/L SA with a productivity of 2.83 g/Lh (Corona-González et al. 2014). Similarly, an average SA concentration of 44.1 g/L and yield of 0.9 g/g were reported with attached biofilms on coconut shell activated carbon (Luthfi et al. 2017a). Strategies involving high cell density operations would allow a sufficiently high dilution rate to surpass the µm of 0.43 obtained in this study, thereby allowing high-throughput operations without the occurrence of cell washout (Zhu 2007). When considering the prospects of future biobased SA concentration and yields, it is suggested that the kinetic models proposed in this study will be useful for the biobased SA technologies using lignocellulosic waste, which could confer substantial economic advantages to replace the existing petrochemical pathway.
CONCLUSIONS
- The synergistic effect between the CTec2 and HTec2 loadings on the OPF generally led to a higher sugar liberation because of improved accessibility of the enzymes to cellulose (or glucan), which could produce the optimum sugar yield of 54.2% g/g of raw OPF.
- The maximum SA concentration of 38.0 g/L was attained from the complete utilization of glucose at an initial loading of 61.3 g/L, with a conversion yield of 0.62 g/g.
- The fermentation performance of A. succinogenes using OPFH was demonstrated to be on par with that when using glucose. This comparable performance suggested that the potentially inhibitory effects on SA production from the soluble products of the OPFH prepared in this study were minimal.
- The maximum SA concentration of approximately 36.5 g/L obtained with OPFH was 4.2% lower than that obtained with glucose under similar conditions.
- This research is a pioneering work that demonstrates the applicability of the modified Gompertz model in the fermentative production of SA from lignocellulosic syrup prepared from OPF.
ACKNOWLEDGMENTS
The authors acknowledge the financial support from the Ministry of Higher Education, Malaysia through the grant provided under the Long Term Research Grant Scheme (LRGS/2013/UKM-UKM/PT/01) for the project entitled “Biochemical Platform for Conversion of Diversified Lignocellulosic Biomass to Priceless Precursor and Biobased Fine Chemicals”.
REFERENCES CITED
Abdul, P. M., Jahim, J. M., Harun, S., Markom, M., Hassan, O., Mohammad, A. W., and Asis, A. J. (2013). “Biohydrogen production from pentose-rich oil palm empty fruit bunch molasses: A first trial,” Int. J. Hydrogen Energ. 38(35), 15693-15699. DOI: 10.1016/j.ijhydene.2013.05.050
Ahn, J. H., Bang, J., Kim, W. J., and Lee, S. Y. (2017). “Formic acid as a secondary substrate for succinic acid production by metabolically engineered Mannheimia succiniciproducens,” Biotechnol. Bioeng. 114(12), 2837-2847. DOI: 10.1002/bit.26435
Ahn, J. H., Jang, Y.-S., and Lee, S. Y. (2016). “Production of succinic acid by metabolically engineered microorganisms,” Curr. Opin. Biotech. 42, 54-66. DOI: 10.1016/j.copbio.2016.02.034
Akhtar, J., and Idris, A. (2017). “Oil palm empty fruit bunches a promising substrate for succinic acid production via simultaneous saccharification and fermentation,” Renew. Energ. 114(Part B), 917-923. DOI: 10.1016.j.renene.2017.07.113
Aziz, A. A. (2015). “Green technology on oil palm biomass,” Asia Palm Oil Magazine 4, 56-59.
Beach, E. S., Weeks, B. R., Stern, R., and Anastas, P. T. (2013). “Plastics additives and green chemistry,” Pure Appl. Chem. 85(8), 1611-1624. DOI: 10.1351/PAC-CON-12-08-08
Bojanić, K., Nicholson, W. T., Wittwer, E. D., Weingarten, T. N., and Sprung, J. (2015). “Codeine can’t do it,” in: A Case Approach to Perioperative Drug-drug Interactions, Springer, New York, NY, pp. 269-273.
Borges, E. R., and Pereira Jr., N. (2011). “Succinic acid production from sugarcane bagasse hemicellulose hydrolysate by Actinobacillus succinogenes,” J. Ind. Microbiol. Biot. 38(8), 1001-1011. DOI: 10.1007/s10295-010-0874-7
Bradfield, M. F., and Nicol, W. (2016). “Continuous succinic acid production from xylose by Actinobacillus succinogenes,” Bioproc. Biosyst. Eng. 39(2), 233-244. DOI: 10.1007/s00449-015-1507-3
Brink, H. G., and Nicol, W. (2014). “Succinic acid production with Actinobacillus succinogenes: Rate and yield analysis of chemostat and biofilm cultures,” Microb. Cell Fact. 13, 111-122. DOI: 10.1186/s12934-014-0111-6
Corona-González, R. I., Bories, A., González-Álvarez, V., and Pelayo-Ortiz, C. (2008). “Kinetic study of succinic acid production by Actinobacillus succinogenes ZT-130,” Process Biochem. 43(10), 1047-1053. DOI: 10.1016/j.procbio.2008.05.011
Corona-González, R. I., Miramontes-Murillo, R., Arriola-Guevara, E., Guatemala-Morales, G., Toriz, G., and Pelayo-Ortiz, C. (2014). “Immobilization of Actinobacillus succinogenes by adhesion or entrapment for the production of succinic acid,” Bioresour. Technol. 164, 113-118. DOI: 10.1016/j.biortech.2014.04.081
Hossain, N., Zaini, J. H., and Mahlia, T. M. I. (2017). “A review of bioethanol production from plant-based waste biomass by yeast fermentation,” Int. J. Technol. 8(1), 5-18. DOI: 10.14716/ijtech.v8i1.3948
Kim, M. I., Kim, N. J., Shang, L., Chang, Y. K., Lee, S. Y., and Chang, H. N. (2009).
“Continuous production of succinic acid using an external membrane cell recycle system,” J. Microbiol. Biotechn. 19(11), 1369-1373. DOI: 10.4014/jmb.0903.3034
Li, J., Zheng, X.-Y., Fang, X.-J., Liu, S.-W., Chen, K.-Q., Jiang, M., Wei, P., and Ouyang, P.-K. (2011). “A complete industrial system for economical succinic acid production by Actinobacillus succinogenes,” Bioresour. Technol. 102(10), 6147-6152. DOI: 10.1016/j.biortech.2011.02.093
Li, Q., Wang, D., Wu, Y., Yang, M., Li, W., Xing, J., and Su, Z. (2010a). “Kinetic evaluation of products inhibition to succinic acid producers Escherichia coli NZN111, AFP111, BL21, and Actinobacillus succinogenes 130ZT,” J. Microbiol. 48(3), 290-296. DOI: 10.1007/s12275-010-9262-2
Li, Q., and Xing, J. (2015). “Microbial succinic acid production using different bacteria species,” in: Microorganisms in Biorefineries, B. Kamm (ed.), Springer Berlin Heidelberg, Berlin, Heidelberg, pp. 183-206.
Li, Q., Yang, M., Wang, D., Li, W., Wu, Y., Zhang, Y., Xing, J., and Su, Z. (2010b). “Efficient conversion of crop stalk wastes into succinic acid production by Actinobacillus succinogenes,” Bioresour. Technol. 101(9), 3292-3294. DOI: 10.1016/j.biortech.2009.12.064
Lin, S. K. C., Du, C., Koutinas, A., Wang, R., and Webb, C. (2008). “Substrate and product inhibition kinetics in succinic acid production by Actinobacillus succinogenes,” Biochem. Eng. J. 41(2), 128-135. DOI: 10.1016/j.bej.2008.03.013
Litsanov, B., Brocker, M., and Bott, M. (2012). “Toward homosuccinate fermentation: Metabolic engineering of Corynebacterium glutamicum for anaerobic production of succinate from glucose and formate,” Appl. Environ. Microb. 78(9), 3325-3337. DOI: 10.1128/AEM.07790-11
Luthfi, A. A. I., Jahim, J. M., Harun, S., Tan, J. P., and Mohammad, A. W. (2016). “Biorefinery approach towards greener succinic acid production from oil palm frond bagasse,” Process Biochem. 51(10), 1527-1537. DOI: 10.1016/j.procbio.2016.08.011
Luthfi, A. A. I., Jahim, J. M., Harun, S., Tan, J. P., and Mohammad, A. W. (2017a). “Potential use of coconut shell activated carbon as an immobilisation carrier for high conversion of succinic acid from oil palm frond hydrolysate,” RSC Adv. 7(78), 49480-49489. DOI: 10.1039/C7RA09413B
Luthfi, A. A. I., Manaf, S. F. A., Illias, R. M., Harun, S., Mohammad, A. W., and Jahim, J. M. (2017b). “Biotechnological route for sustainable succinate production utilizing oil palm frond and kenaf as potential carbon sources,” Appl. Microbiol. Biot. 101(8), 3055–3075. DOI: 10.1007/s00253-017-8210-z
Leszczewicz, M., and Walczak, P. (2014). “Succinic acid biosynthesis by Corynebacterium glutamicum,” Biotechnology and Food Science 78(1), 25-43.
Manaf, S. F. A., Jahim, J. M., Harun, S., and Luthfi, A. A. I. (2018). “Fractionation of oil palm fronds (OPF) hemicellulose using dilute nitric acid for fermentative production of xylitol,” Ind. Crop. Prod. 115, 6-15. DOI: 10.1016/j.indcrop.2018.01.067
Nghiem, N. P., Kleff, S., and Schwegmann, S. (2017). “Succinic acid: Technology development and commercialization,” Fermentation 3(2), 1-26. DOI: 10.3390/fermentation3020026
Rorke, D. C. S., and Kana, E. B. G. (2017). “Kinetics of bioethanol production from waste sorghum leaves using Saccharomyces cerevisiae BY4743,” Fermentation 3(2), 1-19. DOI: 10.3390/fermentation3020019
Salvachúa, D., Smith, H., St. John, P. C., Mohagheghi, A., Peterson, D. J., Black, B. A., Dowe, N., and Beckham, G. T. (2016). “Succinic acid production from lignocellulosic hydrolysate by Basfia succiniciproducens,” Bioresour. Technol. 214, 558-566. DOI: 10.1016/j.biortech.2016.05.018
Santos, R. B., Hart, P., Jameel, H., and Chang, H.-m.. (2013). “Wood based lignin reactions important to the biorefinery and pulp and paper industries.” BioResources 8(1), 1456-1477.
Saxena, R. K., Saran, S., Isar, J., and Kaushik, R. (2017). “Production and applications of succinic acid,” in: Current Developments in Biotechnology and Bioengineering, A. Pandey, S. Negi, and C. Soccol (eds.), Elsevier, Amsterdam, Netherlands, pp. 601-630.
Siripatana, C., Jijai, S., and Kongjan, P. (2016). “Analysis and extension of Gompertz-type and Monod-type equations for estimation of design parameters from batch anaerobic digestion experiments,” AIP Conf. Proc. 1775(1). DOI: 10.1063/1.4965199
Sluiter, A., Ruiz, R., Scarlata, C., Sluiter, J., and Templeton, D. (2008). Determination of Extractives in Biomass (NREL/TP-510-2619), National Renewable Energy Laboratory, Golden, CO.
Song, H., Jang, S. H., Park, J. M., and Lee, S. Y. (2008). “Modeling of batch fermentation kinetics for succinic acid production by Mannheimia succiniciproducens,” Biochem. Eng. J. 40(1), 107-115. DOI: 10.1016/j.bej.2007.11.021
Wang, C., Li, Q., Wang, D., and Xing, J. (2014). “Improving the lactic acid production of Actinobacillus succinogenes by using a novel fermentation and separation integration system,” Process Biochem. 49(8), 1245-1250. DOI: 10.1016/j.procbio.2014.04.009
Xu, J., Wang, Z., Sharma-Shivappa, R. R., and Cheng, J. (2011). “Enzymatic hydrolysis of switchgrass and coastal Bermuda grass pretreated using different chemical methods,” BioResources 6(3), 2990-3003. DOI: 10.15376/biores.6.3.2990-3003
Yang, S.-T., Liu, X., and Zhang, Y. (2007). “Chapter 4 – Metabolic engineering – Applications, methods, and challenges,” in: Bioprocessing for Value-added Products from Renewable Resources, S.-T. Yang (ed.), Elsevier, Amsterdam, Netherlands, pp. 73-118.
Zakaria, M. R., Hirata, S., and Hassan, M. A. (2015). “Hydrothermal pretreatment enhanced enzymatic hydrolysis and glucose production from oil palm biomass,” Bioresour. Technol. 176, 142-148. DOI: 10.1016/j.biortech.2014.11.027
Zheng, P., Dong, J.-J., Sun, Z.-H., Ni, Y., and Fang, L. (2009). “Fermentative production of succinic acid from straw hydrolysate by Actinobacillus succinogenes,” Bioresour. Technol. 100(8), 2425-2429. DOI: 10.1016/j.biortech.2008.1.043
Zheng, P., Fang, L., Xu, Y., Dong, J.-J., Ni, Y., and Sun, Z.-H. (2010). “Succinic acid production from corn stover by simultaneous saccharification and fermentation using Actinobacillus succinogenes,” Bioresour. Technol. 101(20), 7889-7894. DOI: 10.1016/j.biortech.2010.05.016
Zhu, Y. (2007). “Chapter 14 – Immobilized cell fermentation for production of chemicals and fuels,” in: Bioprocessing for Value-added Products from Renewable Resources, S.-T. Yang (ed.), Elsevier, Amsterdam, Netherlands, pp. 373-396.
Article submitted: May 24, 2018; Peer review completed: August 25, 2018; Revised version received: August 29, 2018; Accepted: September 17, 2018; Published: September 20, 2018.
DOI: 10.15376/biores.13.4.8279-8294