
Abstract
The largest mechanical pulp production units are high-consistency refiners. In the high-consistency refiners, in-situ measurements of pulp quality are rare. Temperature profile is one of the measurements that is industrially applicable to estimate pulp quality. It measures the steam temperature in the refining area – but how it can detect deteriorated pulp quality will be shown. This paper analyzed the high-consistency refiner plate temperature and its correlation to pulp quality in a 1.34 MW pilot-scale Sunds RGP-44 variable speed refiner in a variety of operating conditions and particularly at production rates close to maximum refiner capacity. The study showed that there was a narrow band of optimal refining conditions at the maximum refiner production level just before pulp quality drastically decreased. When the refiner was pushed above this optimal point of operation, the plate temperature rapidly increased above normal refining temperature, causing reduction of fiber length and consequently lower pulp strength and quality. Thus, refiner plate temperature measurement was found to be a quick way and an effective tool for preventing low-quality pulp production through overloading the refiner.
Download PDF
Full Article
Maximizing Pulp Output and Quality through Measurement of Plate Gap Temperature in High-consistency Refining
Antti Fredrikson,a,* and Jouni Paltakari b
The largest mechanical pulp production units are high-consistency refiners. In the high-consistency refiners, in-situ measurements of pulp quality are rare. Temperature profile is one of the measurements that is industrially applicable to estimate pulp quality. It measures the steam temperature in the refining area – but how it can detect deteriorated pulp quality will be shown. This paper analyzed the high-consistency refiner plate temperature and its correlation to pulp quality in a 1.34 MW pilot-scale Sunds RGP-44 variable speed refiner in a variety of operating conditions and particularly at production rates close to maximum refiner capacity. The study showed that there was a narrow band of optimal refining conditions at the maximum refiner production level just before pulp quality drastically decreased. When the refiner was pushed above this optimal point of operation, the plate temperature rapidly increased above normal refining temperature, causing reduction of fiber length and consequently lower pulp strength and quality. Thus, refiner plate temperature measurement was found to be a quick way and an effective tool for preventing low-quality pulp production through overloading the refiner.
Keywords: High-consistency refining; Thermomechanical pulping; Temperature measurement; Plate gap; Consistency; Energy efficiency
Contact information: a: A Fredrikson Research & Consulting Ltd., Vähäkuja 2a2, FI-40520 Jyväskylä, Finland; b: Department of Bioproducts and Biosystems, Aalto University, Vuorimiehentie 1, FI-02150, Espoo, Finland; *Corresponding author: antti@afrc.fi
INTRODUCTION
The temperature profile of a high-consistency refiner plate gap in the thermomechanical pulping (TMP) refiner has been shown to be a sensitive measure of the stable production conditions for maximum quality pulps. Because temperature measurement of this kind has been tested over the years in many sizes of refiners and it has shown required durability and stability, the findings and suggestions made in this paper can be implemented on an industrial scale (May et al. 1973; Atack and Stationwala 1975; Härkönen et al. 1997; Mosbye et al. 2001; Eriksen 2002; Eriksson et al. 2002; Lawton 2003; Huhtanen 2004; Sikter et al. 2007; Karlström et al. 2008; Fredrikson et al. 2009; Karlström and Hill 2014, 2018).
The analysis outlined in this paper offers new information of the high-consistency refiner plate gap phenomena. Previously, refining and the plate gap phenomena has been explained based on the fiber perspective (Vehniäinen 2008), flow modelling (Huhtanen 2004), entropy modelling (Eriksson 2005), or physical models (Härkönen et al. 1997).
In one of the latest low-consistency refining publications, the optimal plate gap of refining was explored (Harirforoush et al. 2017). At low-consistency refining, the use of temperature profile measurement is different from high-consistency, as liquid water limits the temperature rise over boiling point. In earlier studies, the temperature rise in the high-consistency refiner plate gap has been recognized as plate clash or fiber pad collapse; i.e., the situation when rotor bars touch the stator bars or the occurrence of steam evacuation problems (Allison et al. 1995; Eriksson and Karlström 2009; Karlström and Eriksson 2014).
In the work of Sikter et al. (2007), plate gap temperature had an effect called “r peak”, which is the radial position of maximum temperature at the plate gap. The radial position of maximum temperature depended on operating parameters of the refiner but only minimally. Those measurements were taken in an industrial-scale refiner with large refining area, large radius, and one rotational speed.
In their studies, Miles and Omholt (2008) reported that poor quality, short fiber coarse material was associated with situations in which the pulp pad was loaded with excessive levels of stress in the refiner plate gap. The stress and density of the fiber pad in the refiner has been shown to have radial profiles (Fredrikson et al. 2017; Fredrikson and Paltakari 2018).
The first evidence of temperature profiles or self-pressurization of the plate gap in high-consistency refiners was gathered by May (1973). In previous studies researchers have assumed equal temperatures of the phases: fiber/wood, water, and steam. Furthermore, full saturation of the liquid and vapor phase was also assumed in accordance with Karlström et al. (2008). These assumptions are vital for the feasibility of temperature measurements for the pressure calculation and further estimations.
Is it possible to control the pulp quality with temperature profile measurement in high-consistency refiners? In this study, temperature profile measurements were performed in the high-consistency pilot TMP refiner with simultaneous pulp sampling and quality evaluations. The objective of this study was to find out the joint optimum of unit energy consumption and pulp quality, simultaneously finding out the methods in avoiding collapse of pulp quality.
EXPERIMENTAL
Materials
The refining trials were conducted in the KCL Pilot plant at Espoo, Finland with a pilot scale RGP-44DD TMP refiner that was manufactured by Sunds Defibrator AB (1991; Valkeakoski, Finland). The refiner, with a 1.34 MW variable speed main motor, was used to refine Norway spruce round (Picea abies) wood chips (UPM-Kymmene Ltd., Jämsänkoski, Finland) and also the secondary stage pulps made of the same wood raw material. This refiner is special because it can be operated both in double disc mode (both rotors are running) or in the single disc mode (only feed side rotor running). As shown in Fig. 1, where the feed side rotor is on the right hand side and the load side disc is on the left side of the refiner. It can also be seen how the chips or pulp can enter the refiner from the top (see red arrow), transfer to the refiner plate gap through the channels in the feed side rotor, and finally enter the refining zone where the refiner segments are attached to the discs. The segment pattern type was Metso’s bi-directional RGP42693 at all refining stages (Fig. 2). The pilot refiner used in the trials did not have separate inner and outer segments like the industrial-sized refiners. The chips enter the refining zone at the radius at 330 mm and pulp is discharged at the outer periphery at the radius at 560 mm. Twelve refiner segments form one refining plate and the conical shape cross-section spacing between the feeding side plate and the loading side plate is called the plate gap.

Fig. 1. RGP44SD/DD refiner cross-section. Red arrows show the path of the chips and pulp to the plate gap. Axially loaded shaft with load side stator disc (a) to control the plate gap of the refiner and feed-side disc rotor with main motor (b).

Fig. 2. RGP 42693 segment pattern. The taper (conical cross-section) of the plate gap is shown with grey bars and the clearance between rotor and stator in y-axis. Plate gap at r = 560 mm is typically 0.3 mm. Note: y- and x-axis are not in the equal scale. Breaker bars at radii from 330 to 430 mm and fine section from 430 to 560 mm.
Methods
Plate gap temperature measurement method in TMP pilot refiner
Plate gap temperature was measured at the stator segments with 18 pieces of K2-type thermocouples equipped with Status Instruments SEM203/TC programmable temperature transmitters (Status Instruments Ltd., Tewkesbury, England). According to standard IEC 60584-1 (2003) the tolerance of K-type thermocouple is 0.0075 °C. The thermocouples were mounted to 2-mm diameter holes at the refiner segments with epoxy (Fig. 3). The heads of thermocouples were left visible, i.e., they were not fully covered with epoxy. The thermocouples were mounted on top of the bars and the bottom of the grooves of a segment with 28-mm radial pitch from radius 330 to 560 mm. Note that thermocouples mounted at positions R332 and R560 are not associated to refining area that was exposed to wear. Plate gap temperature was also measured from the rotor side with one PT-100 sensor mounted at the True Disc Clearance (TDC) sensor at the radius of 495 mm. Temperature readings were recorded simultaneously at all radial positions. Calibration of thermocouples was done by flushing the unpressurized refiner with saturated steam and correcting the individual sensor output readings to be the same. The data acquisition was performed with the KCL-Wedge™ system (Oy Keskuslaboratorio – Centrallaboratorium AB, version 6.0, Espoo, Finland) at 0.5 Hz frequency for the temperature and for all other refiner’s on-line process variables (Kahala 2008).

Fig. 3. a) Mounting of the thermocouples to the top of the bars and the grooves of a refiner segment. Blue circles illustrate the bar top and orange circles represent the groove sensor tips. As seen, the heads of the thermocouples were left visible. b) Temperature sensor pitch along the refiner segment radius was mostly 28 mm. The inner most (R332) and the outer most (R560) temperature sensor were not mounted to the bars, instead they were on the side of the segment.

Fig. 4. Plate gap pulp sampling holes at the stator segment. Fifth hole (without arrow) is the bolt hole
Plate gap pulp sampling system
The pilot refiner, with a refiner plate outer radius of 560 mm, was equipped with a plate gap pulp sampling system. In addition to discharge pulp samples, pulp samples were taken from 20-mm holes in the plate gap from the following radii: 400, 435, 470, and 505 mm. See Fig. 4 for the holes positioning in respect of the segment pattern. The refiner had 12 segments attached at the disc and one of them had holes and tubes for the sampling.
From the pressurized plate gap, the pulp samples travelled through flexible metal tubes out from the refiner to the cyclone. High-pressure steam (500 kPa) was blown periodically through the tubes towards the refiner plate gap to be able to flush the pulp sampling ports and tubes. This procedure kept the sampling ports mostly open and ready for sampling and it did not disturb the pulp flow at the plate gap. See Fig. 5 of the illustration from the outside of refiner for tubes, valve assembly, and the cyclone for the pulp sampling.

Fig. 5. The layout of the plate gap pulp sampling system
Running the Refining Trial
The refiner trials were conducted by setting the refining conditions as stable as possible. Refiner casing temperature (or the pressure) was controlled with fresh steam flow, blow back steam flow, and discharge steam flow control. Typically, the fresh steam control was set to manual and the blow back and discharge control loops were given pressure set points. Production rate was controlled by feeding screw rotational speed and that was not changed during the one set of trial points. Dilution water flow was set manually to dilute the refined pulp to approximately 30% dry matter content. The refiner load was controlled by altering the plate gap. There was no automatic control loop for the plate gap in the pilot refiner but two buttons for the operator — to reduce and to increase — the plate gap. Pulp samples were collected with a 4-L scoop from the atmospheric pulp discharge first to 100-L buckets and, after mixing the collected large sample, the actual samples were packed to 4-L plastic bags for the storage. The 100-L pulp sampling was always performed during the whole trial point time (from 5 min to 15 min) by altering the time interval between two subsequent scooping.
Testing the Effect of Temperature Measurement Location at Refiner Segment
Temperature measurement in the modern TMP refiner is a fairly easy task. In the past, in most of the trials the thermocouples were positioned under a protecting sheath. In this study, the assembly location of the temperature sensor head was assessed by evaluating the measured values from the top of the refiner segment bar and the bottom of the groove (Fig. 3).
Different Rotational Speed Trials with Pilot Refiner
Three distinct primary stage refining trials with various plate gap clearances were performed with rotor rotational speeds of 1200, 1500, and 2200 rpm. The same plate pattern (Fig. 2.) was used in all these trials. The refining casing pressure production rate and dilution water flow were similar in all trials (Table 1).
Table 1. Refining Parameters for Rotational Speed Tests

Chips and Pulp Refining — Primary and Secondary Refining Stage
In the primary stage (with chips) refining test 300 kPa over pressure and 1500 rpm rotational speed were used and in the secondary stage (with pulp) pressure was 150 kPa and rotational speed was 1500 rpm. In the secondary stage refining tests, the fiber flow to the refiner was pulp and the Canadian standard freeness (CSF) levels were lower compared to the primary stage.
While keeping the other refining parameters constant (refiner casing pressure, production rate, and dilution water flow), the loading of the refiner was increased via reducing the plate gap clearance, and the changes in temperature profile, axial thrust, motor load, and rotational speed were monitored. Pulp samples were collected in multiple parts during the 5-min trial points to ensure the representativeness. In the primary stage, trial production rate was approximately 800 kg/h. Plate gap clearance was varied from 0.2 to 1.0 mm to obtain various motor loads. Production rate at the secondary stage refining was 524 kg/h. Plate gap varied from 0.2 mm to 1.3 mm and only a small change was made for the dilution water flow (from 10 to 8 L/min, respectively). The pulp produced at each trial point was analyzed according to ISO standards. Fiber length was measured with a Kajaani FS-300 fiber analyzer (Metso Automation Ltd., Kajaani, Finland) according to the ISO 16065-1 (2001) standard. The accuracy of Kajaani FS fiber analyzers is considered precise as the previous version FS-100 reached a standard error of 0.0016 mm with 95% confidence level (Copur and Makkonen 2007). The CSF was determined according to ISO 5267-2 (2001) standard.
Primary and secondary stage refining tests were performed to show fiber cutting in the presence of temperature peaks. “Fiber cutting” was defined to occur when pulp fiber length differed from the logarithmic CSF and fiber length curve (Figs. 13 and 15). The presence of the “temperature peak” occurred when two adjacent temperature readings had a large difference or the outer periphery temperatures differed from the refiner casing temperature (Fig. 12).
Temperature Peak and Fiber Cutting Evaluated with Plate Gap Pulp Sampling
The phenomena of fiber cutting in the low plate gap periods was observed by taking pulp samples from the plate gap with sampling ports. All results and the explanation of the whole plate gap pulp sampling experiment can be found from Sari Liukkonen’s IMPC 2014 presentation (Liukkonen et al. 2014). In the study, the chip raw material was macerated to see the potential of the pulp fiber length, i.e., see the original fiber length of the raw material. The pulp samples taken from the plate gap were also macerated to find out what the fiber length of the full stream is, not only the already-fibrillated part of the pulp. In Fig. 6, the refiner segment pair is shown. The coarse segment pattern was used in the rotor position and the fine pattern (with sampling holes) was used in the stator position. A rotor speed of 1500 rpm was used in the presented trial.

Fig. 6. Segment patterns used in the trial; (a) fine pattern used in the stator position with the pulp sampling ports and (b) coarse pattern used in the rotor position (the extra hole was for the TDC sensor)
RESULTS AND DISCUSSION
Effect of Temperature Measurement Location at Refiner Segment
In normal operation, the stator bar pattern at the groove is filled with stagnant pulp. It was not known how much this dense pulp pad affects the temperature readings at the pilot refiner. After a series of trials, it was shown that there were no differences in the average values between the bar top and groove at all radial positions. However, the standard deviation of temperature was much higher in the bar top location, which corresponded to faster reaction to changes in ambient temperature (Fig. 7).
Figure 7 shows 10 min sampling of temperature data from two sensors at the radial position of 494 mm. It was observed that the temperature at top of the bar (black line) was more sensitive for rapid changes. Temperature value in the groove of segment pattern (red line) was more stable as the pulp on the stator groove acted as a heat insulator. The bar top surfaces were clear of pulp and consequently reacted faster.

Fig. 7. Temperature at top of bar of the segment (black) or groove (red); the temperature at the groove had smaller variation than the temperature on the top of bar
The standard deviation for temperature at the groove was 0.1 °C, and at the top of the bar it was 0.5 °C. Nevertheless, the average values were the same. In this trial, the variation in the bar top temperature was caused by the oscillation in the pressure regulating valve. The oscillation of the valve opening had same time constant with temperature values. The result is important; as the refining segments wear on the bar tops and the sensors in that location will be destroyed before the end of segment-life time. Temperature sensors in the grooves have more lifetime expectancy.
Effect of Rotational Speed to Temperature Profiles
The plate gap range covered the refining net load from 500 kW to 1200 kW, i.e., from Specific Energy Consumption (SEC) 0.63 MWh/o.d. metric tons to 1.50 MWh/o.d. metric tons. Figures 8 through 10 represent temperature profiles with different loads, i.e., with different plate gap clearances. It can be seen that maximum temperature decreased with reduced load, i.e., with increased plate gap clearance, but the radial location of the maximum temperature peak(s) did not change with fixed rotational speed. Maximum temperature appeared at radii of 410, 430, and 470 mm for the respective rotational speeds of 1200, 1500, and 2200 rpm. It seems obvious that higher rotational speed moves the radial location of maximum temperature outwards. This is important for the segment pattern designers when patterns are optimized for refiners operating at different nominal speeds. The frequency of the electrical grid causes the nominal speed to be different in North America 60 Hz and Europe 50 Hz. Same type of refiners are used in both areas. Therefore refiners have RPM 1800 in North America and 1500 in Europe.
The trials clearly showed that the radial location of the maximum temperature in the plate gap did not change within whole operation range of plate gap clearances when rotational speed was fixed (as shown in Figs. 8 through 10).
It is thought that chips or pulp together with water are the main hindering media of steam flow in the plate gap. It was proposed that the relative radial flow resistance for steam did not change significantly within normal plate gap operation range, which in this refiner was 0.20 to 0.65 mm. This is consistent with the results with industrial-size refiners conducted by Härkönen and Tienvieri (1995).

Fig. 8. Surface map of temperature (°C), radius of refiner segment (mm), and refiner motor load (kW); rotational speed 1200 rpm

Fig. 9. Surface map of temperature (°C), radius of refiner segment (mm), and refiner motor load (kW); rotational speed 1500 rpm

Fig. 10. Surface map of temperature (°C), radius of refiner segment (mm), and refiner motor load (kW); rotational speed 2200 rpm
Chips and Pulp Refining: Primary and Secondary Refining Stage
At the primary stage test, it can be noticed in Fig. 11 that in the low end of plate gap clearance the maximum temperature deviated greatly from linear dependency of the plate gap and axial thrust. Furthermore, in Fig. 12 a large deviation was observed in temperature with 0.28-mm plate gap at the radii of 450 mm and above. The deviation can be observed when comparing the temperature profiles with 0.37-mm and 0.41-mm plate gaps. When comparing the temperature profiles of the normal operation range in Fig. 9, it was clear that the rise in temperature occurred at different radii. Exact values of the trial point setup and pulp properties presented in Figs. 11 to 13 are shown in Table 2.
Table 2. Trial Point Parameters, Their Values, and Pulp Properties of Primary and Secondary Stage Test


Fig. 11. Maximum temperature in the refining zone and the axial thrust of refiner stator disc in the function of plate gap

Fig. 12. Primary stage refining temperature profile with various plate gaps; see Fig. 2 for axis declaration
Most importantly, a 0.5 mm drop, from the normal refining curve, in the length weighted average fiber length of the produced pulp was observed (Fig. 13). The normal refining curve was generated by refining the pulp more in the secondary stage. Observe the secondary stage pulp trial point values and pulp parameters in Table 2. Later in this paper, how this kind of situation may develop and how difficult it is for refiner operators to notice the fiber length drop from the normal refiner control parameters, such as motor power or plate gap, will be shown.

Fig. 13. Length weighted (lw) average fiber length in the function of CSF for the primary stage test
Secondary Stage Refining in the Edge of Maximum Energy Efficiency
The reduction of the plate gap clearance caused a “temperature peak” or actually a hot rim at the radius of 500 mm (Fig. 14). According to the pulp samples taken simultaneously, the average fiber length of pulp was remarkably lower in comparison to other secondary stage pulps. This is called “fiber cutting”. The secondary stage pulps’ CSF and average fiber length are shown inside the orange box in Fig. 15. Other fiber length values in Fig. 15 are from the same refining trial with different refining conditions that did not lead to fiber cutting.

Fig. 14. Secondary stage refining average radial temperature profile with various plate gaps; see Fig. 2 for axis declaration

Fig. 15. Reduced length weighted (lw) fiber length from refining curve marked with circle– fiber cutting; secondary stage pulp average fiber lengths are shown inside of the drawn rectangle
Exact values of the trial point parameters and pulp properties of secondary stage that are presented in Figs. 14 and 15 are shown in Table 3.
Table 3. Trial Point Setup and Pulp Properties of Secondary Stage Test
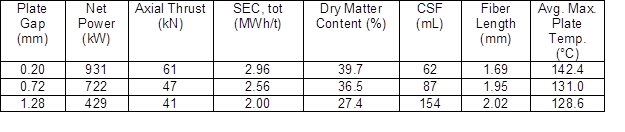
As shown in Fig. 16, the temperature in the hot rim area (Radius R494 mm) had higher scatter and higher-than-average neighboring measurement points (radial distance between measurement points was 28 mm).

Fig. 16. Individual temperature readings of the profile during a 9-min period; temperature readings are from “temperature peak”; R332 indicates the radius of the measurement (332 mm).
A similar temperature rise was observed in the temperatures measured on the rotor side with thermometer at the TDC-sensor. Figure 17 shows the motor load had slightly higher variation in this small plate gap and temperature peak period. The rotational speed variation was not changed, although KCL’s refiner motor is operated with a frequency converter and is not as stable as industrial-size synchronized motors. It is impossible to detect the temperature peak from the other process values. Therefore, it is important to utilize plate gap temperature profile measurements in industrial-size refiners to be able to maintain a high quality of pulp or at least prevent fiber cutting.

Fig. 17. Motor load, plate gap, and rotational speed during the high rise of temperature at the plate gap; the same 9-min period as in Fig. 15
Temperature Peak and Fiber Cutting Evaluated with Plate Gap Pulp Sampling
The discharge pulp samples from trial points were analyzed for CSF and fiber length, but it was impossible to decipher from these results in which radial part of the refiner zone the fiber cutting happened (Table 4).
Table 4. Average Values for the Sampling Periods for Plate Gap Pulp Sampling Trial Points

The greatest changes in the temperature profile were visible in the area where plate gap clearance was narrow. The full temperature profile is shown in Fig. 18, along with the development of the temperature peak. In this case, high temperatures occurred with fine stator and coarse rotor at the radius 466 and above. See Fig. 19 for the plate gap profile of fine stator and coarse rotor (black lines). When the plate gap was reduced the load of the refiner was increased. Between refiner loads of 600 and 900 kW, a peak to the temperature profile formed and fiber cutting occurred.

Fig. 18. 3D graph of temperature, load, and refiner radius showing the development of temperature peak

Fig. 19. The average plate gap temperature profiles just before the sampling of the pulps from the plate gap
During the trial point with 1239 kW average net power, pulp samples were taken from the plate gap and analyzed for fiber length. The last data point in the radius of 560 mm was the discharge sample.
These pulp samples from the plate gap sampling ports of the refining zone showed gradual reduction of length weighted average fiber length after the pulp passed the sampling port, which was located at 435 mm radius (Fig. 20).

Fig. 20. Length weighted (lw) average fiber length of the plate gap pulp samples marked with squares; sampling ports 400, 435, 470, and 505 mm and the discharge sample (560 mm)
The important finding was that temperature peaks and fiber cutting are linked together. Every time a high peak in the temperature profile was recorded the lowered average fiber length can be expected.
Discussion
These results show that the temperature measurement at the refiner plate gap can be used as a fast soft sensor of the unstable refining condition. Those conditions have been reported to cause poor pulp quality (Miles and May 1989), and it was shown in this study that temperature peak and fiber cutting are linked together. The pulp quality control systems using soft sensors can be improved (Zhang et al. 2016; Karlström and Hill 2018). Additionally, by using the knowledge — and with the help of sophisticated control loops — mills can increase the bonding potential of the pulp by avoiding the fiber cutting tendency.
Refining conditions can be varied greatly with the pilot refiner. Different running situations can be simulated and precise pulp samples can be taken exactly from evaluated events. The KCL’s pilot refiner is rather small but still big enough to have a pressurized plate gap. In 2008, the refiner was modernized thoroughly — 18 new temperature gauges, 4 force sensors with high-speed data acquisition, and a plate gap pulp sampling system enabled unseen possibilities to explore high-consistency plate gap phenomena. In this study, the refiner was tuned to small plate gap clearances to simulate situations when pulp in the refining zone dries too much and fiber cutting occurs. In mill-size refiners, these kinds of situations may happen locally due to disturbed pulp flow. On–line pulp analyzers after the refiners are too slow to detect such disturbances and tons of low-quality pulp could be produced without any direct indication of it.
The authors propose that the measured temperatures in the TMP refiner plate gap represent the temperature of steam similarly as described by Karlström et al. (2008). As long as there is free water available (free water is not bound to fiber cell walls), the vapor phase consists of saturated steam. The temperature of fibers does not necessarily follow measured temperature readings; because the chips enter the refining zone rapidly and are rather large in size, the temperature transfer is slow in wood, compared to heat transfer in steam. After the breaker bar zone, it is expected that the temperature of fibers is the same as steam because the particles are small and the turbulence is high.
For high-temperature areas in the plate gap, it seemed that all water droplets had evaporated and the remaining liquid water was in the cell walls of fibers and voids of the fiber network. Because refining creates an enormous amount of heat by friction, in the areas of high-pulp consistency the steam may superheat. The authors believe that superheating of steam can explain the temperature peaks. According to the superheating phenomena, the pressure of the steam is not increased, but instead the temperature is increased. If the steam is not superheated, it would flow through the fiber pad and therefore large temperature differences could not be seen between two measuring points, which were only 28 mm apart.
According to the theory of pressurization of the plate gap, it is possible to record increased temperature in the refining zone — higher than in refiner casing or in chip feed — only if the flow of generated steam is hindered at any location at the refining area. The authors believe that water and fibers (the fiber pad) are the main hindering media for the steam in the plate gap. The direct effect of plate gap clearance or segment pattern was small for the pressurizing of the plate gap, as it was unsuccessfully tried to pressurize the plate gap without pulp. Together with plate taper, the density and porosity of the fiber pad in the plate gap form the basis for characteristic temperature profile. Furthermore, it can be understood from the results that the rotational speed of the rotor had an effect on the profile.
Because the area of great friction is the whole refining area, it is believed that the temperature profile is more of a result of retention time rather than shear force profile. The authors believe that refiner load profile estimations based on the temperature measurements may have uncertainties due to the fact that distribution of porosity of fiber pad and the radius specific plate gap have a much greater effect on the temperature profile than the energy transport to fibers.
As it is assumed in most studies on the subject, steam cannot flow over the temperature maximum at plate gap, any change in the radial location of the peak is reflected in the amount of the blow back steam. Therefore, when the maximum temperature of the plate gap is changed to a greater radius it should have a positive effect on feed stability. Segment designers should develop patterns to allow the maximum temperature to be more in the outer radius.
A hot annulus, or rim at the refining zone, was generated when the load of the refiner was increased through closing the gap and the flow of dilution water was not increased to maintain stable outlet consistency. It was followed by an increased load of the refiner, the evaporation of water from pulp was increased, and then the pulp became dry and brittle, and the coefficient of friction increased considerably. The radial flow was reduced and pulp and steam were overheated. Through an overheating situation, the authors think that the situation when a high rise in temperature was recorded in the one or two measurement radii, the closing force of plate gap was not increased. In multiple tests, lowered fiber length was measured in the situations of overheated refining zone annuli. When, in most of the industrial refiners, chips and pulp are fed to the refiner with excess of dilution water, a hot annulus can be developed within the flat zone of the plate gap, i.e., in the outer radii or in the fine zone.
CONCLUSIONS
- The quality and reliability of temperature measurements were tested by installing sensor probes in the top of the refining segment bar or in the bottom of the groove. They both showed the same average temperature during TMP refining but the sensor installed in the top of the bar had much higher temporal variation. If the wear of the pattern is of concern, then the temperature sensors could be installed to the grooves of the pattern.
- The finding that a refiner plate gap clearance had a minimal or no effect on the temperature profile shape is useful for the development of refining. In other words, the shape of the temperature profile originates from steam flow resistance in the plate gap as it remained similar with various plate gaps.
- Through utilizing the temperature profile measurement in the high-consistency refiner, paper mills can produce good enough pulp quality with optimized energy efficiency. In this study, it was shown that too small of plate gaps could lead to decreased quality, which could be detected online by temperature profile measurement but is impossible to detect with on-line pulp analyzers.
- This paper also verified the different temperature profiles of different high-consistency refiners with a high-rotational speed of 2200 rpm compared to nominal 1500 rpm. The study also showed how temperature maximum had a fixed radius in the refining section with fixed rotational speed unrelated to the load of the refiner or plate gap. These findings are viable in the design of the segment bar patterns for different refiners, as the interference of blowback steam is changed with radial position of maximum temperature of plate gap.
- These results emphasize the importance of well-tuned control for refiner stability. Stable refining is essential for pulp quality and production efficiency, so the stabilization is always the first and most rewarding target toward the best available refining.
ACKNOWLEDGMENTS
The authors acknowledge Magnus Diesen and Jukka Kilpeläinen for the valuable support in manuscript preparation. Elina Horsfall-Turner is also acknowledged for language review of this paper.
The authors would like to thank VTT Oy together with Andritz, M-Real, Stora-Enso, UPM, Tekes, and the Academy of Finland (grant No. 138623) for their financial support and the permission to use research project results in the preparation of manuscript.
REFERENCES CITED
Allison, B. J., Ciarniello, J., Tessier, P., and Dumont, G. A. (1995). “Dual adaptive control of chip refiner motor load: Industrial results,” Pulp Pap.-Canada 96(3), 39-45.
Atack, D., and Stationwala, M. I. (1975). “On the measurement of temperature and pressure in the refining zone of an open discharge refiner,” Transactions of Technical Section Canadian Pulp and Paper Association 1(3), 71-76.
Copur, Y., and Makkonen, H. (2007). “Precision and accuracy studies with Kajaani fiber length analyzers,” J. Appl. Sci. 7(7), 1043-1047. DOI: 10.3923/jas.2007.1043.1047
Eriksen, O. (2002). “High-speed measurements of pressure and temperature in the refining zone of a high-consistency refiner,” in: Annual Meeting of the Pulp and Paper Technical Association of Canada, Montreal, Quebec, Canada, pp. C135-C142.
Eriksson, K., and Karlström, A. (2009). “Modeling approaches for critical process limitations in the operation of thermomechanical pulp refiners,” Nord. Pulp Pap. Res. J. 24(2), 231-238. DOI: 10.3183/npprj-2009-24-02-p231-238
Eriksson, K. (2005). An Entropy-based Modeling Approach to Internally Interconnected TMP Refining Processes, Licentiate Thesis, Chalmers University of Technology, Gothenburg, Sweden.
Eriksson, K., Karlström, A., Rosenqvist, F., and Berg, D. (2002). “The impact of different input variables in a twin-disc refiner line,” in: Control Systems 2002, Stockholm, Sweden, pp. 229-233.
Fredrikson, A., and Paltakari, J. (2018). “Fibre pad density profiles of a high-consistency TMP refiner,” J-FOR 6(1), 29-32.
Fredrikson, A., Salminen, L. I., and Härkönen, E. (2017). “Power dissipation profiles determined from force measurements in a high-consistency TMP refiner,” J-FOR 6(1), 36-44.
Fredrikson, A., Salminen, L. I., Lucander, M., and Sirviö, J. (2009). “Better understanding of TMP refiner through instrumentation,” in: 2009 International Mechanical Pulping Conference, Sundsvall, Sweden, pp. 205-208.
Harirforoush, R., Olson, J., and Wild, P. (2017). “In-process detection of fiber cutting in low consistency refining based on measurement of forces on refiner bars,” TAPPI J. 16(4), 189-199. DOI: 10.32964/TJ16.4.189
Härkönen, E., Ruottu, S., Ruottu, A. and Johansson, O. (1997). “A theoretical model for a TMP-refiner,” in: International Mechanical Pulping Conference, Stockholm, Sweden, pp. 95-102.
Härkönen, E., and Tienvieri, T. (1995). “The influence of production rate on refining in a specific refiner,” in: International Mechanical Pulping Conference, Ottawa, Canada, pp. 177-182.
Huhtanen, J.-P. (2004). Modeling of Fiber Suspension Flows in Refiner and Other Papermaking Processes by Combining Non-Newtonian Fluid Dynamics and Turbulence, Doctoral Thesis, Tampere University of Technology, Tampere, Finland.
IEC 60584-1 (2003). “Thermocouples – Part 1: EMF specifications and tolerances,” International Electrotechnical Commission, Geneva, Switzerland.
ISO 16065-1 (2001). “Pulps — Determination of fibre length by automated optical analysis —Part 1: Polarized light method,” International Organization for Standardization, Geneva, Switzerland.
ISO 5267-2 (2001). “Pulps — Determination of drainability — Part 2: “Canadian Standard” freeness method,” International Organization for Standardization, Geneva, Switzerland.
Kahala, J. (2008). “Missing link in process efficiency enhancement,” Pap. Puu 90(4), 48-49.
Karlström, A., and Eriksson, K. (2014). “Fiber energy efficiency Part II: Forces acting on the refiner bars,” Nord. Pulp Pap. Res. J. 29(2), 332-343. DOI: 10.3183/npprj-2014-29-02-p332-343
Karlström, A., Eriksson, K., Sikter, D., and Gustavsson, M. (2008). “Refining models for control purposes,” Nord. Pulp Pap. Res. J. 23(1), 129-138. DOI: 10.3183/npprj-2008-23-01-p129-138
Karlström, A., and Hill, J. (2014). “Refiner optimization and control Part II: Test procedures for describing dynamics in TMP refining processes,” Nord. Pulp Pap. Res. J. 29(4), 653-662. DOI: 10.3183/npprj-2014-29-04-p653-662
Karlström, A., and Hill, J. (2018). “Control strategies for refiners Part II: Consistency control in twin-disc refining zones using temperature profile information,” Nord. Pulp Pap. Res. J. 33(1), 44-57. DOI: 10.1515/npprj-2018-3008
Lawton, T. (2003). “Innovative technology advances TMP energy savings,” in: International Mechanical Pulping Conference, Quebéc, Canada, pp. 449-453.
Liukkonen, S., Nurminen, I., Fredrikson, A., Salminen, L. I., and Sirviö, J. (2014). “Development of pulp properties within refiner plate gap in energy efficient and cutting processes,” in: International Mechanical Pulping Conference, Helsinki, Finland, pp. 1-5.
May, W. D. (1973). “A theory of chip refining — the origin of fibre length,” Pulp Pap.-Canada 74(1), T2-T10.
May, W. D., Miles, K. B., and Jeffreys, R. C. (1973). “The measurement of temperature in a chip refiner,” in: International Mechanical Pulping Conference, Stockholm, Sweden, pp. 13.1-13.31.
Miles, K. B., and May, W. D. (1989). “Flow of pulp in chip refiners,” in: Preprints of 75th Annual Meeting of the Technical Section, CPPA, Montreal, Quebec, Canada, pp. 177-189.
Miles, K. B., and Omholt, I. (2008). “The origin and control of pulp stress during high-consistency refining,” J. Pulp Pap. Sci. 34(3), 169-173.
Mosbye, K., Kure, K.-A., Fuglem, G., and Johansson, O. (2001). “Use of refiner zone temperature measurements for refiner control,” in: International Mechanical Pulping Conference, Helsinki, Finland, pp. 481-488.
Sikter, D., Karlström, A., Engstrand, P., and Czmaidalka, J. (2007). “Using the refining zone temperature profile for quality control,” in: TAPPI International Mechanical Pulping Conference, Minneapolis, MN, USA, pp. 894-902.
Vehniäinen, A. (2008). Single Fiber Properties – A Key to the Characteristic Defibration Patterns from Wood to Paper Fibers, Doctoral Thesis, Aalto University, Espoo, Finland.
Zhang, X., Li, J., Liu, H., and Zhou, P. (2016). “Soft sensors for pulp freeness and outlet consistency estimation in the alkaline peroxide mechanical pulping (APMP) high-consistency refining process,” BioResources 11(2), 3598-3613. DOI: 10.15376/biores.11.2.3598-3613
Article submitted: October 19, 2019; Peer review completed: December 31, 2019; Revised version received and accepted: January 27, 2020; Published: February 7, 2020.
DOI: 10.15376/biores.15.2.2258-2278